
What a Job Applicant Actually Costs: 2026 Benchmarks
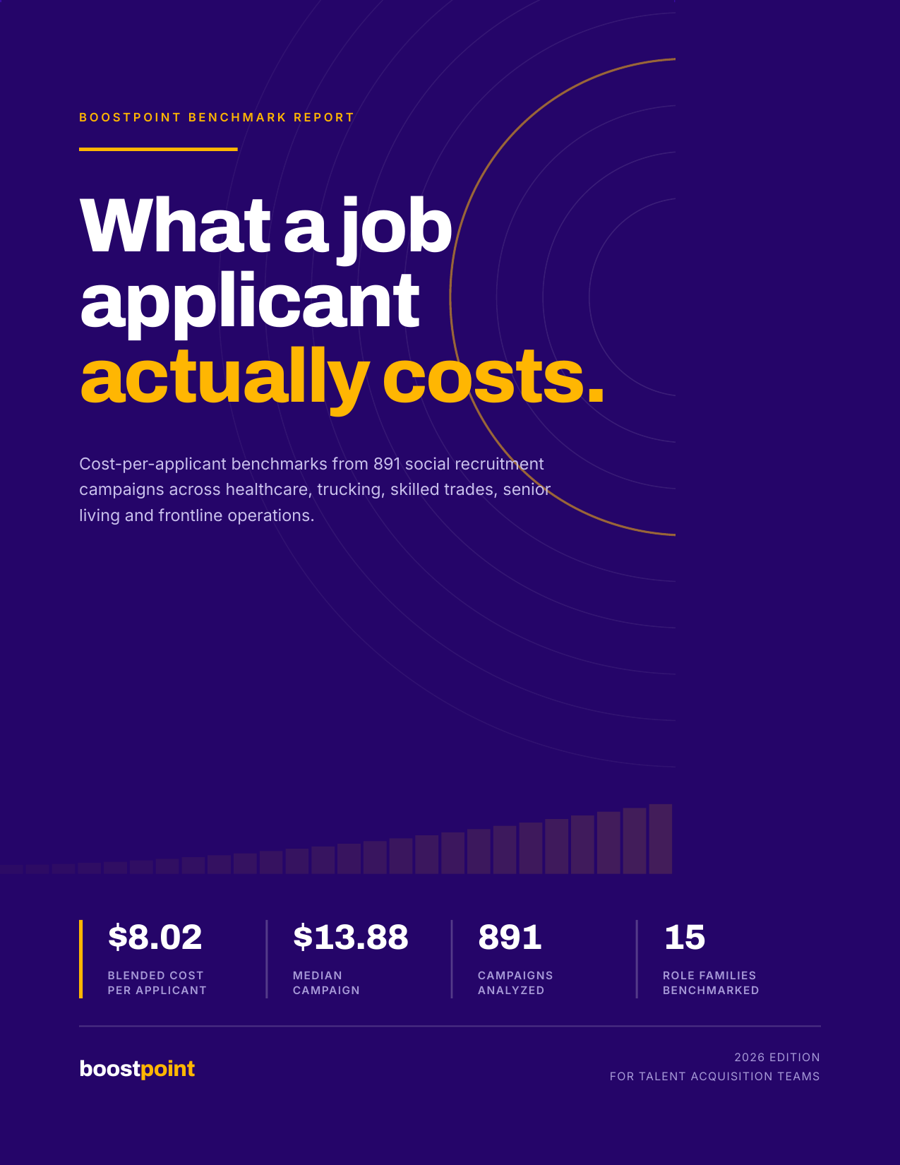
Across 891 social recruitment campaigns analyzed in 2026, the median campaign cost $13.88 per applicant and the volume-weighted average was $8.02. Half of all campaigns landed between $6.48 and $29.74. Cost varies by role from $2.71 for customer service to $74.62 for licensed therapy roles — and 70% of the difference between campaigns comes from what happens after the click, not what the ad auction charges.
Download the 2026 Benchmark Report →
Free PDF, no form required.
Why this report exists
Most job advertising benchmarks publish one average and leave you to work out whether you're winning.
An average is a poor tool for a budget conversation. If someone tells you a job applicant costs $8, that number is useless for deciding whether your $22 caregiver campaign is broken or your $19 nurse campaign is a bargain. It's also the number most likely to be quoted back at you by a finance team who found it on the internet.
So this report publishes the distribution instead — median, quartiles and full range — for every role family where we had enough data to report honestly.
Everything below is drawn from live campaign delivery, not a survey. 891 distinct campaigns. 1,334 campaign-months of measured delivery. 15 role families. All anonymized, with any segment representing fewer than three employers or fifteen campaign-months suppressed rather than published.
What an applicant actually costs
The headline finding is a gap that causes more budget arguments than any other number in job advertising.
| Percentile | Cost per applicant |
|---|---|
| Cheapest 10% | $2.91 |
| Lower quartile | $6.48 |
| Median campaign | $13.88 |
| Upper quartile | $29.74 |
| Most expensive 10% | $66.45 |
| Volume-weighted average | $8.02 |
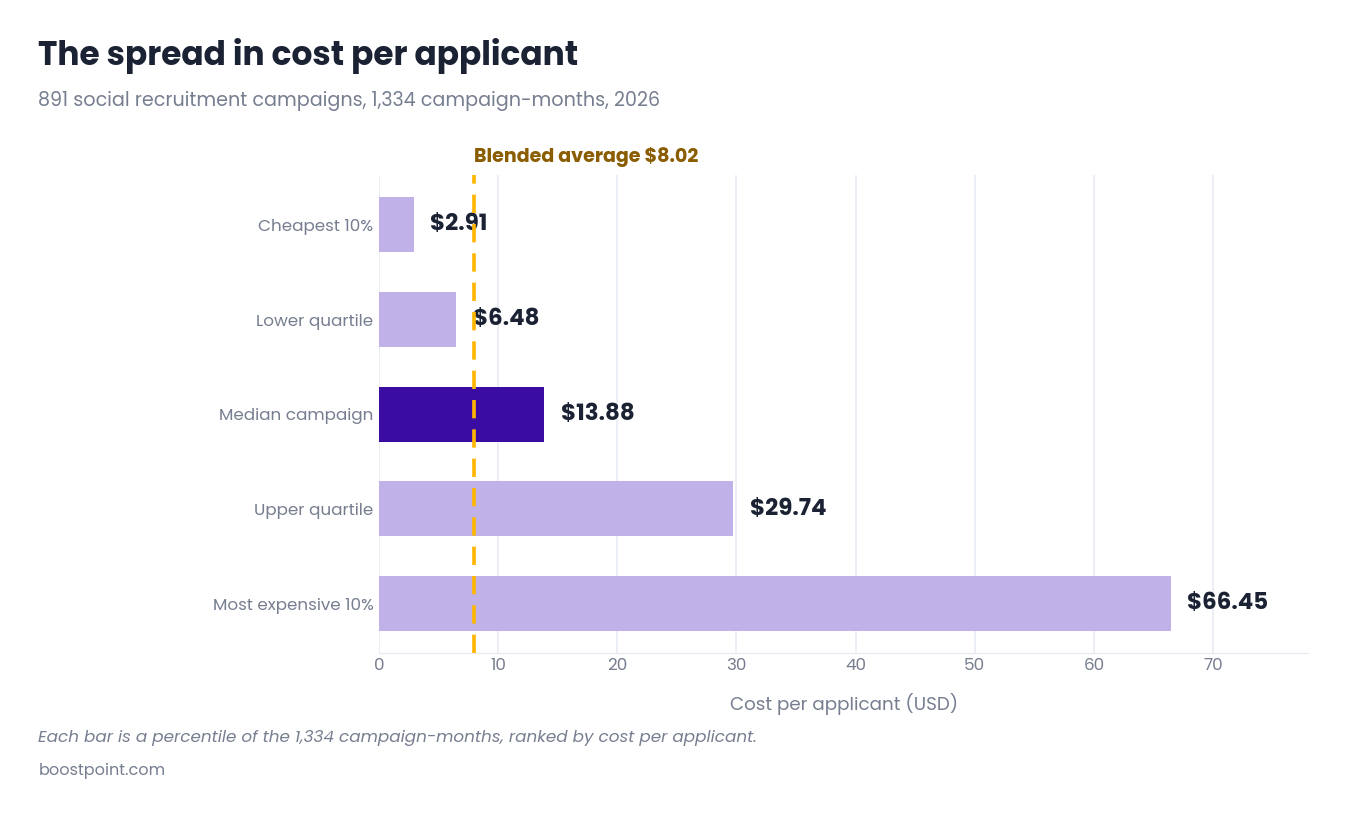
The blended average is $8.02. The median campaign costs $13.88 — nearly double. Both are correct, and confusing them is the most common error in job advertising budget reviews.
Why the gap exists
The average is weighted by volume, and volume concentrates in a few high-throughput frontline roles — caregivers, warehouse associates, customer service — that convert at exceptional rates. Those campaigns pull the average down for everyone else. The median is the truer picture of what a typical requisition costs to fill the top of.
Use the average when you're forecasting total program cost across a large mixed portfolio, or sizing an annual budget across many requisitions at once.
Use the median when you're budgeting a single requisition, judging whether a campaign is performing, or setting a hiring manager's expectations for a specific role.
The quartiles that matter
A quarter of campaigns delivered applicants for under $6.48. A quarter cost more than $29.74 — a gap of more than 5x on the same platform, in the same market, in the same period.
That spread isn't luck, and it isn't mostly role difficulty. What it actually is comes further down this page.
Cost per applicant by role
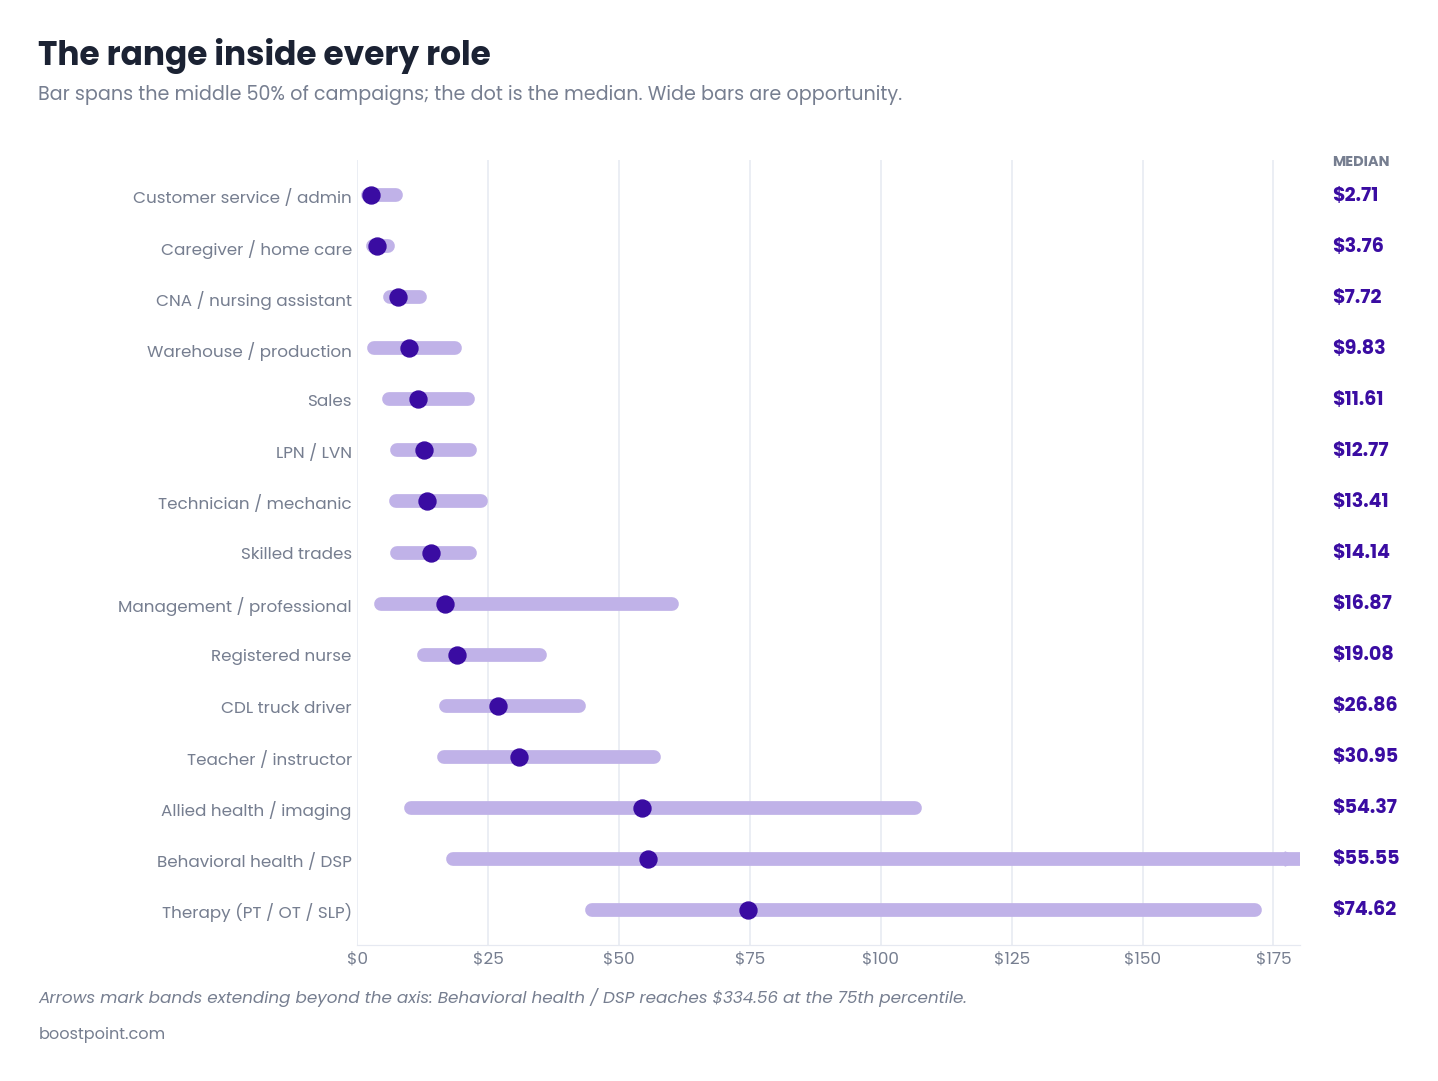
Fifteen role families, with the median and the range the middle half of campaigns actually landed in. The range is the column that matters — a single number invites the wrong argument with your finance team.
→ Scroll the table sideways to see every column.
| Role family | Median | Middle 50% | Blended | Apply rate | CTR | Campaigns |
|---|---|---|---|---|---|---|
| Customer service / admin | $2.71 | $2.14 – $7.47 | $2.98 | 25% | 1.77% | 24 |
| Caregiver / home care | $3.76 | $2.99 – $5.83 | $3.87 | 31% | 2.32% | 34 |
| Warehouse / production | $9.83 | $3.15 – $18.72 | $4.44 | 20% | 1.67% | 82 |
| Management / professional | $16.87 | $4.62 – $60.11 | $5.45 | 16% | 1.46% | 50 |
| Sales | $11.61 | $5.99 – $21.17 | $6.91 | 21% | 1.45% | 100 |
| CNA / nursing assistant | $7.72 | $6.18 – $12.06 | $8.17 | 18% | 1.15% | 32 |
| Technician / mechanic | $13.41 | $7.40 – $23.58 | $8.35 | 16% | 1.17% | 145 |
| Skilled trades | $14.14 | $7.58 – $21.49 | $10.74 | 15% | 1.07% | 35 |
| LPN / LVN | $12.77 | $7.53 – $21.46 | $12.09 | 21% | 1.11% | 57 |
| Registered nurse | $19.08 | $12.76 – $34.84 | $20.00 | 11% | 1.15% | 173 |
| CDL truck driver | $26.86 | $17.00 – $42.31 | $24.24 | 8% | 0.88% | 59 |
| Teacher / instructor | $30.95 | $16.60 – $56.74 | $25.13 | 8% | 1.12% | 15 |
| Allied health / imaging | $54.37 | $10.27 – $106.51 | $25.49 | 10% | 1.01% | 23 |
| Behavioral health / DSP | $55.55 | $18.36 – $334.56 | $36.39 | 9% | 0.75% | 19 |
| Therapy (PT / OT / SLP) | $74.62 | $44.85 – $171.40 | $64.12 | 5% | 0.84% | 39 |
Sorted by blended cost per applicant. Apply rate is the share of clickers who completed the form. Campaigns counts campaign-months.
The pattern worth naming
Expensive roles are not expensive because attention costs more.
CDL driver campaigns buy impressions more cheaply than caregiver campaigns — $17.88 per thousand against $27.88 — and still cost 6x more per applicant. The entire difference is apply rate: 8% of drivers who click finish a form, against 31% of caregivers. That gap is the subject of our detailed trucking and CDL driver recruiting data.
You are not paying for reach. You are paying for friction.
What a wide band tells you
Behavioral health and DSP campaigns ran from $18.36 at the 25th percentile to $334.56 at the 75th — an 18x spread inside a single role family. When a band is that wide, difficulty isn't the explanation. Two employers hiring the same job in the same period, with budgets of similar size, produced costs an order of magnitude apart.
And what a narrow one tells you
Where the middle 50% sits inside a tight range — caregiver and home care runs $2.99 to $5.83 — the market has effectively priced the role. Gains come from volume and speed rather than efficiency. Anyone promising a 40% cost reduction on a narrow-band role is promising something this data says doesn't happen.
Cost per applicant by sector
→ Scroll the table sideways to see every column.
| Sector | Median | Middle 50% | Blended | Apply rate | CPM | Campaigns |
|---|---|---|---|---|---|---|
| Retail / Corporate | $8.58 | $3.72 – $17.76 | $3.66 | 26% | $14.74 | 181 |
| Skilled Trades & Field Service | $11.89 | $6.50 – $24.89 | $6.65 | 18% | $15.96 | 335 |
| Transportation & Logistics | $13.34 | $5.26 – $25.17 | $10.28 | 13% | $14.82 | 184 |
| Healthcare & Senior Living | $15.42 | $7.89 – $39.61 | $11.47 | 16% | $25.18 | 553 |
| Behavioral & Education | $27.50 | $15.35 – $76.67 | $24.45 | 10% | $29.04 | 81 |
The ordering is stable and the reason is consistent: sectors hiring credentialed people cost more, because credentialed people abandon forms. The same pattern shows up in our skilled trades and construction hiring data and in manufacturing and industrial hiring, where clicks are cheap and completion is the constraint.
The predictability premium
Retail and corporate hiring held the tightest band in the study — a middle 50% of $3.72 to $17.76. Behavioral health and education ran the widest, $15.35 to $76.67.
For anyone building an annual plan, that difference matters as much as the cost itself. A predictable channel can be budgeted. A volatile one has to be managed month to month, with contingency built in from the start. Seasonal categories such as agricultural and co-op hiring add a timing dimension on top of that.
Where healthcare really sits
Healthcare and senior living is the largest sector here by campaign volume and sits fourth by cost at $11.47 blended. That single figure hides an enormous internal split: caregiver and CNA campaigns run under $8.17, while therapy campaigns run $64.12. We break that apart in our healthcare and senior living hiring data.
Reporting healthcare as one line to your executive team understates clinical costs and overstates frontline ones. Split it before anyone asks you to.
What actually drives cost
Cost per applicant is built from three inputs: what impressions cost, how many people click, and how many clickers finish the form. We tested how much of the variation between campaigns each input explains on its own.
| Input | Share of variation explained |
|---|---|
| Applicant conversion rate — what happens after the click | 70% |
| Click-through rate — how compelling the ad is | 30% |
| Cost per 1,000 impressions — what the auction charges | 18% |
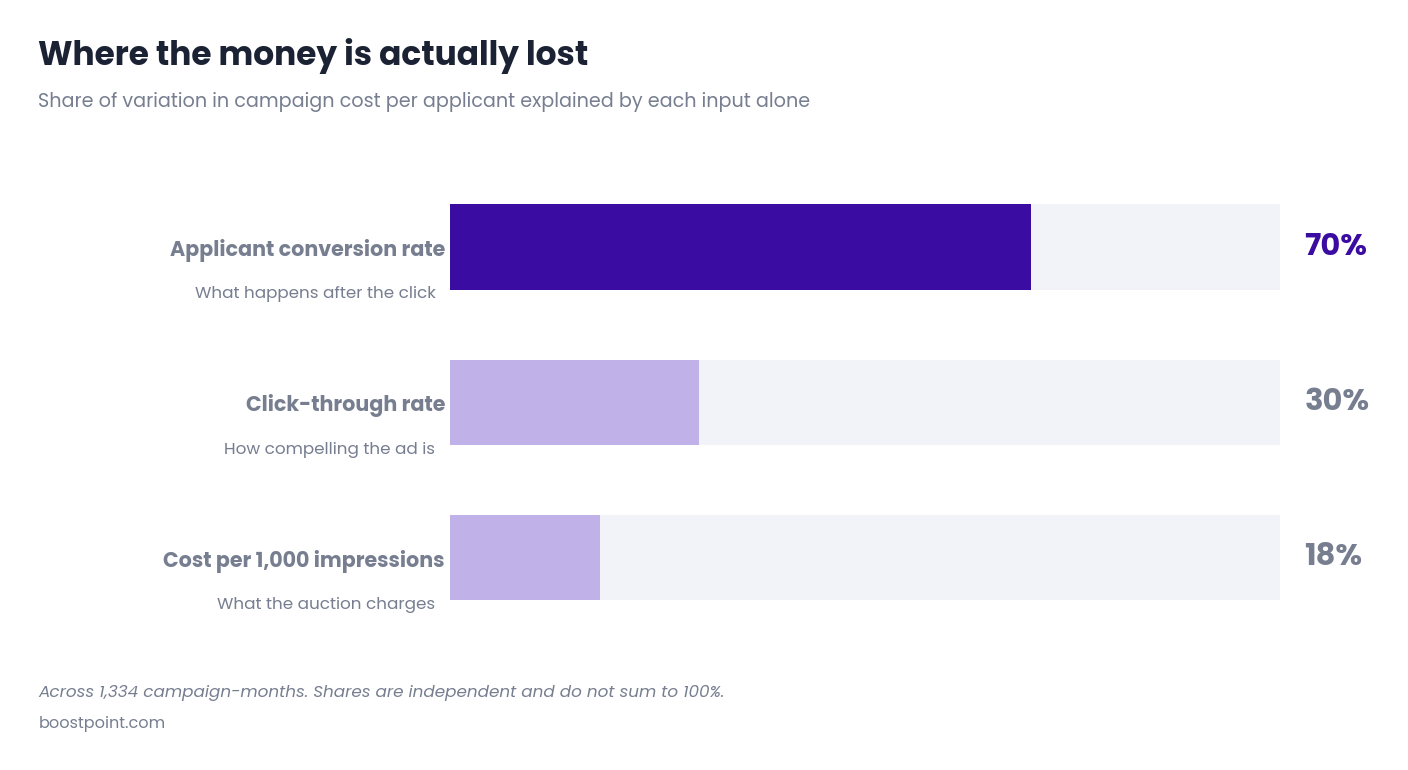
The apply experience explains 70% of why one campaign costs more than another. What the auction charges explains 18%.
Nearly every hour most teams spend negotiating media efficiency is aimed at the smallest lever.
What that looks like in budget terms
Campaigns grouped by apply rate, showing what share of total budget each band consumed and what share of applicants it returned:
| Apply rate | Cost per applicant | Share of budget | Share of applicants |
|---|---|---|---|
| Under 5% | $53.77 | 18% | 3% |
| 5–10% | $23.13 | 24% | 8% |
| 10–20% | $11.11 | 32% | 23% |
| 20–35% | $4.41 | 21% | 38% |
| Over 35% | $1.61 | 6% | 28% |
41% of all budget ran in campaigns where fewer than one in ten clickers finished the form — returning 11% of all applicants. Campaigns above 35% used 6% of budget to deliver 28%, at $1.61 each.
What moves apply rate
Campaigns in the top conversion bands share a small number of structural traits.
They keep the application on the platform. Campaigns using a native instant form — where the candidate never leaves Facebook or Instagram — consistently populate the upper bands. Campaigns routing to a career site or ATS apply flow populate the bottom two. Every additional page, login prompt and resume upload requirement removes a share of an audience that is, in most frontline categories, applying from a phone during a break. It's the core mechanic behind social media job advertising.
They ask fewer questions. The campaigns in the under-5% band are recognizable by their form length. Screening questions do useful work — they're the reason a form submission is worth more than a click — but each one is bought with volume. The teams getting the best results treat screening as a budget with a price rather than a free filter.
They screen for disqualifiers, not preferences. There's a meaningful difference between asking whether someone holds a license the job legally requires and asking about their preferred shift. The first removes people you could never hire. The second removes people you'd have hired after a five-minute conversation.
The trade-off, stated honestly
A low apply rate is not automatically a failure. A campaign converting at 6% that delivers licensed, pre-screened, ready-to-interview candidates may be a better use of budget than one converting at 35% that hands your recruiters a pile of forms to sort.
What this data can show is the price of that choice — roughly 12x the cost per applicant between the bottom band and the 20–35% band. What it cannot show is whether the quality gain was worth it. That number lives in your ATS, and it's the single most valuable thing you could start measuring this year.
The frequency cliff
Frequency is the average number of times each person in your audience saw your ad in a month. It's the most reliable early warning signal in the dataset, and almost nobody watches it.
| Monthly frequency | Median cost per applicant | Share of budget |
|---|---|---|
| Under 1.5 | $7.85 | 1% |
| 1.5 – 2.0 | $11.48 | 21% |
| 2.0 – 2.5 | $13.39 | 25% |
| 2.5 – 3.0 | $13.65 | 19% |
| 3.0 – 4.0 | $18.76 | 20% |
| Over 4.0 | $26.78 | 13% |
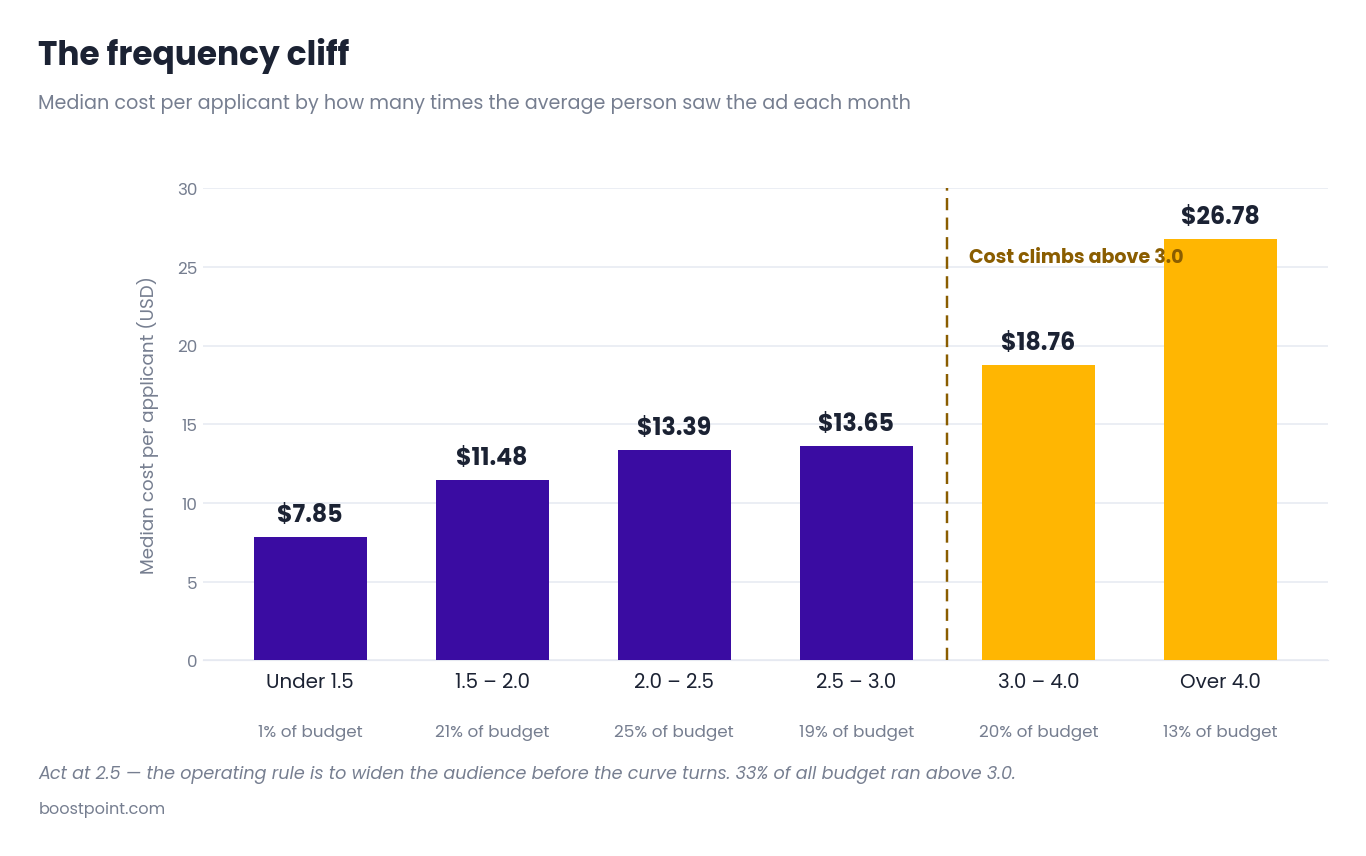
Below a monthly frequency of roughly 2.5, median cost per applicant sits between $11.48 and $13.39. Above 3.0 it rises to $18.76, and above 4.0 to $26.78 — more than double the low-frequency figure. Click-through rate falls in step, from 1.69% to 0.94%. The audience has seen it and stopped responding.
33% of all budget in this study ran above a frequency of 3.0. That's the clearest single pool of recoverable money in the report.
High frequency is almost always a budget-to-audience mismatch: a daily spend large enough to saturate the targeted audience within days. The fix is rarely to cut budget. It's to widen the audience — expand the radius, drop an interest filter that was never a real requirement, remove an age band nobody could justify — so the same money reaches more people fewer times.
The operating rule: check frequency weekly. When a campaign passes 2.5 within a month, widen the audience or rotate the creative before the cost curve turns. Waiting until cost per applicant rises means paying for the lesson first.
What a normal campaign actually looks like
Half of all campaign-months ran on less than $334. The upper quartile begins at $554 and the top decile at $988.
If you've been told social recruitment advertising requires a large committed budget before it works, this distribution is the counter-evidence.
What's in the full report
Download the 2026 Benchmark Report — free, no form
The web version above covers the headline benchmarks. The full 12-page report adds:
- Campaign structure analysis — why event-driven campaigns produced the lowest median cost of any structure, and what always-on convenience actually costs
- Budget concentration — the top 10% of campaigns produced 57% of all applicants on 22% of the budget, and what that means for what you optimize
- The six-question benchmarking worksheet — about twenty minutes of work against your last quarter, producing a defensible view of whether your job advertising is working
- Full methodology — how campaign-months were counted, what was excluded and why
Download the Report (PDF, 12 pages) →
No form, no email address. Direct download.
How this was measured
What "cost per applicant" means. An applicant is a completed lead form submission — someone who tapped the ad, opened the form and submitted their details. Not a click, not an impression.
Costs are stated as total client cost including campaign management, not raw media spend. That's the number that actually leaves your budget. Cost-per-thousand figures are grossed up on the same basis, so they read higher than raw media benchmarks published elsewhere.
The unit of analysis is a campaign-month — one campaign's delivery within one calendar month. This is a snapshot of the 2026 market, not a trend study; figures are pooled across the period rather than tracked over it.
Rules applied:
- Anonymized throughout. No employer is named, and any segment with fewer than three employers or fifteen campaign-months is suppressed rather than published.
- Traffic campaigns excluded. 169 campaign-months ran with a click objective rather than a lead objective and produced no form submissions by design.
- Medians shown alongside averages everywhere, because these costs are heavily skewed by a few very high-volume, very low-cost roles.
- Roles classified from campaign naming. About a fifth run many titles under one always-on structure and are reported separately in the full report.
Why these figures differ from others on this site. Cost-per-applicant figures published elsewhere on boostpoint.com use campaign-level rather than campaign-month analysis, cover different date ranges, and are usually blended averages rather than medians. Those pages remain accurate on their own terms. Where the two disagree, treat this report as the canonical source — it applies a single consistent methodology across every role and sector shown.
The honest limit of this data
A submitted form is not a screened candidate, an interview, or a hire. We can measure what it costs to get an interested person to raise their hand; we cannot see what happened after your recruiters picked it up.
Any benchmark claiming a cost per hire drawn from ad platform data is extrapolating. Treat these figures as the top of your funnel, not the whole of it.
Benchmark your own program
Run this against your last full quarter. About twenty minutes of work.
- What is your cost per applicant, all-in? Total spend including agency or management fees, divided by completed applications. Compare with the $13.88 median, then with your role's band above.
- What share of clickers complete your form? Form submissions divided by link clicks, per campaign. Under 10% puts you in the bottom two bands — the largest cost driver in this study.
- How much budget sits above a frequency of 3.0? Anything above 3.0 in a month is paying rising prices for a shrinking response. 33% of budget in this study did exactly that.
- Which third of your campaigns is unproductive? Rank campaigns by applicants delivered. Decide explicitly whether each low performer is a strategic requirement or an unreviewed habit.
- Is your campaign structure earning its convenience? One always-on campaign carrying every requisition saves setup time and costs specificity.
- Do you know what an applicant becomes? The one number no ad platform can give you: applicants to screens to interviews to hires, by source. Without it, every efficiency decision is made half-blind.
If you change only one thing
Measure apply rate per campaign, and treat anything under 10% as a defect to investigate rather than a cost to absorb. It explains 70% of the difference between a program running at $6.48 and one running at $29.74 — and unlike the auction, it's almost entirely within your control.
A note on what benchmarks can't tell you
Role difficulty, employer brand recognition, market density and local hiring competition all move cost per applicant, and none of them are visible in a benchmark table. Where your program sits against these figures is a starting point for diagnosis, not a verdict on your team.
Every number in this report describes what happened, not what is possible. The employers in the lowest quartile were not luckier than those in the highest — in most cases they had simply removed friction the others had not yet looked at.
How to cite this report
Boostpoint, 2026 Social Job Advertising Benchmark. https://boostpoint.com/benchmarks/
For media enquiries or additional data cuts, contact press@boostpoint.com.
We're happy to provide additional breakdowns for journalists and analysts covering frontline hiring, recruitment advertising or labor market costs.
Frequently asked questions
What is a good cost per applicant for job advertising?
It depends entirely on the role. Across 891 campaigns in 2026, the median was $13.88, but customer service roles ran $2.71 while licensed therapy roles ran $74.62. A more useful test than any single benchmark is whether you sit inside the middle-50% band for your specific role family — those ranges are published in the role table above.
Why is the average cost per applicant lower than the median?
Because the average is weighted by volume, and volume concentrates in high-throughput frontline roles like caregiver and warehouse that convert at exceptional rates. Those campaigns pull the average to $8.02 while the median campaign sits at $13.88. Use the average for portfolio-level forecasting and the median for individual requisitions.
What is cost per applicant?
Total advertising spend divided by completed applications. In this report an applicant is a completed lead form submission — not a click and not an impression — and costs include campaign management rather than raw media spend alone.
Why do CDL drivers cost more per applicant than caregivers?
Not because reaching drivers is more expensive. Driver campaigns actually buy impressions more cheaply — $17.88 per thousand against $27.88 for caregivers. The difference is apply rate: 8% of drivers who click complete a form, against 31% of caregivers. The cost is created by friction after the click.
What is the biggest driver of job advertising cost?
Application completion rate, by a wide margin. It explains 70% of the variation in cost per applicant between campaigns. Cost per thousand impressions — what the ad auction charges — explains only 18%.
What is a good application completion rate?
Above 20% is strong; under 10% indicates a problem worth investigating. In this study, 41% of all budget ran in campaigns converting under 10%, and those campaigns returned just 11% of all applicants.
How much budget do you need for social recruitment advertising?
Less than most people assume. Half of all campaign-months in this study ran on under $334, with a median of 20 applicants each. The upper quartile begins at $554.
What is ad frequency and why does it matter for recruiting?
Frequency is how many times the average person in your audience saw your ad in a month. Above 3.0, median cost per applicant rises to $18.76; above 4.0 it reaches $26.78, against $7.85 below 1.5. A third of all budget in this study ran above 3.0, making it the clearest pool of recoverable spend in the report.
Can you calculate cost per hire from advertising data?
No, and any benchmark claiming to is extrapolating. Ad platform data can show what it costs to generate an application. What happens after — screening, interviews, offers, hires — lives in your ATS. These figures are the top of your funnel, not the whole of it.
Where does this data come from?
891 distinct social recruitment campaigns run by Boostpoint across healthcare, trucking, skilled trades, senior living and frontline operations, representing 1,334 campaign-months of measured delivery in 2026. All figures are anonymized and aggregated, with any segment representing fewer than three employers or fifteen campaign-months suppressed.
Want your own program benchmarked against this data?
Book a 20-minute call and we'll walk through your cost per applicant, apply rate and frequency against the figures above — for the roles and markets you're hiring in.
Book a Demo