
Digital Recruitment Marketing: Where the Cost Actually Moves
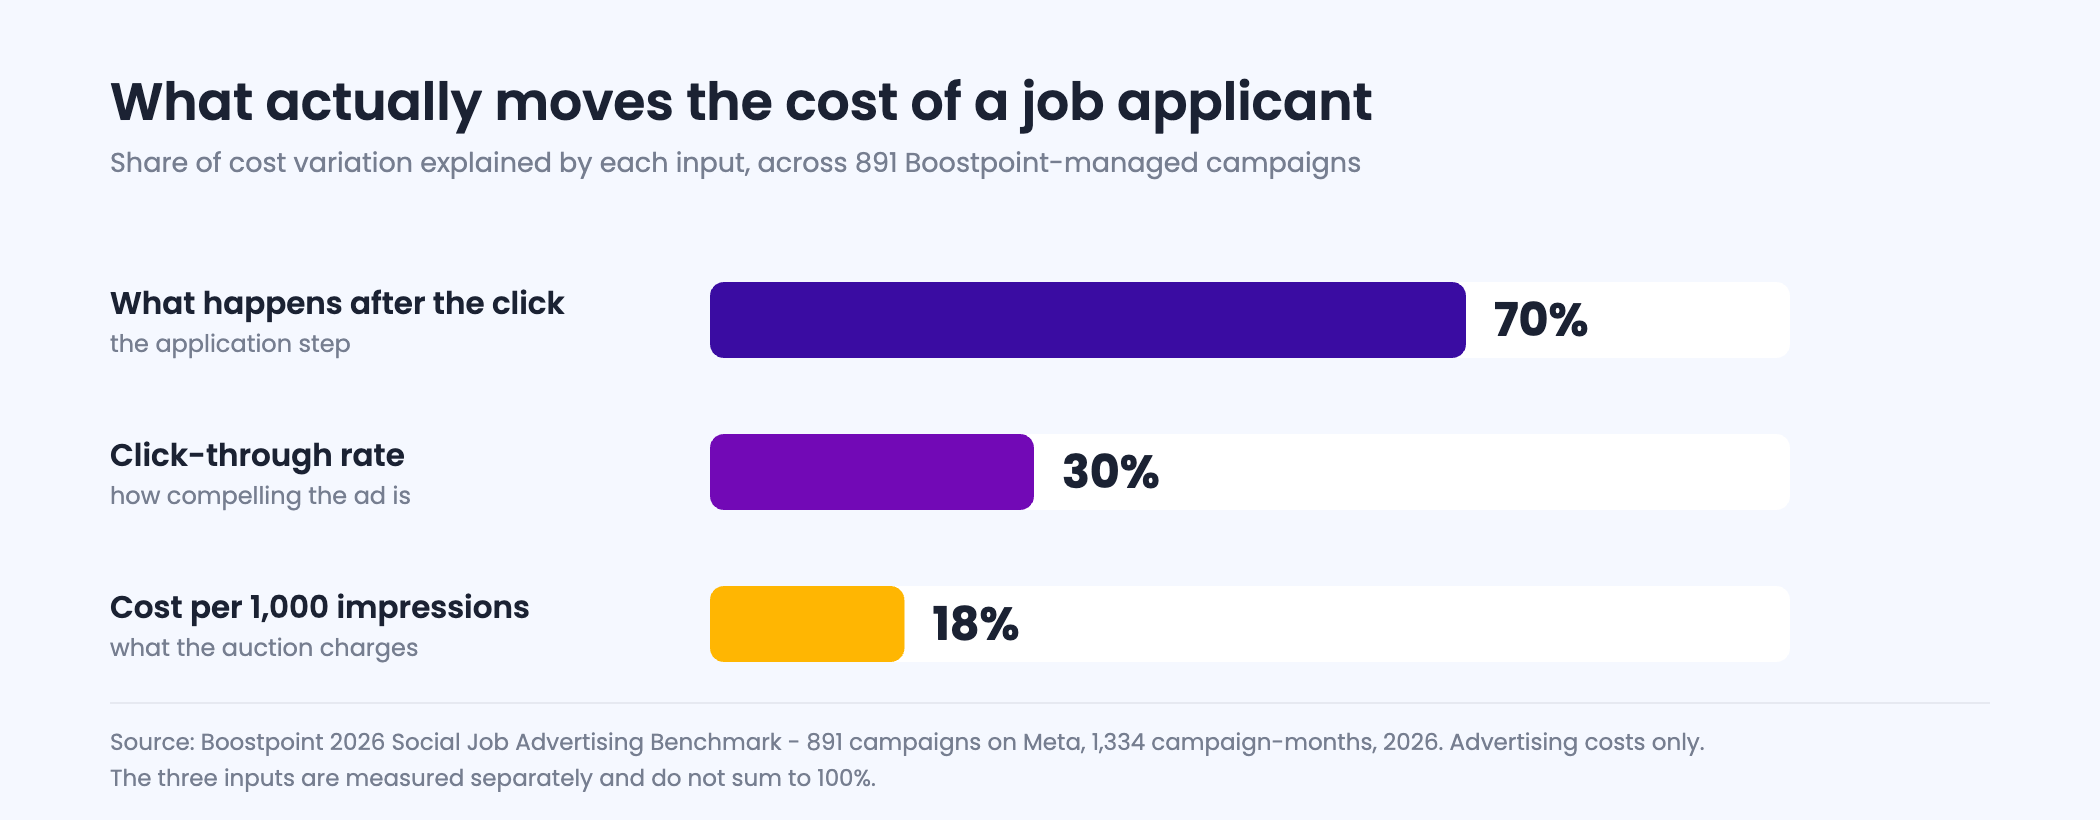
Digital recruitment marketing is the use of paid and owned digital channels — social advertising, search, your careers site, email and text — to get the right people to apply for your open jobs. Most guides treat it as a branding exercise. Measured across 891 Boostpoint-managed campaigns, 70% of the difference in what an applicant costs is explained by what happens after the click, not by the ad that earned it. Click-through explains 30%. What the ad auction charges explains 18%. That ordering is the whole argument of this page: the expensive problem is almost never the advertising.
A note on who's writing this, and what the neighboring pages own
Boostpoint sells digital recruitment marketing, so read the numbers with that in mind. Every campaign figure below is one already published in our 2026 Social Job Advertising Benchmark — 891 campaigns on Meta across 1,334 campaign-months — and is labeled where it appears. No employer is named, because none is named in the benchmark either.
This page is about where the money moves and what can be measured. The definitions live on our recruitment marketing glossary entry. If you are deciding whether to hire a firm to do this, the six kinds of recruitment marketing agency sorts the category, and outsourced recruitment marketing compares the fee models. If you are deciding what to spend, that is the budget page. The channel we actually run is social job advertising.
The channels, and which of them you can honestly measure
Digital recruitment marketing is usually presented as one discipline. It is six, and they do not measure the same way. The distinction that matters to a frontline employer is not paid against organic. It is whether the channel produces a number you can put next to a hiring decision.
- Paid social. Facebook and Instagram, where the audience is built from location, interest and behavior rather than from a search someone typed. Fully measurable to the submitted application: impressions, clicks, form starts, form completions. This is the channel our data covers.
- Paid search and job boards. The candidate is already looking. Measurable to the click, and to the application if the destination is instrumented. Different economics, because you are bidding against everyone else who wants a person already in the market.
- Careers site and job pages. Owned, and the single most common place the funnel leaks. Measurable in principle, rarely measured in practice, because the analytics and the applicant tracking system usually do not talk to each other.
- Email. Cheap, and only as good as the list. Measurable to the click; almost never measured to the hire.
- Text. The highest response rates of anything on this list, and the tightest compliance constraints. Measurable to the reply.
- Organic social and employer brand. The one that gets the most attention and produces the least measurable evidence. We run it and we cannot attribute it, which is a statement about the channel rather than about anyone's execution.
If a plan spends most of its budget on the two channels at the bottom of that list, ask what number it will be judged against before it starts. That question kills more bad recruitment marketing plans than any amount of strategy work.
Where the cost actually moves
Cost per applicant is a product of three things: what the auction charges to show your ad, how many people who see it click, and how many people who click finish the application. In Boostpoint's 2026 Social Job Advertising Benchmark, those three inputs do not carry equal weight, and the gap between them is not close.
| Input | What it is | Share of variation explained |
|---|---|---|
| Applicant conversion rate | What happens after the click — the form, the page, the device, the length | 70% |
| Click-through rate | How compelling the ad is to the audience it reached | 30% |
| Cost per 1,000 impressions | What the auction charges to reach that audience | 18% |
Source: Boostpoint 2026 Social Job Advertising Benchmark — 891 Boostpoint-managed campaigns on Meta (1,334 campaign-months), 2026; advertising costs only. Cost per applicant is not cost per hire, and nothing on this page derives one from the other.
Read that as a work order. The creative brief, the media plan and the audience research all act on the two smaller inputs. The application step — how long the form is, how many fields it asks for, whether it works on a phone in a truck cab at six in the morning — acts on the largest one. Most digital recruitment marketing spends its attention in inverse proportion to where the money is.
The apply-rate ladder is the whole game
Group every campaign-month in the study by the share of people who clicked and then finished the application, and the cost curve is brutal. It is also the single most actionable table we publish, because unlike the auction, the apply rate is something you control.
| Apply rate | Cost per applicant | Share of budget | Share of applicants |
|---|---|---|---|
| Under 5% | $53.77 | 18% | 3% |
| 5–10% | $23.13 | 24% | 8% |
| 10–20% | $11.11 | 32% | 23% |
| 20–35% | $4.41 | 21% | 38% |
| Over 35% | $1.61 | 6% | 28% |
Source: Boostpoint 2026 Social Job Advertising Benchmark — 891 Boostpoint-managed campaigns on Meta (1,334 campaign-months), 2026; advertising costs only. Apply rate is measured on the Boostpoint application form; a careers-site apply rate measures something different and the two are not interchangeable.
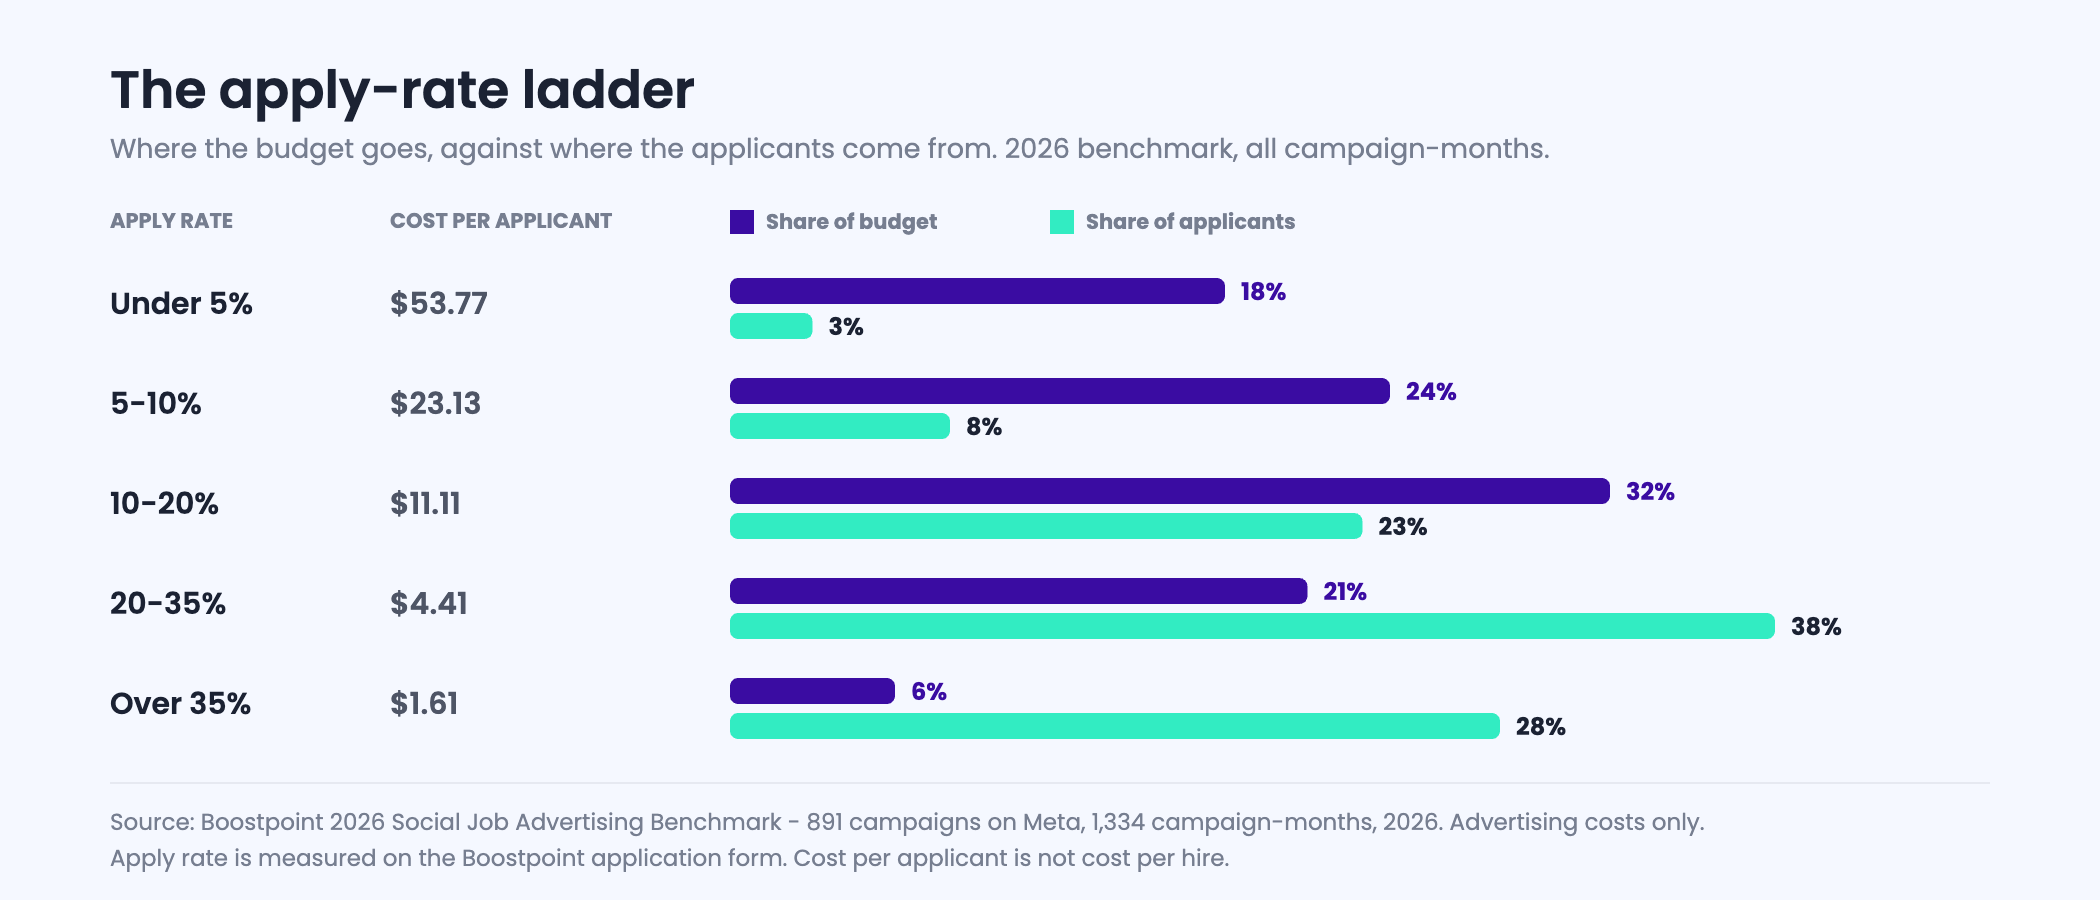
The two ends of that table are worth stating in plain words. Campaigns converting under 5% took 18% of all the money in the study and produced 3% of all the applicants. Campaigns converting above 35% took 6% of the money and produced 28% of the applicants. Per applicant, that is a factor of about 28 between the two ends of the same channel, running the same ads, in the same auction.
Nothing else in digital recruitment marketing has a lever this large. Moving one band up the apply-rate ladder is worth more than any budget increase you are likely to be approved for.
Find the input that is costing you
The diagnostic below takes the three numbers your ad platform already reports and places each one against the published distribution, so you can see which input is furthest from where it should be. It returns a diagnosis and no budget advice.
Interactive
Funnel diagnostic — which of the three inputs is actually costing you
Nothing is stored or sent — this runs in your browser. Enter what your platform reports for a single campaign over a full month. Every comparison is against the published 2026 benchmark distribution.
Cost per applicant here is arithmetic on the three numbers you entered, not a forecast and not a quote: 1,000 divided by your CPM gives impressions per dollar, your click-through gives clicks, your apply rate gives applications. Sector CPM medians are the published 2026 figures. No cost per hire is produced, because cost per applicant is not cost per hire.
Frequency: the recoverable money nobody watches
Frequency is the average number of times each person in your audience saw your ad in a month. It is the most reliable early warning signal in the dataset and almost nobody watches it, because it is not on the front page of any ad platform's dashboard.
| Monthly frequency | Median cost per applicant | Share of budget |
|---|---|---|
| Under 1.5 | $7.85 | 1% |
| 1.5 – 2.0 | $11.48 | 21% |
| 2.0 – 2.5 | $13.39 | 25% |
| 2.5 – 3.0 | $13.65 | 19% |
| 3.0 – 4.0 | $18.76 | 20% |
| Over 4.0 | $26.78 | 13% |
Source: Boostpoint 2026 Social Job Advertising Benchmark — 891 Boostpoint-managed campaigns on Meta (1,334 campaign-months), 2026; advertising costs only.
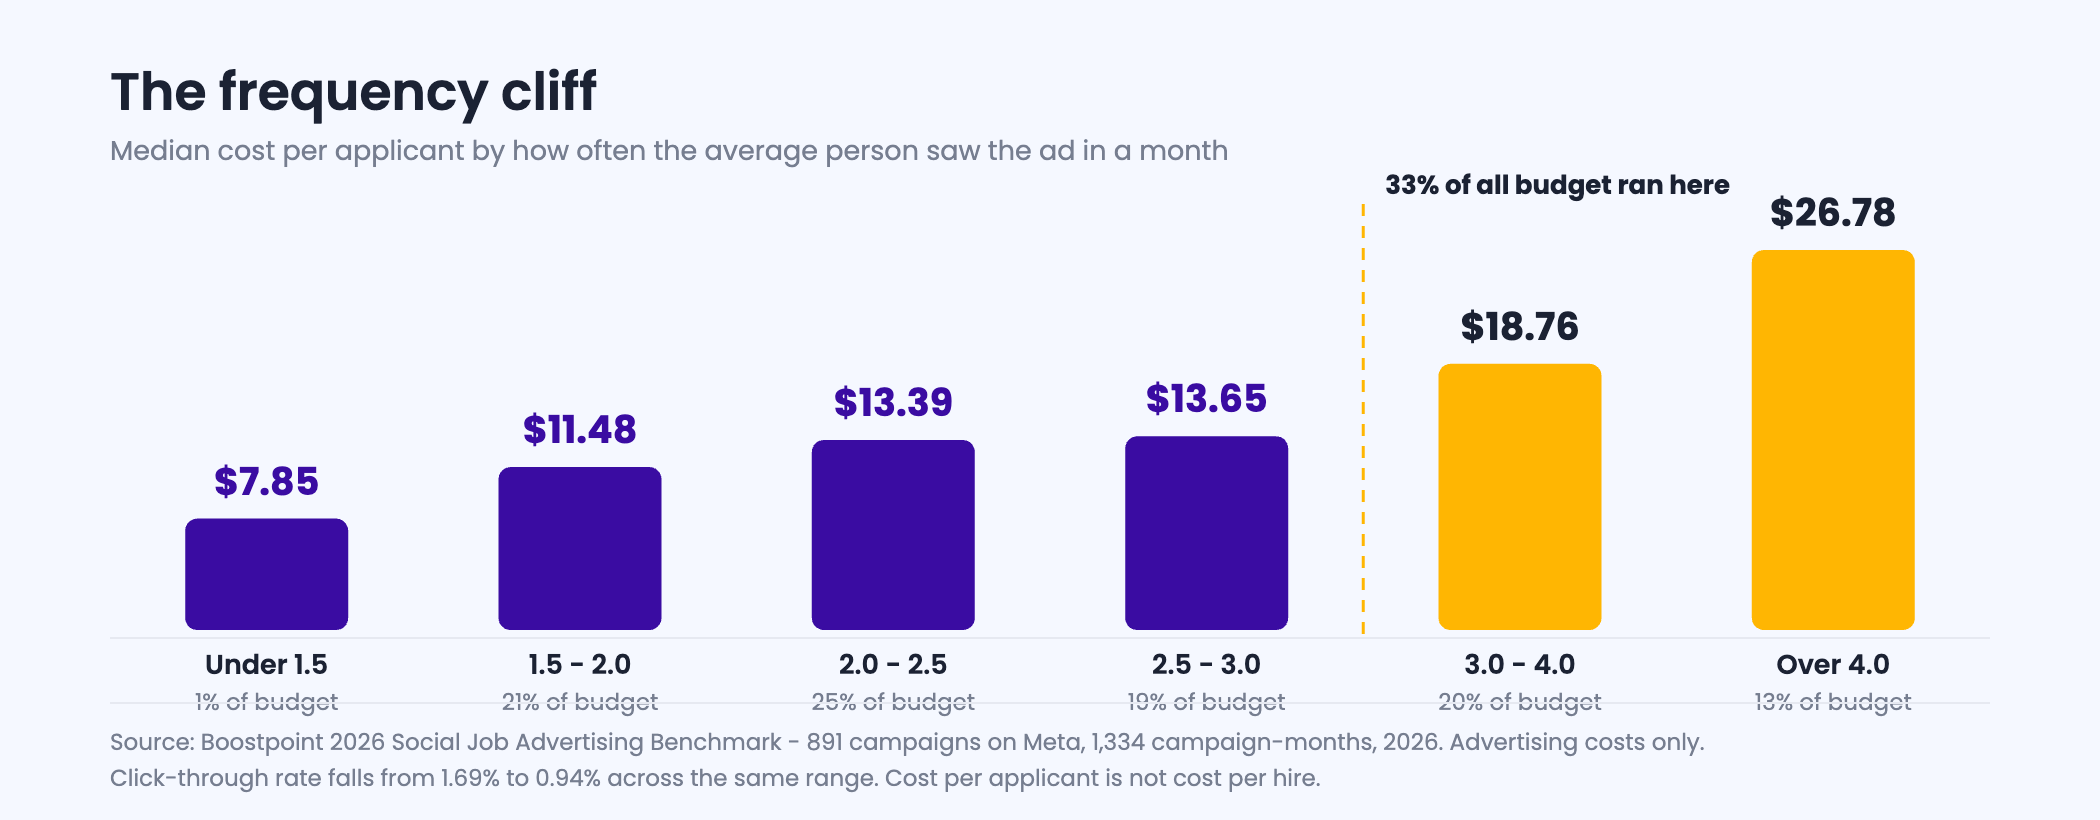
Above a frequency of 4.0 the median campaign paid $26.78 an applicant, exactly twice the $13.39 paid in the 2.0–2.5 band. Click-through fell in step across the same range, from 1.69% to 0.94%. The audience has seen it and stopped responding. 33% of all budget in the study ran above a frequency of 3.0, which makes this the clearest single pool of recoverable money in the report.
High frequency is almost always a budget-to-audience mismatch rather than a creative problem: too much money pointed at too small a pool. The check below does the arithmetic your platform does not put in front of you.
Interactive
Budget-to-audience check — the frequency your plan implies
Nothing is stored or sent. Enter the monthly budget and the audience size your ad platform estimates for the targeting you have set. The result is arithmetic, not a prediction.
Impressions are budget divided by the sector CPM, times a thousand. Frequency is impressions divided by audience size. Both are definitions, not estimates. The sector CPM medians are published 2026 benchmark figures and your own auction will differ; use your platform's reported CPM if you have one. This tool returns a frequency, not a budget recommendation.
What a normal campaign looks like, so the plan is not built on a fantasy
Digital recruitment marketing plans routinely assume a budget nobody at the company has agreed to. Half of all campaign-months in the study ran on less than $334 and returned a median of 20 applicants from 6,061 people reached. The upper quartile begins at $554 and the top decile at $988. The median employer had two campaigns live at a time.
That matters for how you read every other number here. The apply-rate ladder is not a rounding error at these budgets; it is the difference between a role you fill this month and a role you re-advertise next month. At $334 a month, moving from the 5–10% band to the 20–35% band is the difference between roughly fourteen applicants and roughly seventy-five, on the same money.
What this data does not cover, said plainly
Our measurement stops at the submitted application. We can see what it costs to get an interested person to raise their hand. We cannot see whether they were screened, interviewed, offered or hired, which means no cost per hire appears on this page and none can be honestly derived from anything on it.
The dataset is paid social on Meta. It says nothing about what your careers site, your email list, your organic posting or your job-board spend contributes, and we are not going to assert a number for channels we do not measure. Where this page discusses those channels it is describing how they behave, not what they cost.
The benchmark does not split by creative format, so there is no video-against-photo finding here and anyone quoting one is not quoting us. And the apply rates in the table are measured on our own one-minute mobile application form; if your applications land on a careers site or in an applicant tracking system's own portal, your apply rate is measuring a different journey and the bands are a rough guide rather than a comparison.
Frequently asked questions
What is digital recruitment marketing?
It is the use of paid and owned digital channels — social advertising, paid search and job boards, your careers site, email, text and organic social — to get suitable people to apply for your open jobs. It differs from recruiting in that it acts on the top of the funnel: attracting and converting interest rather than screening, interviewing or hiring.
What actually drives the cost of a digital recruitment campaign?
Across 891 Boostpoint-managed campaigns, 70% of the variation in cost per applicant is explained by what happens after the click — whether the person finishes the application. Click-through explains 30% and what the ad auction charges explains 18%. The application step is the largest lever and the one most plans pay least attention to.
What is a good apply rate?
In the 2026 benchmark, campaign-months converting above 35% of clicks into applications paid a median of $1.61 an applicant; those converting under 5% paid $53.77. Anything above 20% is working. Below 10% the form or the landing experience is usually the problem rather than the advertising, and that is where the money goes.
How much should I budget for digital recruitment marketing?
Half of all campaign-months in the benchmark ran on less than $334, with a median of 20 applicants each; the upper quartile begins at $554 and the top decile at $988. Budget is a smaller lever than conversion at these levels, so the honest answer is to fix the apply rate before increasing the spend.
What is ad frequency and why does it matter?
Frequency is how many times the average person in your audience saw your ad in a month. Above 4.0 the median campaign paid $26.78 an applicant against $13.39 in the 2.0 to 2.5 band, and click-through fell from 1.69% to 0.94% across the range. It is usually a sign that too much budget is pointed at too small an audience.
Is digital recruitment marketing different from employer branding?
Yes, and the difference is measurement. Digital recruitment marketing runs against an open role and produces applications you can count. Employer branding runs against a reputation and produces effects nobody in this industry, ourselves included, can attribute to a hire with any confidence.
Can you calculate a cost per hire from this?
No, and any benchmark claiming to is extrapolating. Advertising data stops at the submitted application. What happened between that application and a start date lives in your applicant tracking system, and it is the single most valuable thing most employers could begin measuring this year.
Does this data cover channels other than paid social?
It does not. The benchmark is 891 Boostpoint-managed campaigns on Meta. It contains no measurement of careers-site performance, email, organic social or job-board spend, so no figure on this page should be read as applying to those channels.
Point the effort at the 70%
We build and run the campaigns, put the application on a one-minute mobile form, follow up by text, and report what each applicant cost. If you already know which role is costing you the most, that is the fastest place to start the conversation.
All campaign figures: Boostpoint 2026 Social Job Advertising Benchmark — 891 Boostpoint-managed campaigns on Meta across 1,334 campaign-months in 2026, advertising costs only, published August 12 2026 and read September 2 2026. Share of cost variation explained: applicant conversion rate 70%, click-through rate 30%, cost per 1,000 impressions 18%. Apply-rate bands, cost per applicant, share of budget and share of applicants: under 5% $53.77, 18%, 3%; 5–10% $23.13, 24%, 8%; 10–20% $11.11, 32%, 23%; 20–35% $4.41, 21%, 38%; over 35% $1.61, 6%, 28%. Frequency bands and median cost per applicant: under 1.5 $7.85; 1.5–2.0 $11.48; 2.0–2.5 $13.39; 2.5–3.0 $13.65; 3.0–4.0 $18.76; over 4.0 $26.78, with 33% of all budget above 3.0 and click-through falling from 1.69% to 0.94%. Sector median cost per 1,000 impressions: retail and corporate $14.74; skilled trades and field service $15.96; transportation and logistics $14.82; healthcare and senior living $25.18; behavioral and education $29.04. Normal campaign: $334 median monthly budget, 20 median applicants, 6,061 median people reached, upper quartile $554 and top decile $988. Cost per applicant is not cost per hire, and no cost per hire is derived from it anywhere on this page. The dataset covers paid social on Meta only; careers-site, email, organic social and job-board figures are not measured and none are asserted. The benchmark does not split by creative format, so no creative-format performance claim appears here. Apply rate is measured on Boostpoint's own application form. Channel descriptions are our working patterns rather than measured values and are labeled as such. Last updated September 2026.