
Recruitment Marketing Budget: What to Spend, Built From 891 Campaigns Instead of a Rule of Thumb
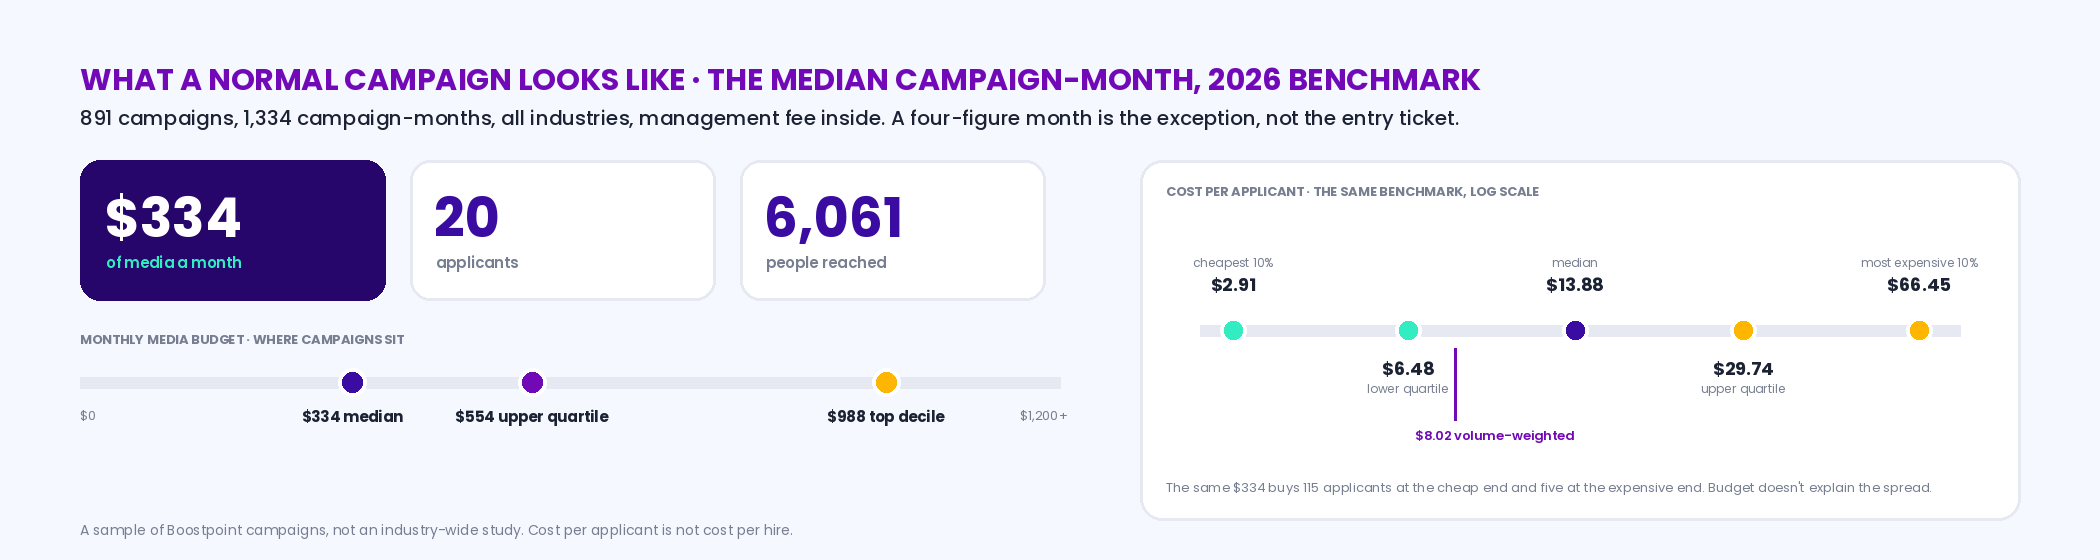
The honest answer to "how much should I spend on recruitment advertising" is a distribution, not a number. In Boostpoint's 2026 Social Job Advertising Benchmark a normal campaign ran on a median $334 a month — the upper quartile was $554 and the top decile $988 — and produced 20 applicants while reaching 6,061 people. Budget size explained less than people assume: click-to-application conversion explained 70% of the variation in cost per applicant, and 41% of all budget ran in campaigns converting under 10%, returning 11% of applicants. So build the budget from the hires you need, your own applicants-per-hire ratio, and the published cost band for the role — and fix the form before raising the spend. Cost per applicant is not cost per hire; this page never computes one from ad data.
Source: Boostpoint 2026 Social Job Advertising Benchmark — 891 Boostpoint-managed campaigns on Meta (1,334 campaign-months), 2026; costs are what advertisers paid for advertising only.
A note on who's writing this
Boostpoint sells recruitment advertising, so a page about how much to spend on it is written by someone who benefits when you spend. The rules we've held to: every figure is from the published 2026 benchmark — 891 campaigns, 1,334 campaign-months — with the expensive end shown as clearly as the cheap one; the budget arithmetic uses your ratio, not ours; the "budget per hire" question is answered with a third-party figure and your ATS, because we don't track hires and won't invent a cost per hire from ad spend; and the page says plainly when not to spend. Where a job board's published price is a useful floor, it's quoted from the board's own page with the date.
The case for a bigger budget, made first
There are campaigns in the benchmark running on $988 a month and more, and they're not mistakes. Budget buys volume when the funnel is already working: a warehouse campaign converting at 25% doesn't get cheaper per applicant by spending less, it gets fewer applicants. Volume also buys the thing a small budget can't — enough applicants in a month to fill a shift pattern, staff an opening date, or feed a screening ratio that runs 10-to-1 for a credentialed role. And a bigger budget across more locations is how the fixed cost of a campaign gets spread, which is the multi-unit argument on the franchise page. The case for spending more is real whenever the applicants you're getting are the right ones and there aren't enough of them. The case against it is everything below: most budgets aren't limited by size, they're limited by what happens after the click.
What a normal campaign actually looks like
Before any rule of thumb, the shape of the thing. Across 1,334 campaign-months, the median campaign ran on $334 of media a month, the upper quartile on $554, and the top 10% on $988 or more. That median campaign produced 20 applicants and reached 6,061 people. Cost per applicant across every campaign ran a median of $13.88, with a volume-weighted average of $8.02 because volume concentrates in a few high-throughput, low-cost frontline roles; the cheapest tenth of campaigns came in under $2.91 per applicant and the most expensive tenth above $66.45. Two things follow. First, a four-figure monthly budget is the exception, not the entry ticket; most employers we work with are running one to a few campaigns in the $334-to-$554 range each. Second, the spread between $2.91 and $66.45 is not explained by budget — the same $334 buys 115 applicants at the cheap end and five at the expensive end — and what explains it is the next section.
Budget buys impressions; conversion buys applicants
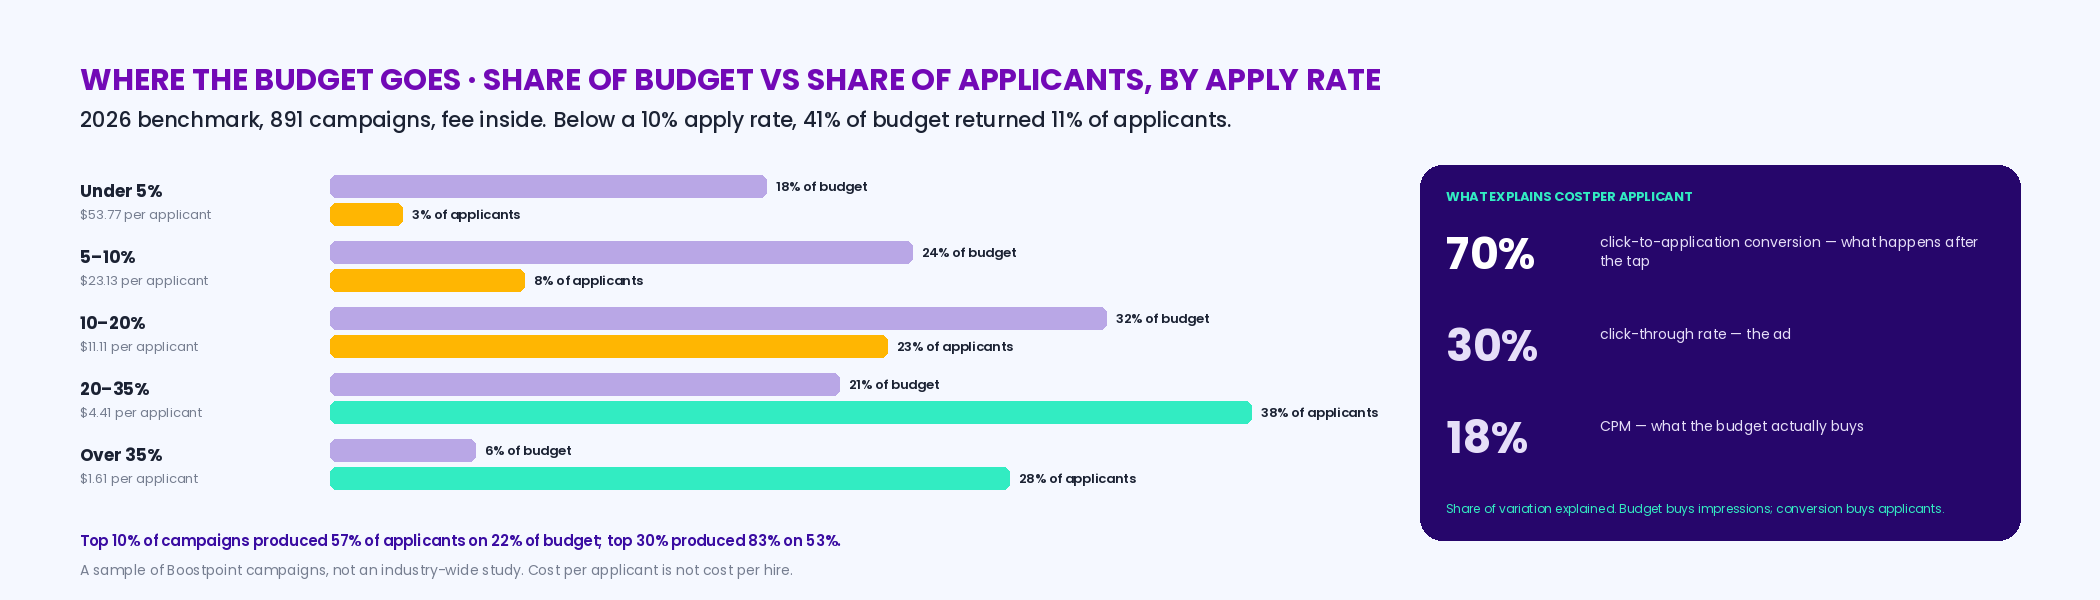
When we decomposed what drives cost per applicant across the benchmark, the click-to-application conversion rate — what happens after someone taps the ad — explained 70% of the variation. Click-through rate explained 30%, and the price the auction charges per thousand impressions, the thing budget actually buys, explained 18%. The same finding shows up as money: 41% of all budget in the benchmark ran in campaigns converting under 10%, and those campaigns returned 11% of all applicants. Campaigns converting under 5% cost a median $53.77 per applicant; over 35%, $1.61. And it shows up as concentration: the top 10% of campaigns produced 57% of all applicants on 22% of the budget, the top 30% produced 83% on 53%. Read those three ways and the budget question changes shape. A $1,000 campaign with a twelve-field portal behind it is a $1,000 campaign that will produce what a $200 campaign with a three-question form produces, and no budget increase fixes that; the form does. The anatomy of the ad and the form is on the job ad page, and the table below is the budget version of the same data.
| Click-to-application rate | Median cost per applicant | Share of all budget | Share of all applicants | What $1,000 of media returns at the median |
|---|---|---|---|---|
| Under 5% | $53.77 | 18% | 3% | 18.6 applicants |
| 5% to 10% | $23.13 | 24% | 8% | 43.2 applicants |
| 10% to 20% | $11.11 | 32% | 23% | 90.0 applicants |
| 20% to 35% | $4.41 | 21% | 38% | 226.8 applicants |
| Over 35% | $1.61 | 6% | 28% | 621.1 applicants |
Source: Boostpoint 2026 Social Job Advertising Benchmark — 891 Boostpoint-managed campaigns on Meta (1,334 campaign-months), 2026; costs are what advertisers paid for advertising only.
Build the budget from the hires, not from last year's line
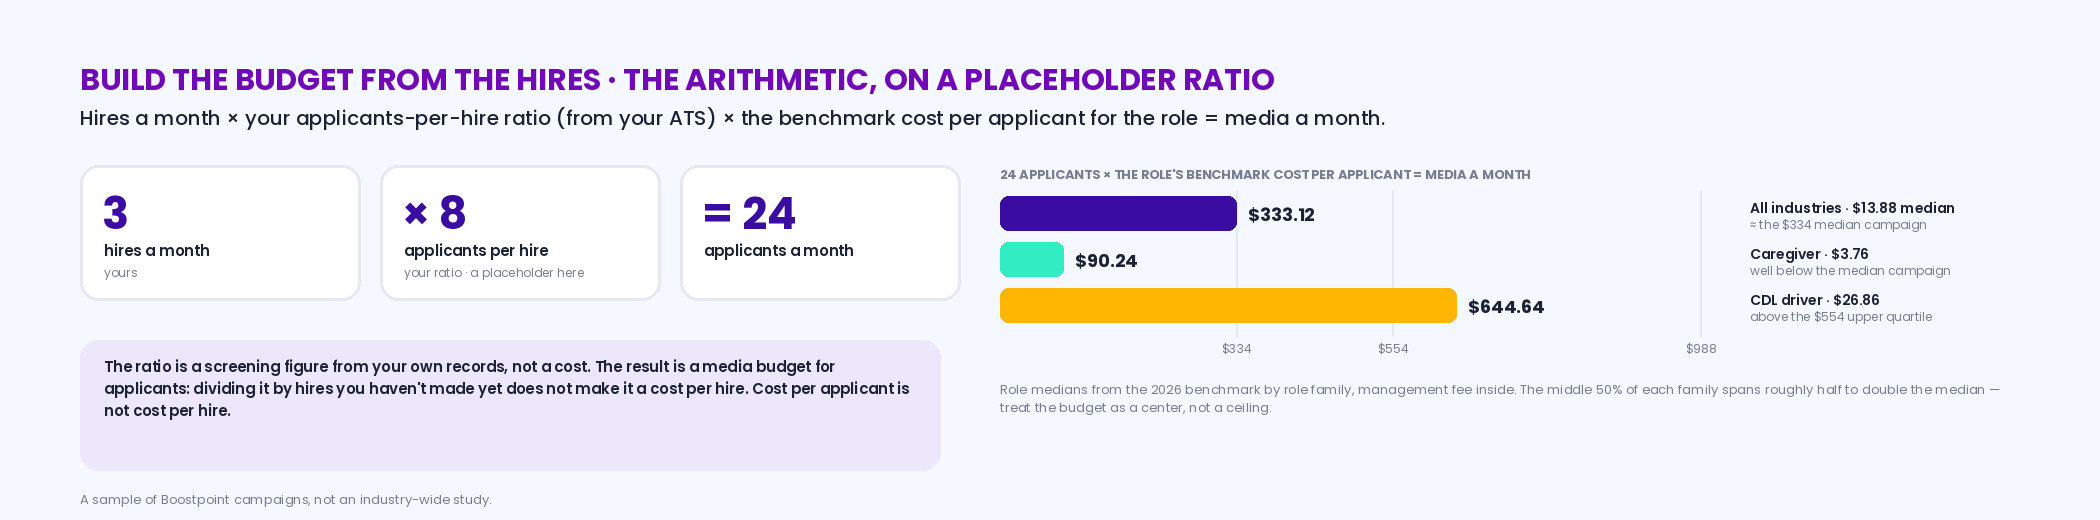
The budget that survives a finance conversation is one built backwards from hires. Three inputs, and only one of them is ours. Hires you need a month — yours. Applicants it takes to make one hire — yours, from your ATS: applications received divided by hires made, for that role, over the last few months. It is a screening ratio, not a cost, and it's the number that turns applicants into a budget; we don't publish one because ours would be a guess about your process. Cost per applicant for the role — the benchmark's, by role family: customer service $2.71, caregiver $3.76, CNA $7.72, warehouse and production $9.83, LPN $12.77, technician $13.41, skilled trades $14.14, registered nurse $19.08, CDL driver $26.86, all-industry median $13.88. Multiply through and you have a media budget a month, which you can then place on the $334 / $554 / $988 scale to see whether you're asking for a normal campaign or an unusual one. Three hires a month at a ratio of eight applicants per hire is 24 applicants; at the all-industry median that's $333.12 of media, almost exactly the normal campaign; for a caregiver role it's $90.24; for a CDL driver it's $644.64 and sits above the upper quartile, which is what a credentialed role in a searching-pool shortage looks like. The ratio is the reader's and the result is a media budget for applicants — cost per applicant is not cost per hire, and dividing this budget by hires you haven't made yet doesn't make it one.
Interactive
Budget builder — hires a month, your applicants-per-hire ratio, and the role's benchmark band; get applicants needed, a media budget a month, and where it sits on the $334 / $554 / $988 scale
Nothing is stored or sent — this runs in your browser. The ratio is yours (applications ÷ hires from your ATS); the cost per applicant is the benchmark's median for the role family. An estimate for planning, not a quote.
hires × your ratio
applicants × benchmark cost per applicant
against $334 / $554 / $988
$334 ÷ this role's cost per applicant
If you use Boostpoint, the same arithmetic sets the ad budget, with one floor added. The ad budget is set per job category (one campaign, such as CNAs or Class A company drivers), Boostpoint recommends a minimum of $750 a month in ad spend per job category, and the Boostpoint subscription is separate, priced on job volume. A goal of 60 CDL driver applicants at the $26.86 benchmark median is $1,611.60 a month; a goal that multiplies out below $750 runs at the floor. The worked examples are on the Boostpoint pricing page.
Budget is the second question. The first is which of the three cost inputs is losing you money, and the published shares are not close: conversion after the click explains 70% of the variation, click-through 30% and the auction 18%. Our page on digital recruitment marketing takes each of the three apart with a diagnostic you can run on your own campaign.
Where the budget leaks: the form, then frequency
Two leaks account for most of the money that doesn't come back as applicants. The first is the form, above: below a 10% apply rate the same budget buys a fifth of the applicants it would at 25%. The second is frequency — how many times the same person has seen the ad in a month. Campaigns under a frequency of 1.5 ran a median $7.85 per applicant; 3.0 to 4.0, $18.76; over 4.0, $26.78; and 33% of all budget ran above 3.0. Frequency is the leak that raising the budget makes worse, because a bigger budget in a fixed radius buys the same people again, which is why the operating rule is to check it weekly and act when a campaign passes 2.5, and why a small-town location should cap its spend at what its radius can absorb (the frequency watch on the franchise page estimates that cap). The leak finder below does the form arithmetic on your budget: enter what you spend and the apply rate your ad account or ATS shows, and see what the same money returns at each band.
Interactive
Budget leak finder — your monthly media and your apply rate; see what the same budget returns at every benchmark band, and how much of it the form is costing you
Nothing is stored or sent — this runs in your browser. Band medians are the 2026 benchmark's; your row is highlighted. A planning estimate, not a forecast.
"Recruiting budget per hire" — the number we don't publish, and where yours comes from
The phrase people search for is budget per hire, and it's a fair thing to want. The honest position is that no advertising platform can give it to you, because ad data ends at the application: we see applications, not starts, and a cost per hire built from ad spend divided by an assumed hire ratio is an assumption dressed as a measurement. Two real sources exist. The first is a third-party average: SHRM put the average cost per hire at "nearly $4,700" in April 2022 — an all-in figure across industries and every recruiting cost, not an advertising figure, and not a target. The second is your own ATS, which is the only place a real cost per hire lives: recruitment marketing spend, tagged by source, divided by hires tagged to that source. Build it there, for each channel, and the budget question becomes a comparison — what a board's clicks cost per hire on your records against what a social campaign's applicants cost per hire on the same records — which is the arithmetic the job board ROI page is built to do and the analytics page explains how to tag. What the glossary means by the term is on the cost-per-hire page. What this page can give you is the applicant side of that division; cost per applicant is not cost per hire, and we say it twice on purpose.
The published floors, for comparison
A recruitment marketing budget usually has more than one line, and the boards publish some of theirs. Indeed's Sponsored Jobs "start at $5 per day or $150 per month" on its pricing page as of August 26, 2026 — the daily budget bills per click to view, the monthly per click to apply — and Monster's Standard plan is $8 a day pay-per-click on its page the same day; ZipRecruiter publishes no price. Those are floors, and a floor tells you what the cheapest month costs, not what an applicant costs, because the board's apply rate is the number it doesn't publish — the click translator on the job board ROI page turns a per-click price into a per-applicant one at whatever rate you observe. Our own line is a product subscription plus ad spend — the subscription priced on job volume and quoted on a call, the ad spend recommended at a minimum of $750 a month per job category, one bill through Boostpoint — and every Boostpoint cost-per-applicant figure on this page is what advertisers paid for advertising only. The outsourcing version of the budget — agency retainers, RPO per-hire fees, per-applicant pricing — is on the services page and the RPO cost page.
Budget is one of five decisions, and the other four decide what the budget buys. If you want the shapes rather than the number — what a dated event, a single role and an always-on pipeline each look like end to end — our recruitment campaign examples page sets out six of them with the published median each structure ran at.
When not to spend
Three cases where the right budget is smaller than you think or zero. If the apply rate is under 10%, don't raise the budget; fix the form and the first line first, because at $23.13 or $53.77 per applicant every added dollar is mostly waste, and the leak finder above shows exactly how much. If the role is salaried and title-searched — an accountant, an engineer — a free indexed listing and a board reach the people who are looking, and a social budget reaches the employed majority who aren't, which is the wrong pool for a role people search for. And if nobody will call the applicants back the same day, the budget buys a list of people who will be hired by someone else; spend it on the manager's time first. The role-by-role cost pages say where your role sits — caregivers, skilled trades, CDL drivers — and the benchmark has the rest.
Recruiting budget template and worked example
The sections above argue for building the budget from the hires rather than from last year's line. This is that argument as a spreadsheet: quarters across, lines down, and three formulas that do the only arithmetic worth automating.
Download the template
An Excel workbook with thirteen budget lines split into external and internal spend, four quarter columns, live totals, each line as a share of the whole, the budget per planned hire, and the advertising share of the program. No email required, and no figures pre-filled.
Worked through, for a frontline employer planning 60 hires across a year. Start with the hires, not the total: 60 hires at an applicants-per-hire ratio of 22 is 1,320 applicants to buy. At the $13.88 median cost per applicant in our 2026 benchmark that is $18,322 of advertising for the year — and the point of the exercise is what that figure looks like next to everything else in the budget.
| Line | Year | Share | How it was sized |
|---|---|---|---|
| Social recruitment advertising | $18,322 | 19% | 1,320 applicants at the $13.88 median |
| Job board postings and sponsored spend | $9,000 | 9% | Last year's invoices, held flat |
| Niche and industry board listings | $2,400 | 3% | Four listings a year at $600 |
| Agency and search fees | $14,000 | 15% | Two hard roles at a 20% fee on $35,000 |
| Referral bonuses | $6,000 | 6% | 12 referral hires at $500 |
| Events, screening, brand and creative | $8,000 | 8% | Career fairs, background checks, photography |
| External subtotal | $57,722 | 60% | |
| Recruiter and coordinator compensation | $26,000 | 27% | 0.4 of a full-time role at a loaded rate |
| Applicant tracking system and tools | $4,800 | 5% | Annual license |
| Onboarding and compliance administration | $3,600 | 4% | 60 hires at one hour of admin |
| Contingency | $4,000 | 4% | About 4% of the program |
| Internal subtotal | $38,400 | 40% | |
| Total recruiting budget | $96,122 | 100% | |
| Budget per planned hire | $1,602 | $96,122 ÷ 60 hires |
Three things this lays bare that a line-item-plus-inflation budget hides. Advertising is 19% of the program, so halving it saves less than most cost-cutting conversations assume. Recruiter time is the largest single line at 27%, and it is the one nobody budgets deliberately. And the budget per planned hire — $1,602 here — is a planning figure, not a cost per hire: it is what you intend to spend divided by the hires you intend to make, before anybody has actually started.
If headcount planning rather than money is the problem, the hiring plan template handles that side; this sheet assumes the headcount number is already settled.
Frequently asked questions
How much should I spend on recruitment advertising?
Build it from hires, not from a rule of thumb: hires you need a month × your applicants-per-hire ratio (from your ATS) × the benchmark cost per applicant for the role. Three hires at eight applicants each is 24 applicants; at the all-industry median $13.88 that's about $333 of media a month, which is almost exactly the normal campaign in our 2026 benchmark — a median $334, upper quartile $554, top decile $988, producing 20 applicants and reaching 6,061 people. Credentialed roles run higher (CDL drivers $26.86 per applicant), high-conversion roles lower (caregivers $3.76). Cost per applicant is not cost per hire.
What is a typical recruitment marketing budget?
For a single campaign in our benchmark, a median $334 of media a month; a quarter of campaigns ran above $554 and a tenth above $988. Employers running several roles or locations multiply that by campaigns. Whether the spend is typical matters less than whether it's converting: 41% of all budget in the benchmark ran in campaigns converting under 10% and returned 11% of applicants.
What is a good recruiting budget per hire?
No advertising platform can honestly tell you, because ad data ends at the application. SHRM's third-party average cost per hire was "nearly $4,700" (April 2022), an all-in figure across every recruiting cost and industry. Your real number is in your ATS: spend tagged by source ÷ hires tagged to that source, per channel. This page gives you the applicant side — a media budget built from your ratio and the benchmark's cost per applicant — and cost per applicant is not cost per hire.
Does a bigger budget get more applicants?
Only when the funnel already converts. Budget buys impressions; conversion turns them into applicants, and in our benchmark click-to-application conversion explained 70% of cost variation, click-through 30%, and CPM — what budget actually buys — 18%. At a 5% to 10% apply rate, $1,000 returns about 43 applicants at the band median; at 20% to 35%, about 227. Raising the budget in a fixed radius also raises frequency, and over a frequency of 4.0 the median cost was $26.78 against $7.85 under 1.5.
How should a recruitment marketing budget be split between job boards and social?
By the pool each reaches and what each costs per applicant on your records. Boards reach people who search — the BLS counted 23.45 employed people per unemployed one in July 2026, and the searching pool is the second group — at a per-click price (Indeed's Sponsored Jobs "start at $5 per day or $150 per month"; Monster's Standard $8 a day, both August 26, 2026) that becomes a per-applicant price only at your observed apply rate. Social reaches the employed majority at a per-applicant cost the benchmark publishes by role. Run both, tag the source, and let the ATS decide the split next quarter.
What should I cut first if the budget has to shrink?
The campaigns with the worst apply rate and the highest frequency, which are usually the same ones. Campaigns converting under 5% cost a median $53.77 per applicant against $1.61 over 35%; campaigns over a frequency of 4.0 cost $26.78 against $7.85 under 1.5. Cutting those and fixing their forms usually returns more applicants for less money than trimming everything evenly, because the top 10% of campaigns produced 57% of all applicants on 22% of the budget.
What do these numbers include?
Every Boostpoint figure on this page — $13.88, $8.02, the role medians, the $334 campaign — is what advertisers paid for advertising. Boostpoint itself is priced as a product subscription plus ad spend: the subscription is priced on job volume and discussed on the demo rather than printed here; the ad spend is recommended at a minimum of $750 a month per job category, and the worked examples are on the pricing page. When you compare a vendor's cost per applicant to ours, ask whether theirs is media only, like ours, or has a management fee folded in, because the two are not comparable.
How often should the budget be reviewed?
Weekly, per campaign, on three numbers: frequency (act at 2.5), apply rate (the band it's in), and cost per applicant. Monthly is too slow for frequency, which can cross the cliff in two weeks in a small radius. The annual budget conversation is then a roll-up of what those weekly reads showed, built from hires needed and your own ratio rather than last year's line plus inflation.
Is there a recruiting budget template?
Yes — the Excel workbook linked above. It has thirteen budget lines split into external and internal spend, four quarter columns, live totals, every line as a share of the whole budget, the budget per planned hire, and the share of the program going to advertising. Nothing is pre-filled and no email is required. Start with planned hires in row 6; the rest is sized against that number.
What is a hiring budget template?
A hiring budget template plans the money; a hiring plan template plans the headcount. The budget version lists the lines you will spend on to fill roles — advertising, boards, agency fees, referrals, screening, recruiter time, tools, onboarding, contingency — against the quarters you will spend them in. Keep it separate from the headcount plan, because the two are approved by different people and revised on different cycles.
How do you build a talent acquisition budget?
Start with the hires, not last year's total. Take planned hires by quarter, multiply by your own applicants-per-hire ratio to get the applicants you need to buy, and price those at a cost per applicant you can evidence. Then add the lines that do not scale with volume: recruiter compensation, the applicant tracking system, onboarding administration, and a contingency. Divide the total by planned hires and sanity-check the result before anyone else does.
How much should I spend on job ads?
Set the budget per job category (one campaign, such as CNAs or Class A company drivers) from the applicants you need. Boostpoint recommends a minimum of $750 a month in ad spend per job category, sized upward from your applicant goal multiplied by Boostpoint's historical cost per applicant for the role; the Boostpoint subscription is separate. For example, 60 CDL driver applicants at the $26.86 benchmark median is $1,611.60 a month, while 40 CNA applicants at $7.72 falls below the floor, so that campaign runs at $750.
Build the budget on your numbers
Bring the hires you need and your ATS's applicants-per-hire ratio. We'll place each role on the published band, show you the campaigns closest to yours from the benchmark, and give you a media budget — and tell you if the form should be fixed before a dollar is spent.
Book a DemoBoostpoint figures come from the 2026 Social Job Advertising Benchmark — 891 campaigns and 1,334 campaign-months across 15 role families, segments with fewer than 3 employers or 15 campaign-months suppressed: a normal campaign $334 of media a month (upper quartile $554, top decile $988), 20 applicants, 6,061 reached; median $13.88 per applicant, $8.02 volume-weighted, percentiles $2.91, $6.48, $29.74 and $66.45; conversion explaining 70% of cost variation, click-through 30%, CPM 18%; apply-rate bands under 5% $53.77 (18% of budget, 3% of applicants), 5–10% $23.13 (24%, 8%), 10–20% $11.11 (32%, 23%), 20–35% $4.41 (21%, 38%), over 35% $1.61 (6%, 28%), 41% of budget under 10% returning 11% of applicants; top 10% of campaigns 57% of applicants on 22% of budget, top 30% 83% on 53%; frequency under 1.5 $7.85, 3.0–4.0 $18.76, over 4.0 $26.78, 33% of budget above 3.0; role medians customer service $2.71, caregiver $3.76, CNA $7.72, warehouse $9.83, LPN $12.77, technician $13.41, skilled trades $14.14, registered nurse $19.08, CDL driver $26.86. Boostpoint is priced as a product subscription plus ad spend: the subscription is priced on job volume and quoted on a call, ad spend is separate and recommended at a minimum of $750 a month per job category, there is one bill, through Boostpoint, and the cost-per-applicant figures on this page are advertising costs only. SHRM, average cost per hire "nearly $4,700", April 11, 2022 — a third-party all-in figure, not an advertising figure. Indeed and Monster prices from their pricing pages, August 26, 2026. BLS Employment Situation, July 2026. The budget builder and leak finder compute on the reader's inputs; the applicants-per-hire ratio is the reader's. Cost per applicant is not cost per hire; we do not track hires and publish no cost-per-hire figure. A sample of Boostpoint campaigns, not an industry-wide study.