
Job Board ROI: What Postings Actually Return, Computed on Your Own Records
A job board's own dashboard tells you clicks and spend. Return needs four more numbers only you have: applicants, interviews, hires, and what a filled seat is worth to you. Put those together and job board ROI is arithmetic — cost per click, click-to-apply rate, cost per applicant, your cost per hire on that board, and the return against the seat's value. The number that moves everything is the apply rate: the same click becomes a $5 applicant or a $40 applicant depending on the form behind it. Below: the framework, two calculators, and what a board can and can't reach.
A note on who's writing this
Boostpoint sells a channel that competes with job boards for some hires, so read what follows with that in mind. We have tried to make it useful regardless of what you buy: the framework works on any board's numbers, the board prices quoted are from the vendors' own pages with the date, and no cost per hire on this page is ours. That last point matters. Our data measures advertising and has no hire attribution, so we publish no cost per hire and won't compute one; your ATS has the attribution we lack, which is exactly why the cost-per-hire figure on this page is yours, from your records, and why we can hand you the arithmetic without pretending to have the answer. The whole-program version of the same question — the return on the recruiting function rather than on one board — is worked on the recruiting ROI calculator.
Are job boards worth it? The honest answer is "for which hire"
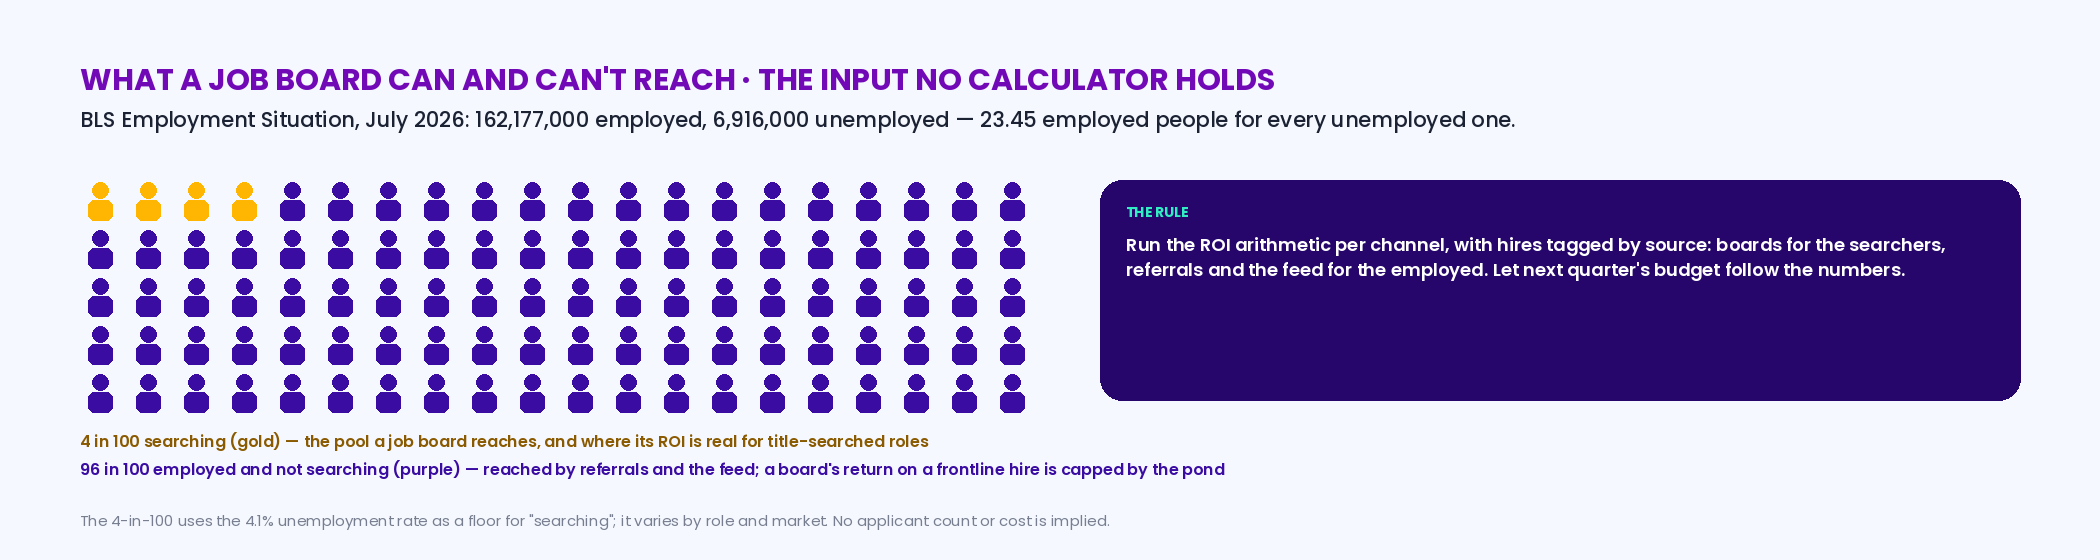
A job board sells access to the people who are searching. That is a real service for the roles people search for by title — salaried, professional, office — and for the few in any role who are between jobs this week. It is a thin service for hourly and frontline roles, because most of the people you want are employed and not looking: in July 2026 the BLS counted 162,177,000 employed Americans and 6,916,000 unemployed, 162,177 ÷ 6,916 = 23.45 employed for every unemployed one (Employment Situation, released August 7, 2026). So "are job boards worth it" is really two questions: does this board reach the pool this hire is in, and what does each applicant from it cost once your own form and follow-up are counted. The first is a matter of the role; the second is the framework below. The active-versus-passive frame that decides the first question is on passive candidate recruiting.
The four numbers a board can't give you
Every board reports what it sells: impressions, clicks, and what you paid, and some report applications started through their own apply flow. None can report the four things that turn spend into a return, because they happen on your side of the click. Applicants — completed applications in your system, not clicks to your careers page. Interviews — the applicants your process actually engaged. Hires — the ones who started, tagged by the board they came from, which your ATS can do if you make it. And the value of a filled seat, which is not a recruiting number at all: the overtime premium you stop paying, the agency markup you avoid, the line that reopens or the route that runs. The framework is five divisions and one subtraction, and it is only as good as those four inputs, which is why the first job is to get your ATS tagging source and your managers logging interviews.
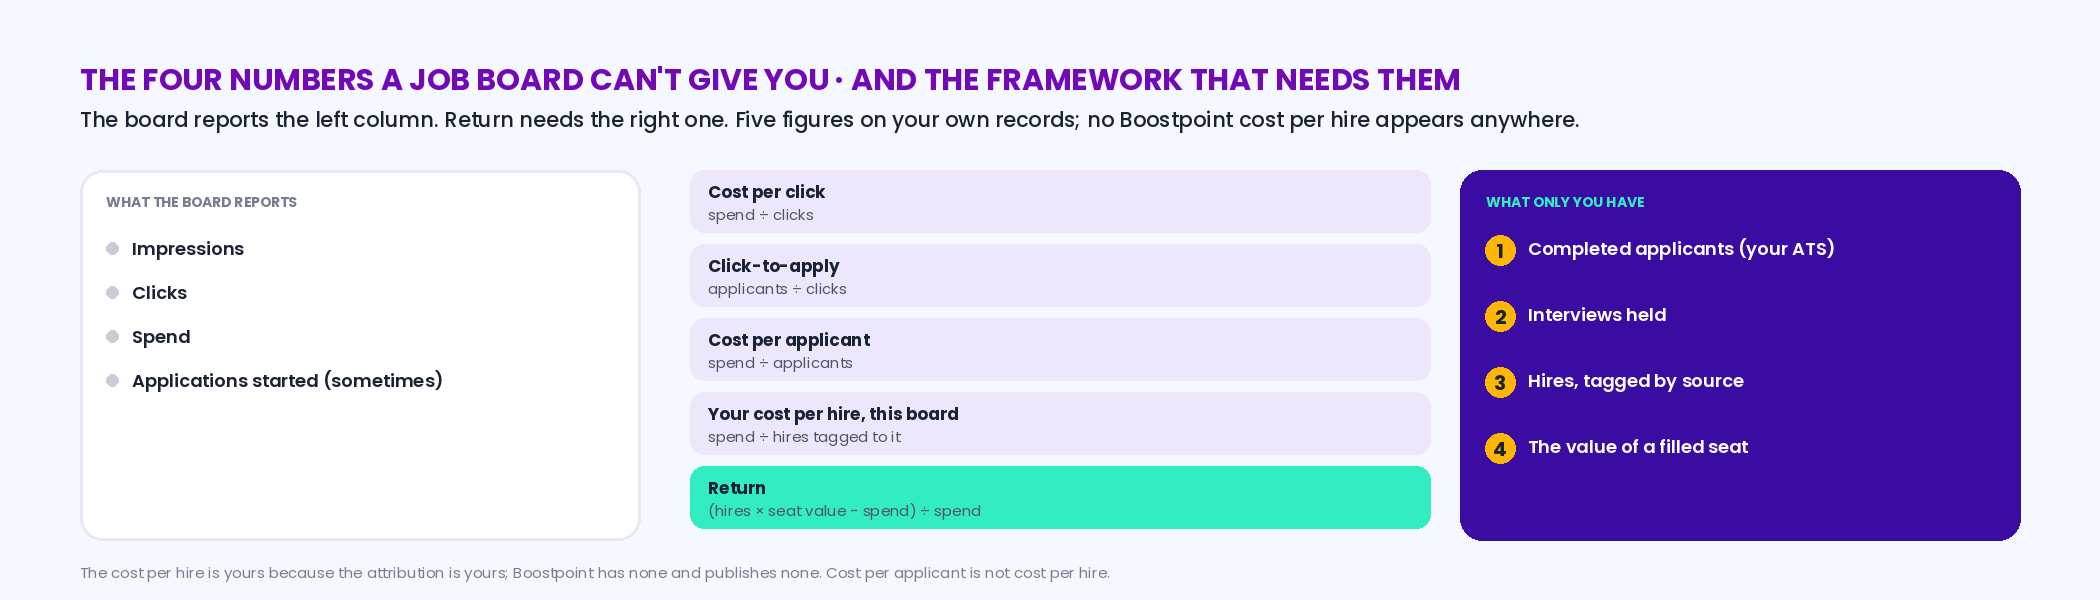
| Figure | Arithmetic | Where the input lives | Illustrative month |
|---|---|---|---|
| Cost per click | Spend ÷ clicks | The board's dashboard | $600 ÷ 380 = $1.58 |
| Click-to-apply rate | Applicants ÷ clicks | Your ATS (completed applications), the board (clicks) | 34 ÷ 380 = 8.9% |
| Cost per applicant | Spend ÷ applicants | Your ATS | $600 ÷ 34 = $17.65 |
| Cost per hire on this board | Spend ÷ hires from this board | Your ATS, with source tagged — the attribution ad data doesn't have | $600 ÷ 2 = $300.00 |
| Return | (Hires × seat value − spend) ÷ spend | Your operations: overtime avoided, agency markup avoided, output restored | (2 × $2,400 − $600) ÷ $600 = 700% |
Interactive
Job board ROI calculator — your spend, clicks, applicants, interviews, hires and seat value, in; the five figures, out
Nothing is stored or sent — this runs in your browser. Every input is yours; the cost per hire it produces is your board's, from your records, not a Boostpoint figure.
What decides the result: the same click, five apply rates
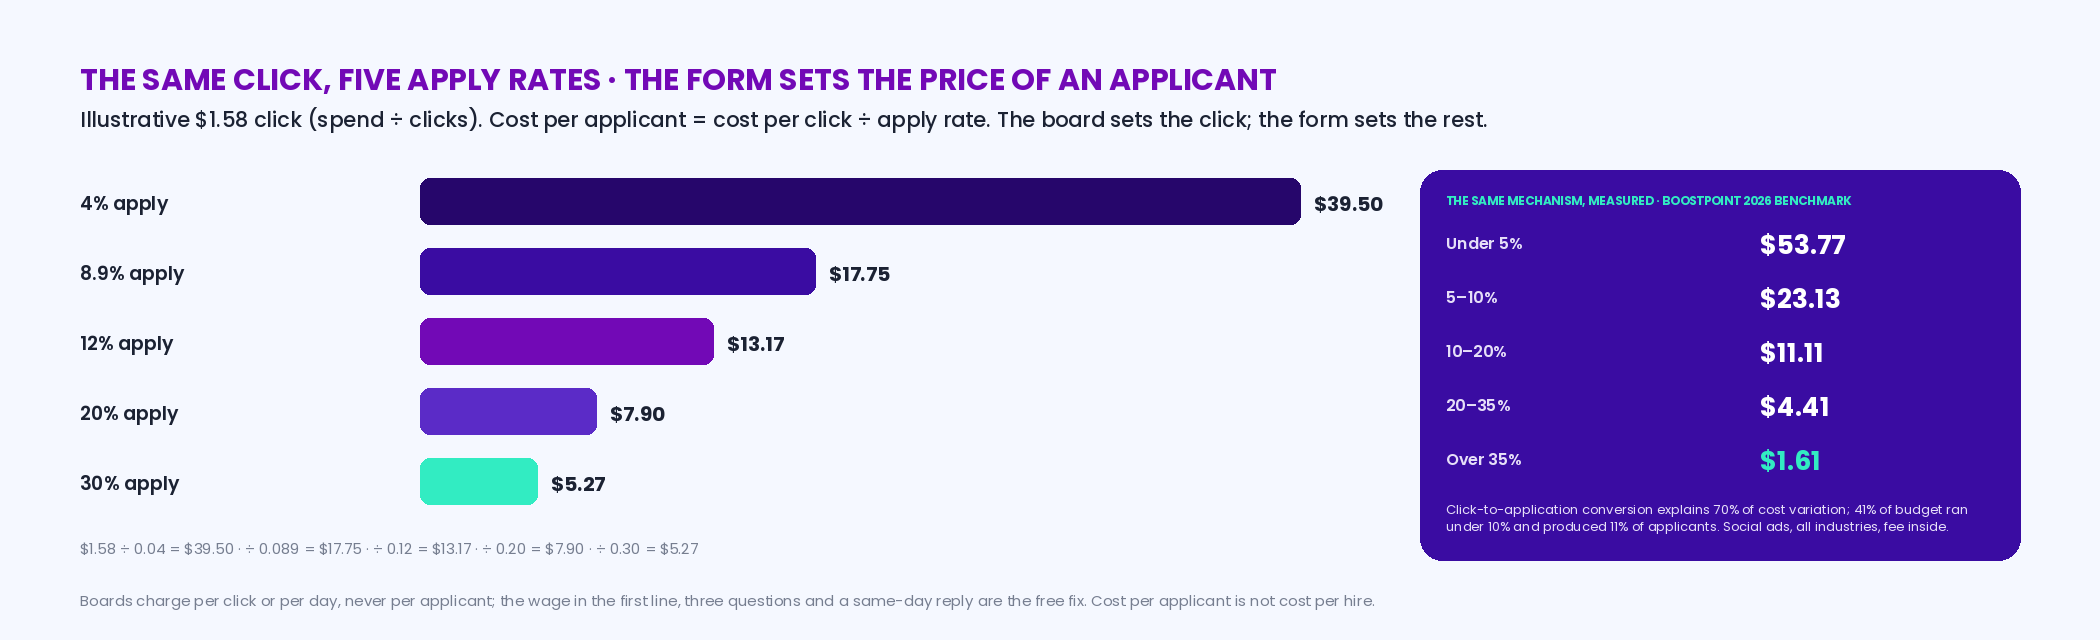
Two employers can pay the same board the same cost per click and get applicants at prices five times apart, and the difference is almost never the board. It is the form. Our own benchmark, 891 campaigns, shows it for social ads and the mechanism is identical for a board click: click-to-application conversion explains 70% of cost-per-applicant variation; campaigns converting under 5% of clicks paid a median $53.77 per applicant, 5–10% paid $23.13, 10–20% paid $11.11, 20–35% paid $4.41, and over 35% paid $1.61; and 41% of all budget ran in campaigns converting under 10%, producing 11% of applicants. A twelve-field portal, a hidden wage and a slow reply cost the same on Indeed as on the feed. Which is why the second calculator takes your board's cost per click and shows what an applicant costs at each apply rate, and why the cheapest job-board fix on this page is free: the wage in the first line, three questions, and a call the same day (what makes a good job ad).
Interactive
Click translator — your board's cost per click, your apply rate, and what an applicant costs at every rate you could reach
Nothing is stored or sent — this runs in your browser. Cost per click comes from your board's dashboard; the apply rate from your ATS. The benchmark bands shown are Boostpoint's for social ads, as a reference for the mechanism.
Job board cost per hire: yours, SHRM's, and the one we don't publish
Three different numbers hide under that phrase. The first is yours: spend on a board divided by the hires your ATS tags to it, which is a real figure because you have the attribution, and the calculator above produces it. The second is a survey average: SHRM put the average cost per hire at "nearly $4,700" in its April 2022 research, a figure that bundles internal and external recruiting costs across every channel and role, useful as context for what employers report and useless as a target for one posting. The third is a cost per hire computed from a channel's advertising data by assuming a hire rate — the one that shows up on comparison sites as "$X per hire on Indeed" — and we don't publish one for our own channel or anyone else's, because an assumed ratio dressed as a measurement is how buyers get misled. If a vendor shows you a cost per hire, ask whether they tracked the hires or assumed them.
What the boards publish, and what that buys
Only two of the three biggest boards publish a price, and even those publish a price per click or per day, not a price per applicant. Indeed posts many jobs free "subject to Indeed's terms, conditions, quality standards, and usage limits" and starts Sponsored Jobs at "$5 per day or $150 per month," charging daily budgets per click to view and monthly budgets per click to apply (indeed.com/hire/pricing, August 26, 2026). Monster's Standard plan is pay-per-click from $8 a day and its Pro plan $299 a month (hiring.monster.com/pricing, August 26, 2026). ZipRecruiter's pricing page shows a free trial and no prices (August 26, 2026). None of those figures is a cost per applicant, because the applicant is on your side of the click; the translator above is how a per-click price becomes one. The channels themselves are graded on Indeed alternatives, Monster alternatives and ZipRecruiter alternatives.
| Board | What it charges for | Published price | To get cost per applicant |
|---|---|---|---|
| Indeed | Free posts subject to terms; Sponsored Jobs per click to view (daily budgets) or per click to apply (monthly budgets) | Published: "start at $5 per day or $150 per month," varying by role, title and location (Indeed) | Spend ÷ completed applicants in your ATS; monthly budgets bill per click-to-apply, which is closer but still not a completed application |
| Monster | Per click on Standard; credits on Pro | Published: Standard from $8/day; Pro $299/month or $2,990/year (Monster) | Spend ÷ completed applicants; no per-click rate is published |
| ZipRecruiter | Subscription after a free trial | Not published: no prices on the pricing page (ZipRecruiter) | Quote ÷ applicants the trial produced — the trial is the price discovery |
| Social feed advertising (Boostpoint) | A product subscription plus ad spend ($750 a month minimum per job category) | Published as cost per applicant: $13.88 median campaign, $8.02 volume-weighted, 891 campaigns (Boostpoint 2026 benchmark) | Already per applicant; the hire is still yours to attribute |
What a board can and can't reach
The last input to any ROI is the one a calculator can't hold: whether the pool this board reaches is the pool your hire is in. A board reaches the searching minority; for a title-searched salaried role that is most of the candidates, and a board's ROI will usually be good. For an hourly or frontline role the searching minority is a small share of the people you want, and a board's return is capped by the size of that pond no matter how good your form is. That is the case for running the arithmetic per channel, not per budget: the boards for the searchers, referrals and the feed for the employed, each with its own cost per applicant and its own hires tagged, so the next quarter's budget follows the numbers. Reading a funnel that way is on recruiting analytics; what the feed costs, with the fee inside, is on the benchmark — a normal campaign ran on a median $334 a month for 20 applicants.
What job boards charge in 2026
The table above lists what three named boards publish. Underneath the brand names there are only five pricing models in the market, and knowing which one you are on tells you more about your cost than knowing whose logo is on the invoice. Here they are, with the price ranges that are actually published somewhere.
| Model | What you are charged for | Published range | What it is good and bad at |
|---|---|---|---|
| Free listing | Nothing. Organic placement in search results, subject to the board's terms and usage limits. | $0 | Good for testing whether a role gets any organic pull at all. Bad for anything urgent: visibility is not guaranteed and decays quickly. |
| Sponsored, cost per click | Each click on the posting. You set a daily or monthly budget; the board sets the rate by auction. | Practitioner-reported $0.10 to $5 or more per click; a recruitment-advertising median of $0.85 per click was reported for 2023, down from $1.07 in 2022. Boards publish budget minimums, not rates: from $5 a day, with a $25-a-day per-posting minimum introduced in July 2025. | Good when the posting converts: you pay for traffic and keep the upside. Bad when it does not, because the board is paid whether or not anyone applies. |
| Pay per application | Each delivered application, at a fixed price agreed in advance. | Commonly quoted at $15 to $50 per application, with $25 a typical working figure. | Good for budgeting: the unit is the thing you want. Bad on quality control — an "application" is whatever the contract defines it as, and that definition is the whole negotiation. |
| Slot or seat subscription | A period of access, with a cap on concurrent postings or on contacts. | $50 a month or $400 a year on smaller platforms; $120 to $300 a month for sourcing plans; $299 a month or $2,990 a year on one of the large boards. | Good at volume, where the fixed cost divides over many roles. Bad at low volume, where an unused slot is a standing charge. |
| Flat fee per listing | One price for a fixed run — thirty or sixty days. | About $200 for 30 days and $400 for 60 on general boards; $200 to $600 a listing on niche and industry boards; $10 to $75 per posting on US classifieds. | Good on niche boards where the audience is the product. Bad as a default, because you are buying time rather than traffic and time is not the scarce thing. |
Two things fall out of that table. The first is that only one of the five models — pay per application — charges you for the thing you actually want, and it is the least common. The other four charge for time, access or traffic, and convert into a cost per applicant only after your own apply rate has had its say. That conversion is the arithmetic in the calculator above, and it is why the same $2 click is a $5 applicant on one posting and a $40 applicant on another.
The second is that a published price range tells you almost nothing about what you will pay. Every board that charges per click prices by auction, which means the number is set by how many other employers want the same person in the same place this week. That is also true of social feed advertising, which is why we publish a distribution rather than a price: across 891 campaigns in 2026 the median cost per applicant was $13.88 and the middle half ran from $6.48 to $29.74.
Frequently asked questions
How do you calculate job board ROI?
Five figures on your own records: cost per click (spend ÷ clicks, from the board), click-to-apply rate (completed applicants ÷ clicks), cost per applicant (spend ÷ applicants), your cost per hire on that board (spend ÷ hires tagged to it in your ATS), and return — (hires × the value of a filled seat − spend) ÷ spend, where the seat's value is your operational number: overtime or agency cost avoided, output restored. The calculator on this page runs it; the inputs a board can't give you are the last four.
Are job boards worth it?
For the hires that live in the pool boards reach — title-searched salaried roles, and the few between jobs in any role — usually yes, and the arithmetic will show it. For hourly and frontline roles the searching pool is a small share of the people you want (the BLS counted 23.45 employed people per unemployed one in July 2026), so a board's return is capped by the pond's size. Run the numbers per channel and let the next budget follow them.
What is the cost per hire on a job board?
Yours is spend on the board divided by the hires your ATS tags to it — a real number because you have the attribution. SHRM's survey average, "nearly $4,700" (April 2022), bundles every channel and cost and is context, not a target. Any "cost per hire on [board]" figure built from a channel's ad data by assuming a hire rate is an assumption, and Boostpoint publishes none — for our channel or any board.
Why do the same job board clicks cost so much more per applicant for some employers?
The form and the follow-up. In our benchmark, click-to-application conversion explains 70% of cost-per-applicant variation: under 5% conversion paid a median $53.77 per applicant, over 35% paid $1.61. The mechanism is identical for a board click — the same $1.58 click is a $39.50 applicant at a 4% apply rate and a $5.27 applicant at 30%. The wage in the first line, three questions and a same-day reply are the fix, and they are free.
How much do job boards cost?
As published on the vendors' own sites (August 26, 2026): Indeed posts many jobs free subject to its terms and starts Sponsored Jobs at $5 a day or $150 a month, charged per click; Monster's Standard plan is pay-per-click from $8 a day and Pro is $299 a month; ZipRecruiter publishes no prices and offers a free trial. None of those is a price per applicant, which depends on your apply rate.
What should the value of a filled seat be?
Whatever the empty seat costs you, from your own operations: the overtime premium paid to cover it, the agency markup on a temp, the shifts uncovered or the route that doesn't run, the line that stays down. It is not a recruiting statistic and no vendor can supply it. Pick the number you would defend to your CFO and use it consistently across channels.
How do you compare a job board to social recruiting ads?
On cost per applicant and on hires tagged by source, per channel. Boards publish a price per click or per day; Boostpoint publishes a cost per applicant ($13.88 median, $8.02 volume-weighted) — so convert the board's numbers to per applicant with your apply rate before comparing, and let your ATS tag the hires. Then compare the pools: boards reach the searching, the feed reaches the employed, and most hires need one more than the other.
Does Boostpoint publish a job board cost per hire?
No, and not one for our own channel either. We measure advertising and have no hire attribution; a cost per hire computed from ad data is an assumed ratio. The cost-per-hire figure on this page is the one you compute from your own ATS, where the attribution lives.
How much does it cost to post a job?
It depends entirely on the pricing model. A free listing costs nothing and guarantees nothing. A flat-fee listing runs about $200 for 30 days on a general board, $200 to $600 on a niche board, and $10 to $75 on US classifieds. Sponsored postings charge per click, with practitioner-reported rates from $0.10 to $5 and budget minimums from $5 a day. Pay-per-application deals are commonly quoted at $15 to $50 per application.
What is job board pricing?
Five models, in practice. Free listings; sponsored cost-per-click, where you set a budget and an auction sets the rate; pay per application, where you agree a price per delivered application; slot or seat subscriptions, where you buy a period of access with a cap on concurrent postings; and flat fees for a fixed run, usually 30 or 60 days. Only pay per application charges for the outcome you want; the other four charge for time, access or traffic.
What are the cheapest job posting sites?
Cheapest by list price is a free listing, and cheapest per applicant is usually not the same thing. A free posting that produces two applicants costs more per applicant than a $200 listing that produces sixty. Judge the model, not the sticker: for a role with genuine organic pull, free and flat-fee listings are hard to beat; for a role nobody is searching for, only a model that buys traffic will move it, and then the apply rate decides the cost.
Run the same arithmetic on the feed
We'll show you what your roles cost per applicant in our benchmark,, deliver applicants into your ATS with the source tagged, and let your own records decide the return — next to the boards, not instead of them.
Book a DemoBoostpoint figures come from the 2026 Social Job Advertising Benchmark — 891 campaigns and 1,334 campaign-months: $13.88 median cost per applicant, $8.02 volume-weighted average; a normal campaign $334 a month, 20 applicants, 6,061 reached; apply-rate bands under 5% $53.77 (18% of budget, 3% of applicants), 5–10% $23.13 (24%, 8%), 10–20% $11.11 (32%, 23%), 20–35% $4.41 (21%, 38%), over 35% $1.61 (6%, 28%), conversion explaining 70% of cost variation, 41% of budget under 10% producing 11% of applicants. Vendor prices were read on each vendor's own site on August 26, 2026 and are the vendors' figures, subject to change. SHRM, "The Real Costs of Recruitment" (April 11, 2022), "nearly $4,700." BLS Employment Situation, July 2026 (released August 7, 2026). The calculators compute on the reader's own records; the cost per hire they produce is the reader's, from the reader's hire attribution. Boostpoint has no hire attribution and publishes no cost-per-hire figure for any channel; cost per applicant is not cost per hire. A sample of Boostpoint campaigns, not an industry-wide study.