
Employer guideUpdated September 2026
Recruiting ROI Calculator: Formula, Benchmark and Recruiting Cost Ratio
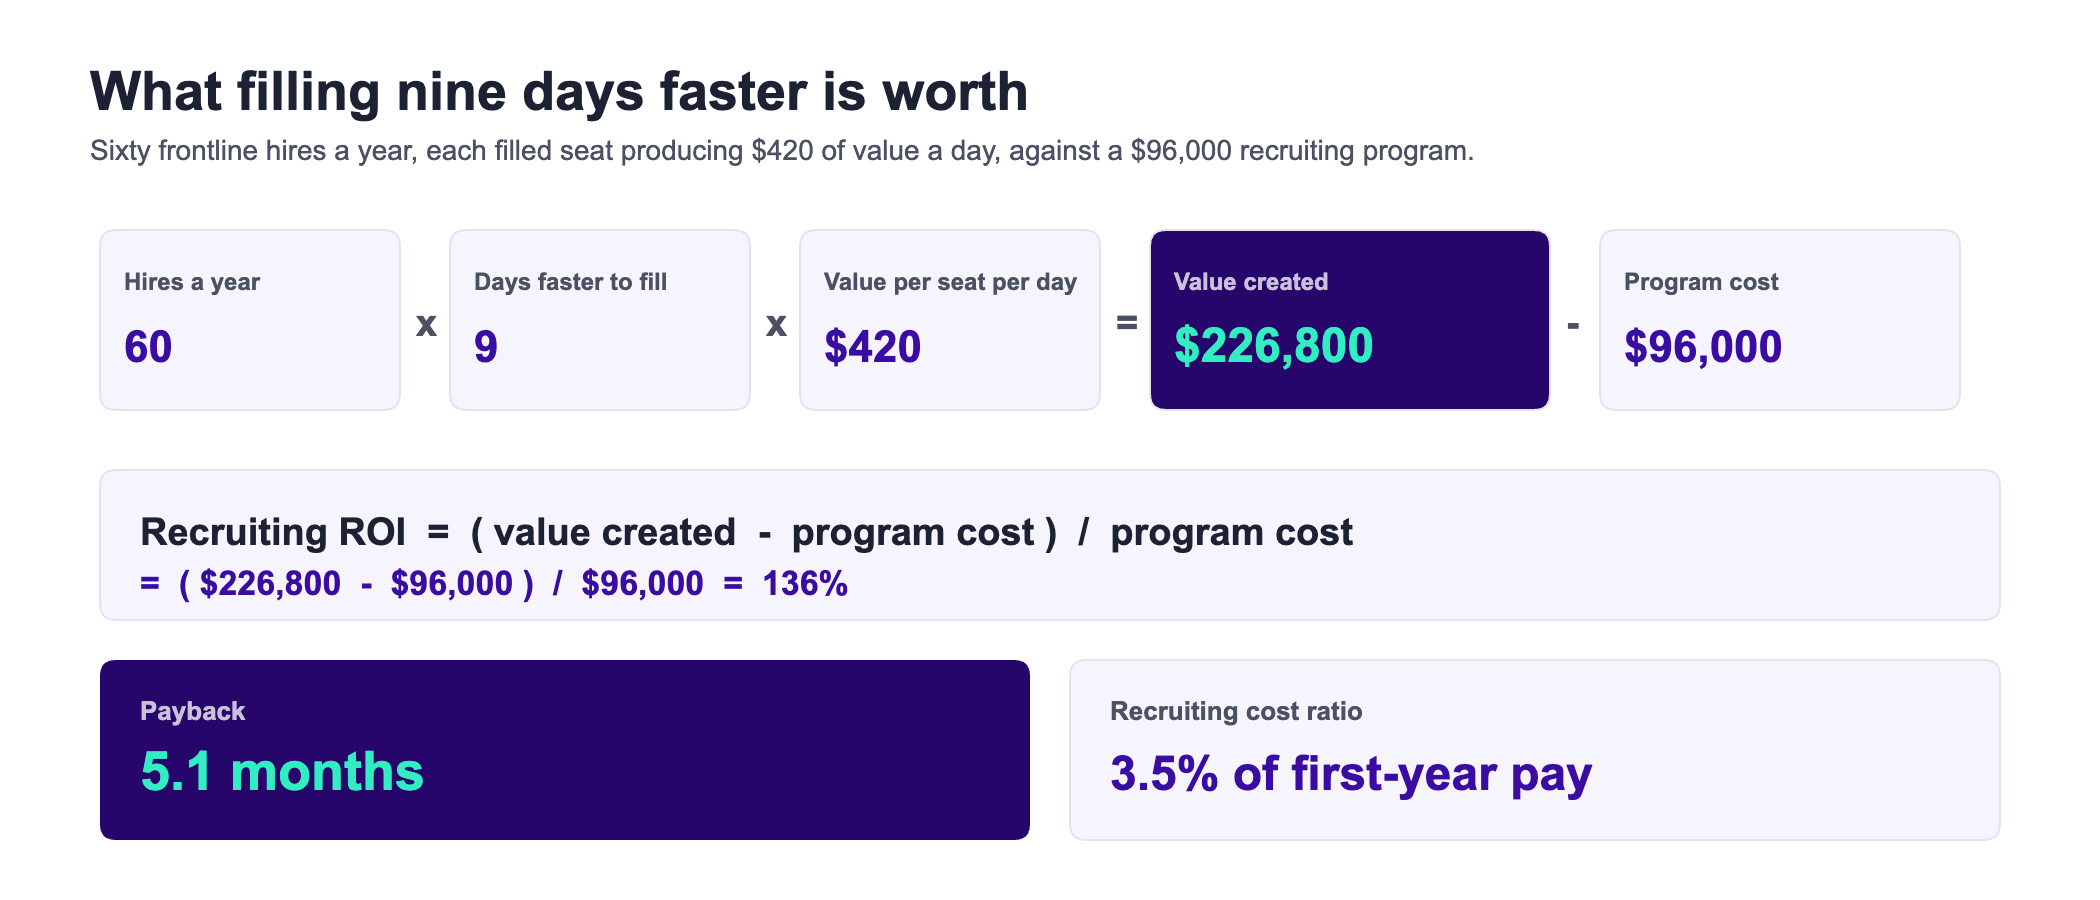
Recruiting ROI is (value created − program cost) ÷ program cost, and for a frontline employer the value is almost always time: sixty hires a year filled nine days faster, on seats worth $420 a day, is $226,800 of output that would not otherwise have happened — a 136% return on a $96,000 program. The calculator below produces that figure, the payback period, and the recruiting cost ratio, which is the version of the same story that finance already knows how to read.
What recruiting ROI is, and the formula
Return on investment on a recruiting program is the same arithmetic as any other investment: what the money produced, less what it cost, over what it cost. The difficulty is never the formula. It is the numerator, because recruiting produces its value indirectly — a seat that is filled rather than empty, and filled sooner rather than later.
There are three defensible ways to price that, and only one of them survives a conversation with a finance team.
- Time saved, valued at the seat's output. Days faster to fill × the value one filled seat produces per day × hires. Defensible because both numbers come from your own operations, not from a survey.
- Cost avoided. The agency fees, overtime premiums or backfill you did not have to pay because you filled the seat yourself. Defensible when you can point at last year's invoices.
- Quality of hire. Real, and almost never provable inside a budget cycle. Leave it out of the ROI number and describe it separately.
The calculator uses the first, because it is the one a frontline employer can actually evidence. The formula in full:
The formula
Value created = hires per year × days faster to fill × value of one filled seat per day
Recruiting ROI = (value created − program cost) ÷ program cost
Payback is the program cost divided by the value it creates, expressed in months. Every one of these inputs is yours; none of them is a benchmark.
Recruiting ROI calculator
Recruiting cost ratio: the same story, in the unit finance uses
ROI answers "was it worth it". Recruiting cost ratio answers a question finance asks more often: what share of the payroll we added did it cost to add it? The formula is recruiting cost over the compensation of the people recruited, as a percentage — defined in the benchmarking literature as the expense incurred by the recruiting function relative to the total compensation-related expense for the positions filled in the same period.
Recruiting cost ratio
Recruiting cost ratio = total recruiting cost ÷ total first-year compensation of the hires × 100
Lower is better, and unlike cost per hire it stays meaningful when the roles in the period are not alike. Sixty hires at $46,000 with a $96,000 program is a 3.5% ratio; the same program filling six executive roles would produce a very different cost per hire and a similar ratio.
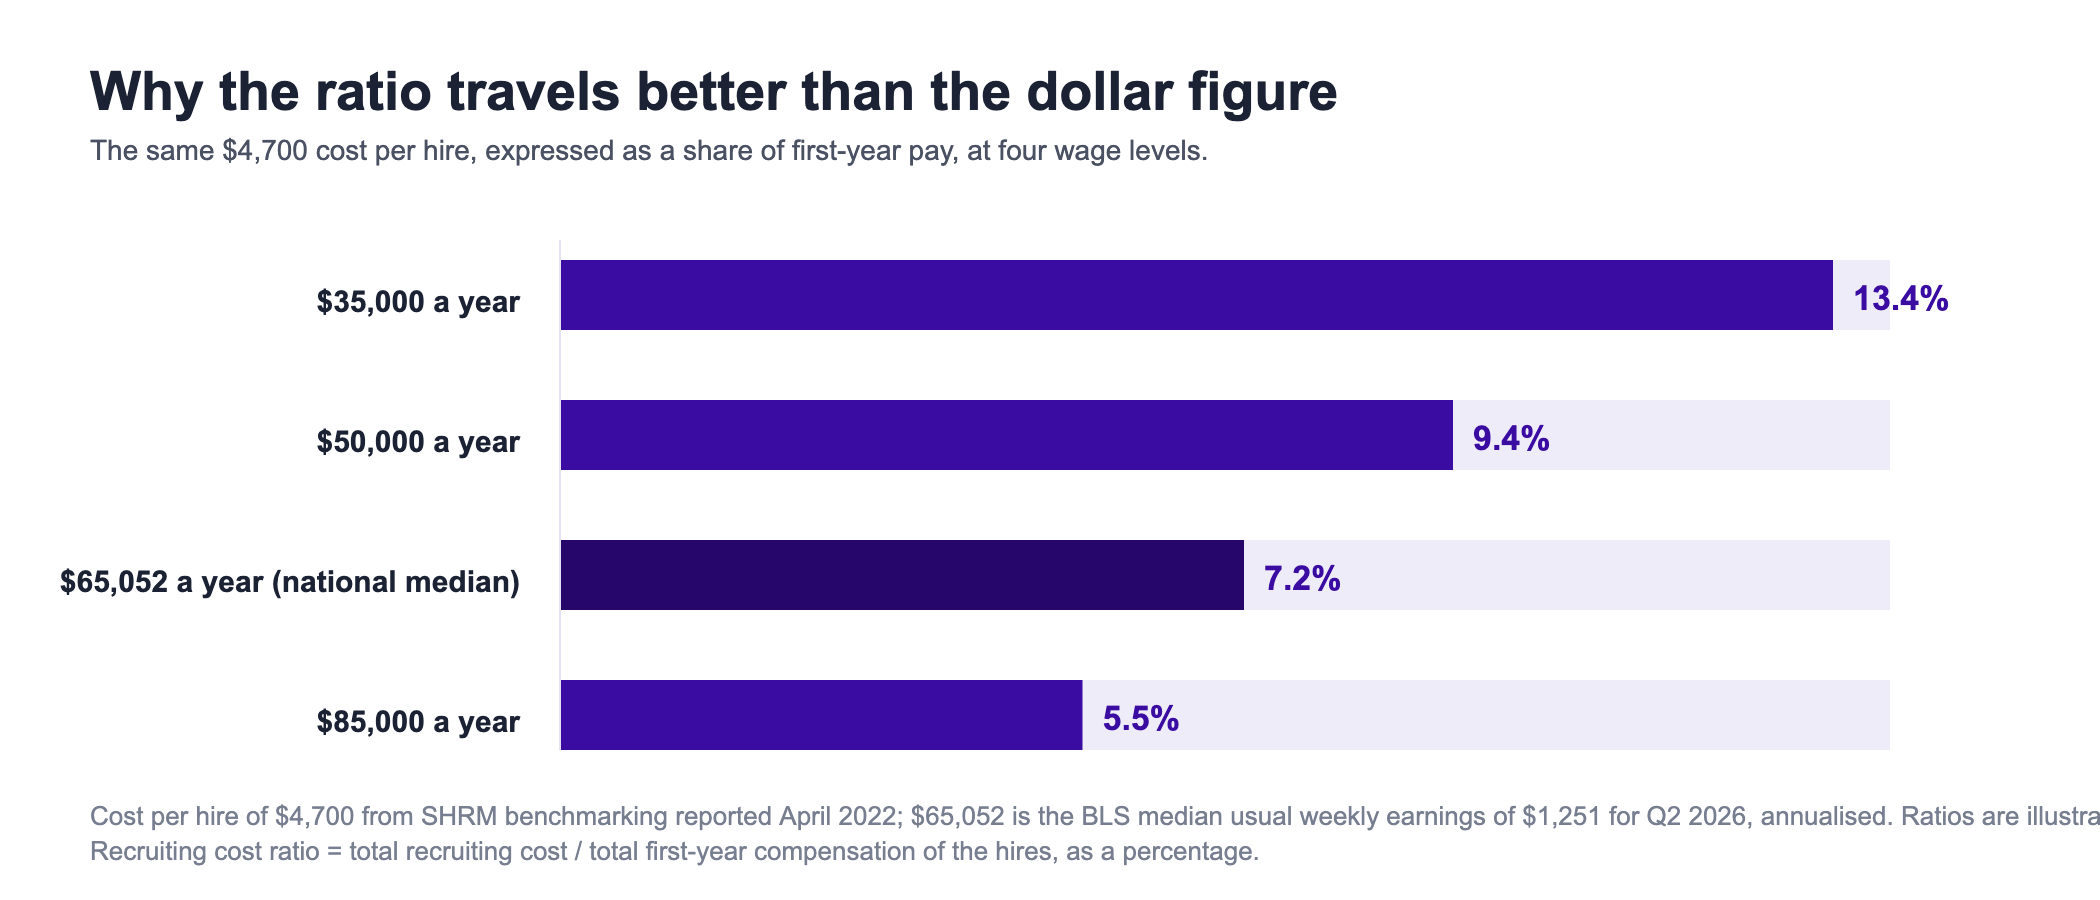
On the benchmark: there is no free, credible published distribution for this ratio. The best-known benchmark set is sold rather than published, drawn from a sample of 44 organizations. So rather than quote a number we cannot show you the workings for, here is the arithmetic you can check: SHRM's benchmarking put cost per hire at nearly $4,700, and BLS reported median usual weekly earnings of $1,251 in the second quarter of 2026, which annualises to $65,052. One over the other is a recruiting cost ratio of about 7% for a workforce paid at the national median. Treat that as an order of magnitude, not a target, and note what it implies: the same dollar cost per hire is a much heavier ratio on a low-wage role than on a high-wage one.
What to count as recruiting cost
The denominator of the ROI and the numerator of the ratio are the same figure, so it is worth being deliberate about it once. Count everything that would stop if you stopped recruiting:
| Include | Why |
|---|---|
| Advertising and social recruitment spend | Stops immediately when the program stops |
| Job board and posting subscriptions | Apportion an annual contract to the period |
| Agency, search and referral fees paid | Directly caused by the hires in the period |
| Recruiter and coordinator compensation | The largest internal line at most employers |
| Hiring manager and interviewer hours, at a loaded rate | Real cost, usually uncounted, and the main reason two employers' figures differ |
| Applicant tracking system and recruiting tools | Apportioned to the period |
| Screening, checks and pre-employment testing | Per-candidate, across the whole funnel |
Leave out the cost of employing the people once they start — wages, payroll taxes, benefits and workers' compensation belong to a different calculation, which the employee cost calculator handles. Leave out onboarding and training too if you are comparing against an agency fee, because you would pay those either way. The one rule that matters: whatever you include, include the same things next quarter.
The three numbers finance will accept
Most recruiting ROI presentations fail for the same reason: they lead with a number nobody outside the talent team can audit. These three survive scrutiny because each traces to a system someone else already owns.
- Cost per applicant, by campaign. Straight out of the advertising platform, and the only figure on this page an advertising partner can be held to. Across 891 campaigns in our 2026 benchmark the median campaign cost $13.88 per applicant and the volume-weighted average was $8.02.
- Days to fill, before and after. Out of the applicant tracking system. It is the input the ROI calculation actually turns on, and it is the one an operations leader will already have an opinion about.
- Recruiting cost ratio. Out of the general ledger and the payroll report. It normalises across role mix and across years, which cost per hire does not.
What does not survive scrutiny is a cost per hire derived from advertising data, or a quality-of-hire figure asserted inside the same slide as the spend. The process side of that argument — what to instrument, and at what cadence — is set out on how to measure recruitment marketing; this page is the arithmetic.
Where the benchmark data fits
One input to the calculator is a number we publish rather than one you have to estimate. The 2026 social job advertising benchmark reports what an applicant costs across 891 managed campaigns: a $13.88 median campaign cost per applicant, an $8.02 volume-weighted average, and a middle half running from $6.48 to $29.74. Multiply your own applicants-per-hire ratio by a figure from that distribution and you have the advertising component of your program cost, without anyone having to guess.
What the benchmark cannot tell you is the ratio itself. How many applicants make one hire depends on your screening, your interview show rate and your offer acceptance — all of which happen after the click. That is why the calculator asks you for it, and why a channel-level view of the same question lives on job board ROI.
Frequently asked questions
What is recruiting ROI?
Recruiting ROI is the value a recruiting program creates less what it costs, divided by what it costs, expressed as a percentage. For frontline employers the value is usually time: seats filled sooner produce output sooner. Sixty hires filled nine days faster, on seats worth $420 a day, create $226,800 of output; against a $96,000 program that is a 136% return.
How do you calculate recruitment ROI?
Multiply hires per year by the days you shortened time to fill by the daily value of one filled seat. That is the value created. Subtract the annual program cost, divide by the program cost and multiply by 100. Use the value of the seat's output, not revenue per employee divided by 365, and use days you can evidence from your applicant tracking system rather than an estimate.
What is a good recruiting cost ratio?
Lower is better, and there is no free published distribution to compare against — the best-known benchmark set is sold rather than published and is drawn from 44 organizations. As an order of magnitude, SHRM's cost per hire of nearly $4,700 against annualised median earnings of $65,052 is about 7%. Frontline employers should expect a higher ratio at the same dollar cost, because the denominator is smaller.
What is the recruiting cost ratio formula?
Recruiting cost ratio = total recruiting cost divided by the total first-year compensation of the people hired in the same period, multiplied by 100. The numerator is the same recruiting cost you would use for cost per hire; the denominator swaps the number of hires for the pay bill those hires created, which is what makes the ratio comparable across periods with different role mixes.
Is recruitment marketing ROI different from recruiting ROI?
Yes, in scope. Recruitment marketing ROI covers the advertising and employer brand spend that brings candidates in, and it is measured in applicants and cost per applicant. Recruiting ROI covers the whole function, including recruiter and hiring manager time, and it is measured in filled seats. The first is a component of the second, and only the first can be attributed to a channel.
How much does recruiting cost?
On a per-hire basis, SHRM's benchmarking reported an average of $4,129 for fiscal 2015 and nearly $4,700 in April 2022, though published figures vary widely with where the cost boundary is drawn. On the advertising line alone, our 2026 benchmark of 891 campaigns found a median campaign cost of $13.88 per applicant and a volume-weighted average of $8.02.
What counts as total recruiting cost?
Advertising and job board spend, agency, search and referral fees, recruiter and coordinator compensation, hiring manager and interviewer hours at a loaded rate, the applicant tracking system and recruiting tools apportioned to the period, and screening, checks and pre-employment testing. Leave out the cost of employing the person once they start; that is a separate calculation.
How do you calculate recruiting cost savings?
Compare like with like against the alternative you would otherwise have used. Against an agency, the saving is the placement fees you did not pay less the internal cost of running the search yourself. Against overtime or agency backfill, it is the premium avoided for the days the seat would have stayed open. Both are cost avoided, not value created, so report them separately from ROI rather than adding them to it.
Two neighbors: work the cost side alone in the cost per hire calculator, or start from what an applicant actually costs in the 2026 benchmark.
Put a measured number in the ROI case
Tell us the roles you are filling and the markets you are filling them in, and we will show you what an applicant costs there before you commit a budget.
Book a Demo