
How to Measure Recruitment Marketing: What to Instrument Before the First Dollar, Three Cadences, One Rule, and What You Can Prove to Finance
Measuring recruitment marketing is a system, not a dashboard: instrument three things before the first dollar (an in-platform form, a source on every application, hires tagged in the ATS), read three numbers weekly per campaign (frequency, apply rate, cost per applicant with the fee inside), and roll them up monthly by campaign and quarterly by channel. One rule holds it together — report by campaign, never in aggregate — because in Boostpoint's 2026 Social Job Advertising Benchmark the top 10% of campaigns produced 57% of all applicants on 22% of the budget, and an average hides exactly that. What you can prove to finance is cost per applicant and where the money concentrated; what you can't prove from ad data is a cost per hire, and this page says why. Below: the instruments, the cadences, the rule, the proof, and two tools. If what you need is the arithmetic rather than the measurement plan, the recruiting ROI calculator works the return, the payback period and the recruiting cost ratio in one place.
Source: Boostpoint 2026 Social Job Advertising Benchmark — 891 Boostpoint-managed campaigns on Meta (1,334 campaign-months), 2026; costs are what advertisers paid for advertising only.
A note on who's writing this
Boostpoint runs recruitment campaigns and reports them weekly, so the system on this page is the one we use, and a page recommending our own reporting practice is a page recommending us. The figures behind it are the published 2026 benchmark — 891 campaigns and 1,334 campaign-months — with the expensive end shown; the frequency threshold and the report-by-campaign rule are what the data drew, not what we prefer. We don't track hires, so nothing here is a cost per hire, and the section on what you can prove says plainly where our data stops and your ATS starts. The measurement plan builder is our judgment; the concentration calculator is arithmetic on your own campaigns.
The case for measuring less, made first
The honest objection to a measurement system is that most of what gets measured in recruiting changes nothing. A dashboard with fourteen tiles — impressions, reach, engagement, click-through, cost per click, cost per thousand, video views, saves — is a report of what happened, and none of those tiles tells a recruiter what to do on Monday. Time to fill goes up when the pool is thin and down when it's not, and a manager can't act on it. Source of hire is only as good as the source field, which is usually blank. So the case for measuring less is right: three numbers a week per campaign, read against a threshold, decide everything that can be decided. The case for measuring at all is the concentration finding — that the money was in a few campaigns and nobody could see which ones from the average — and that finding is only visible to an employer who instrumented the three things below before the campaigns ran.
What to instrument before the first dollar
Three instruments, in the order they pay, and none of them is a tool you buy. The application inside the platform. When the form lives in the ad, the platform's applicant count is real and the click-to-application rate — the number that explained 70% of cost variation in the benchmark — is visible. When the click leaves for a career site, the platform goes blind at the click and every later number is a guess; the reference case, 60,889 clicks and zero tracked applications, is on the attribution page. A source on every application. The integration writes it, a tagged URL carries it, the ATS field requires it; the vocabulary is one list, and "Facebook," "FB" and "social" are one source, not three. Hires tagged in the ATS. Not for the platform — it will never see them — but for you, because the only cost per hire that exists is applications with a source, divided into hires with the same source, in your own system. Instrument those three and the rest of this page is arithmetic; skip any one and there's a layer you're reporting on faith.
Three cadences, and what each one decides
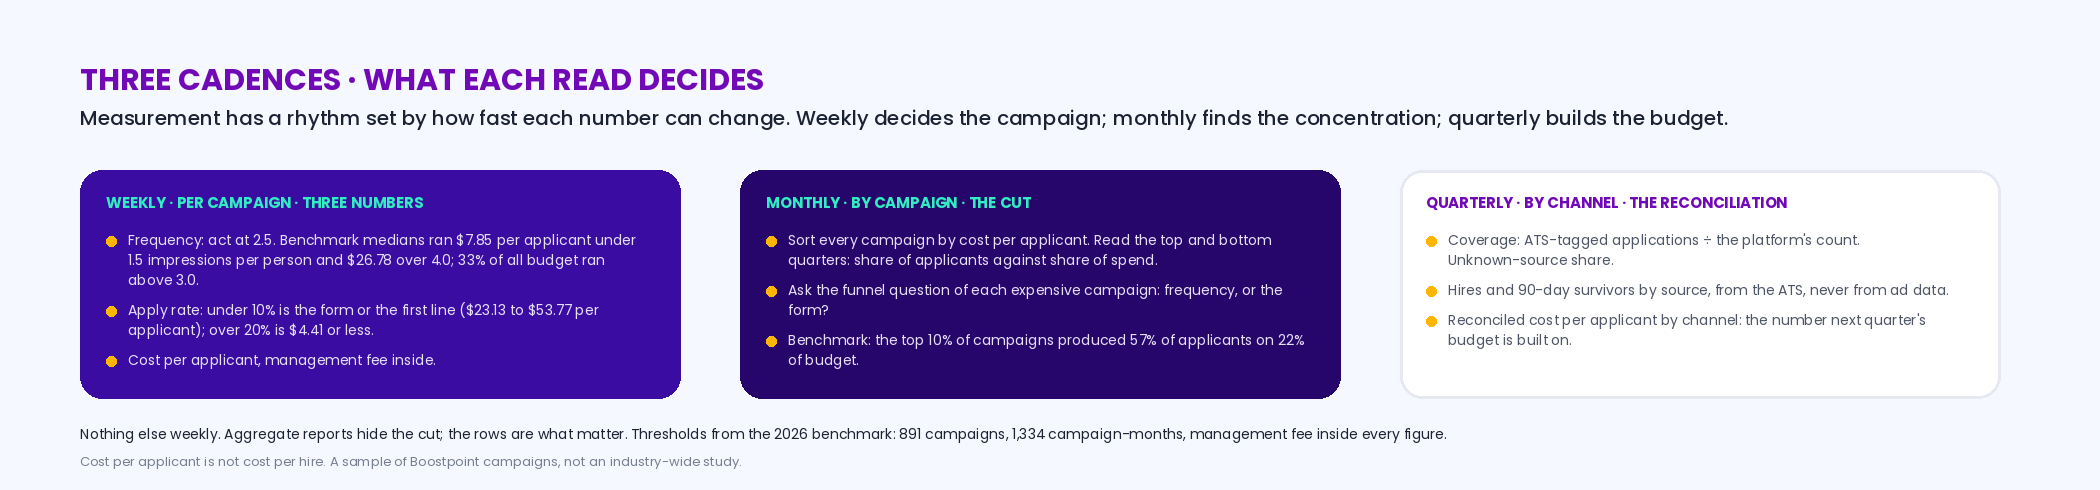
Measurement has a rhythm, and the rhythm is set by how fast each number can change. Weekly, per campaign — three numbers, one threshold. Frequency, because it crosses the cliff in a fortnight: campaigns under 1.5 impressions per person ran a median $7.85 per applicant in the benchmark, campaigns over 4.0 ran $26.78, click-through fell from 1.69% to 0.94% across the range, and 33% of all budget ran above 3.0; the operating rule is to act at 2.5 — rotate the creative, widen the audience, or cap the budget. Apply rate, because it tells you whether the form or the first line is leaking (under 10% costs $23.13 to $53.77 per applicant; over 20% costs $4.41 or less). And cost per applicant, because it's the number the other two explain. Nothing else weekly. Monthly, by campaign — the concentration cut. Sort every campaign by cost per applicant, read the top and bottom thirds, and ask the funnel question of each expensive one: is it frequency, or is it the form? This is the read that finds the 57%-on-22%, and it only works campaign by campaign. Quarterly, by channel — the reconciliation. The platform's count against the ATS's tagged count (coverage), the unknown-source share, hires and 90-day survivors by source, and the reconciled cost per applicant by channel with the fee inside — which is what the next quarter's budget is built on. The quarterly sheet is described on the attribution page; the budget it feeds is on the budget page.
Interactive
Measurement plan builder — your channels, campaigns and what's instrumented; get the weekly, monthly and quarterly checklist, and the honest note on what you'll be able to prove
Nothing is stored or sent — this runs in your browser. The plan is Boostpoint's practice; the gaps it flags are the layers you're reporting on faith.
The one rule: report by campaign, never in aggregate
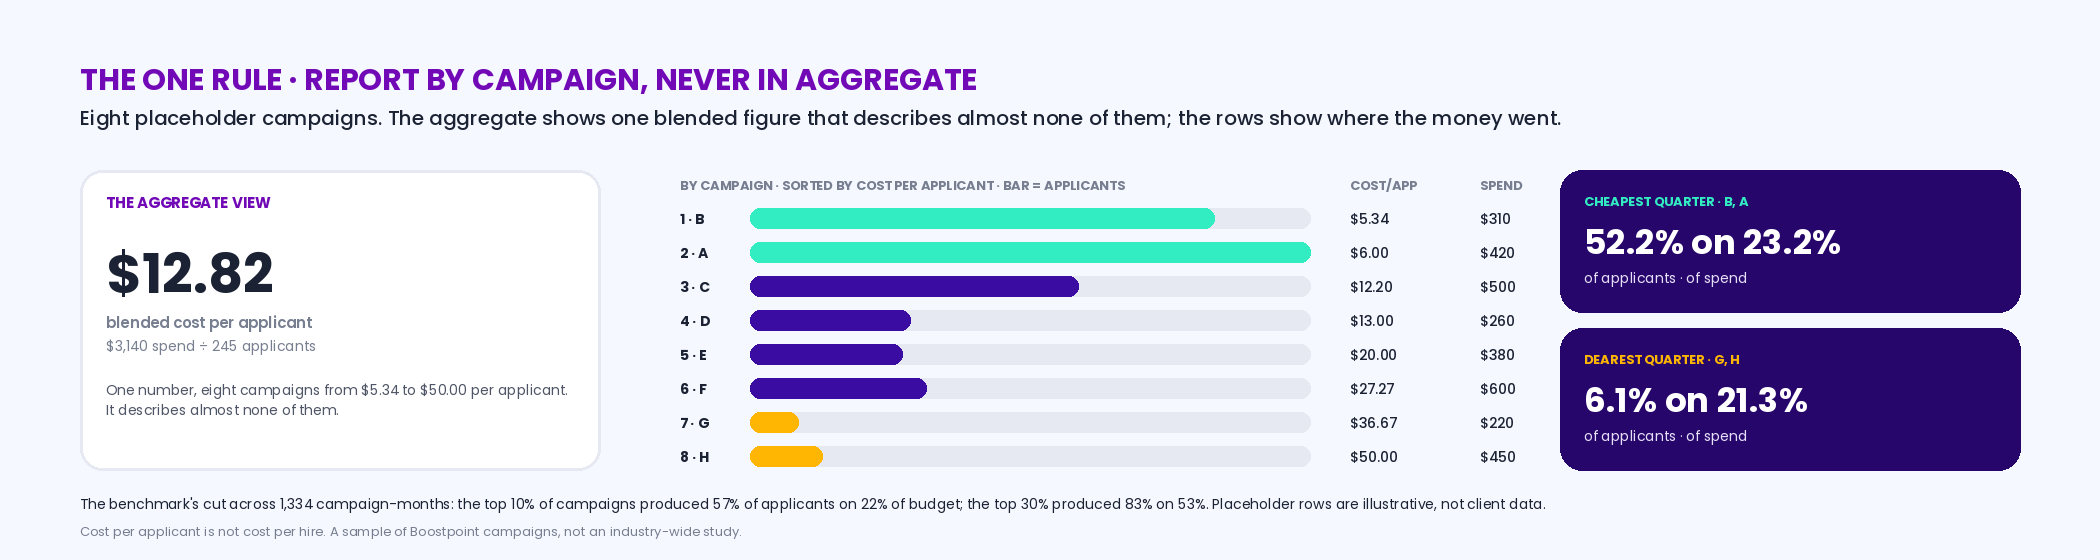
If this page had to be one sentence, it would be this one. Across 1,334 campaign-months, the top 10% of campaigns produced 57% of all applicants on 22% of the budget, and the top 30% produced 83% on 53%; the bottom of the distribution, read the other way, is a large share of spend producing very little. An employer looking at the account-level average — spend divided by applicants across everything — sees a number near the middle and learns nothing, because the middle is where almost no campaign actually sits. Report by campaign and the same data says: these two campaigns are doing the work, these three are burning money at a frequency of 4, and this one has a portal behind it. The same rule applies to every roll-up. By role, because a caregiver campaign at 31% apply rate and a nurse campaign at 11% average to a number that describes neither; by market, because a metro and a small town on the same template have different circles (the frequency trap); by channel, because a board's clicks and a social campaign's applicants are different funnels. The calculator below does the concentration cut on your own campaigns; enter eight and read where the money went.
Interactive
Concentration calculator — up to eight campaigns' spend and applicants; see the cost per applicant of each, the cut sorted from cheapest to dearest, and what share of your applicants came from what share of your money
Nothing is stored or sent — this runs in your browser. The eight rows are placeholders; replace them with last month's campaigns. Leave a row at zero to exclude it.
total spend ÷ total applicants
share of applicants on share of spend
share of applicants on share of spend
top 10% of campaigns; top 30% produced 83% on 53%
Recruitment marketing metrics: the six that decide, and the ones that don't
The metric list on the analytics page is six long — cost per applicant with the fee inside, apply rate, frequency, reach, cost per campaign, and the concentration cut — and the discipline is in what's not on it. Impressions and reach describe how many people the auction served; useful for one thing, computing frequency, and not a result. Click-through rate matters (it explained 30% of cost variation) but it's a symptom, not a lever; the first line fixes it. Cost per click is a board's metric, and a click is not an applicant — the translation at whatever apply rate you observe is on the job board ROI page. Engagement, saves, shares and video views are not recruiting metrics at all. Time to fill is an ATS metric that measures the pool and the process together and can't be acted on by an advertiser. And cost per hire, the metric everyone asks for, is the one no ad platform can supply, because the hire happens where the platform isn't looking. A measurement system that reports the six and refuses the rest is not less rigorous; it's the only version a recruiter will still be running in six months.
Proving recruiting ROI: what you can show finance, and what you can't
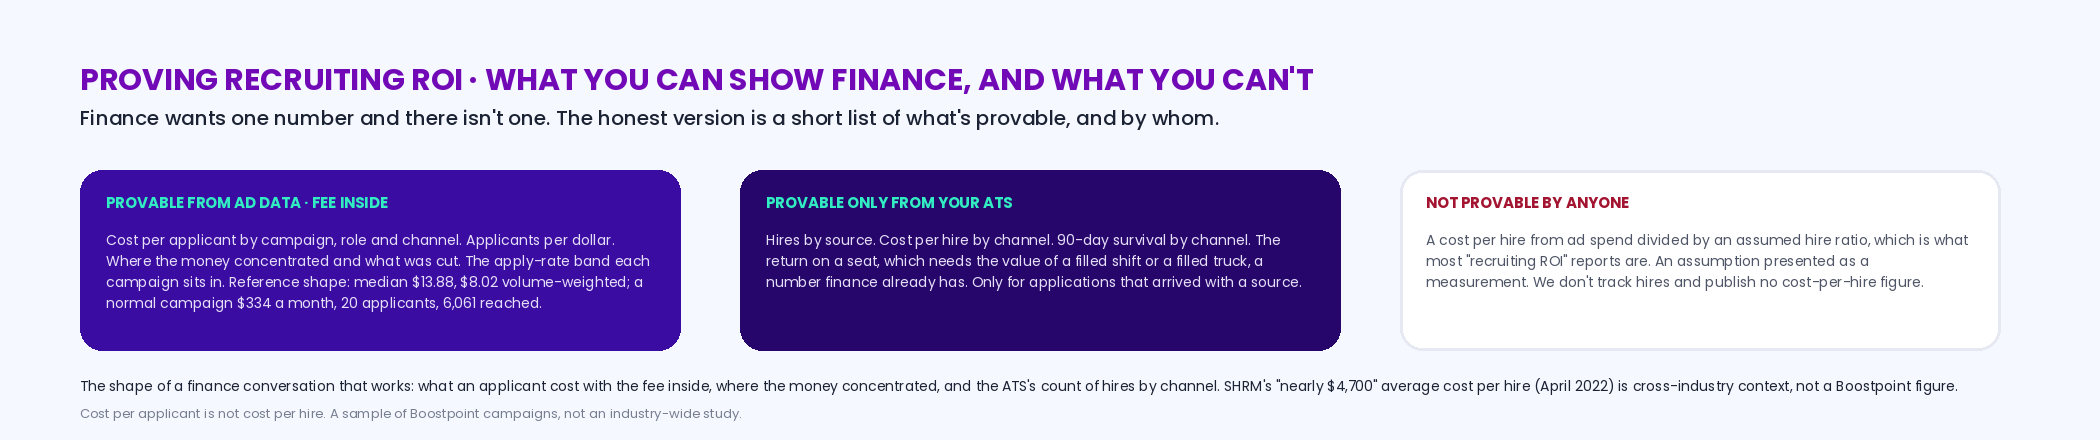
Finance wants one number and there isn't one, so the honest version is a short list of what's provable and a shorter list of what isn't. Provable from ad data with the fee inside: cost per applicant by campaign, by role and by channel; how many applicants a dollar buys; where the money concentrated and what was cut; the apply-rate band each campaign sits in and what moving it would have returned. Our benchmark's shape is the reference — a median $13.88 per applicant, $8.02 volume-weighted, a normal campaign on $334 a month for 20 applicants and 6,061 people reached — and yours is the same shape on your own numbers. Provable only from your ATS: hires by source, cost per hire by channel, 90-day survival by channel (why that column matters), and the return on a seat — which needs the value of a filled shift or a filled truck, a number finance already has. Not provable by anyone: a cost per hire from ad spend divided by an assumed hire ratio, which is what most "recruiting ROI" reports are. The shape of a finance conversation that works: here's what an applicant cost, here's where the money concentrated, here's what we cut, and here's the ATS's count of who we hired from each channel — with SHRM's "nearly $4,700" average cost per hire (April 2022) as the cross-industry context for the size of the seat, not as a number of ours. What the outsourced version of this reporting should hand you every week is on the services page.
When the measurement system is more than you need
Three cases. If you run one campaign for one role, read it weekly against the frequency threshold and the apply-rate band and skip the monthly and quarterly layers; there's nothing to concentrate. If you hire a handful a year, the ATS source field will say "referral" and the honest measurement is a conversation with the person who referred them. And if the ATS can't take a source at import, build the weekly and monthly layers anyway — they need only the platform — and treat the quarterly reconciliation as the reason to fix the intake, not as a spreadsheet to maintain by hand. What no employer should skip is the instrument that costs nothing: keep the form where the ad is.
Frequently asked questions
How do you measure recruitment marketing?
Instrument three things before spending — an in-platform application, a source on every application, hires tagged in the ATS — then read three numbers weekly per campaign (frequency, apply rate, cost per applicant with the fee inside), do a monthly concentration cut by campaign, and reconcile quarterly by channel against the ATS. The one rule is to report by campaign, never in aggregate: in our 2026 benchmark the top 10% of campaigns produced 57% of applicants on 22% of budget, which an average hides.
What are the most important recruitment marketing metrics?
Six: cost per applicant, apply rate, frequency, reach (only to compute frequency), cost per campaign, and the concentration cut. Apply rate explained 70% of cost variation in the benchmark and frequency has a threshold (act at 2.5). Impressions, engagement, video views and cost per click are not recruiting results; time to fill is an ATS metric an advertiser can't act on; cost per hire can't come from ad data.
How do you prove recruiting ROI?
By separating what ad data can prove from what only the ATS can. Ad data with the fee inside proves cost per applicant by campaign, role and channel, applicants per dollar, and where the money concentrated. The ATS proves hires by source, cost per hire by channel and 90-day survival. Nobody can prove a cost per hire from ad spend divided by an assumed hire ratio. A finance conversation that works shows all three parts in that order.
How often should recruitment marketing be reviewed?
Weekly per campaign, monthly by campaign, quarterly by channel. Weekly because frequency crosses the cliff within two weeks in a small audience — over 4.0 ran a median $26.78 per applicant against $7.85 under 1.5 — and the fix (rotate creative, widen, cap) takes a day. Monthly for the concentration cut. Quarterly for the reconciliation that builds the next budget.
Why report by campaign rather than in aggregate?
Because the money concentrates. Across 1,334 campaign-months, the top 10% of campaigns produced 57% of all applicants on 22% of budget, and 41% of budget ran in campaigns converting under 10% and returned 11% of applicants. An account-level average sits in a middle almost no campaign occupies and hides both facts. The same logic applies by role, by market and by channel; the concentration calculator on this page does the cut on your own campaigns.
What is a good cost per applicant to report?
The one, by campaign, against the band for the role. The benchmark median across all industries is $13.88, $8.02 volume-weighted, with the cheapest tenth of campaigns under $2.91 and the dearest tenth above $66.45; a caregiver campaign and a nurse campaign shouldn't be judged against each other. A media-only figure will look cheaper than a fee-inclusive one and isn't comparable to it. Cost per applicant is not cost per hire.
Can recruitment marketing measure cost per hire?
Not from ad data, and any vendor who says otherwise is dividing spend by an assumption. The hire is recorded in your ATS and payroll, never in an ad account; if applications arrive with a source and hires are tagged to it, your ATS can compute cost per hire by channel over a quarter, and that's the only honest version. We don't track hires and publish no cost-per-hire figure.
How is this page different from the recruiting analytics page?
The analytics page defines the six metrics and what each decides. This page is the system around them: what to instrument before spending, the three cadences and what each decides, the report-by-campaign rule as a method, what you can prove to finance, and two tools — a plan builder and a concentration calculator. Conversion has its own deep dive and source tracking its own page.
See your campaigns the way the benchmark does
Bring last month's campaigns. We'll run the concentration cut, show you which ones did the work and which burned money at a frequency of four, and hand you the weekly, monthly and quarterly reads — and no cost per hire we didn't measure.
Book a DemoBoostpoint figures come from the 2026 Social Job Advertising Benchmark — 891 campaigns and 1,334 campaign-months: top 10% of campaigns 57% of applicants on 22% of budget, top 30% 83% on 53%; conversion explaining 70% of cost variation, click-through 30%, CPM 18%; 41% of budget in campaigns converting under 10% returning 11% of applicants; apply-rate bands under 5% $53.77, 5–10% $23.13, 10–20% $11.11, 20–35% $4.41, over 35% $1.61; frequency under 1.5 $7.85, over 4.0 $26.78, 33% of budget above 3.0, click-through 1.69% to 0.94%, act at 2.5; median $13.88 per applicant, $8.02 volume-weighted, percentiles $2.91 and $66.45; a normal campaign $334 a month, 20 applicants, 6,061 reached. SHRM, average cost per hire "nearly $4,700," April 11, 2022 — cross-industry context, not a Boostpoint figure. The recruiting-roi glossary entry redirects to the recruiting analytics page; nothing on this page duplicates it. Boostpoint is priced as a product subscription plus ad spend: the subscription is priced on job volume and quoted on a call, ad spend is separate and recommended at a minimum of $750 a month per job category, there is one bill, through Boostpoint, and every cost-per-applicant figure we publish includes campaign management. The plan builder is Boostpoint's practice; the concentration calculator computes on the reader's campaigns. Cost per applicant is not cost per hire; we do not track hires and publish no cost-per-hire figure. A sample of Boostpoint campaigns, not an industry-wide study.