
Candidate Conversion Rate: What Good Looks Like, Band by Band and Role by Role, From 891 Campaigns
Candidate conversion rate is the share of people who click a job ad and finish an application, and in Boostpoint's 2026 Social Job Advertising Benchmark it explained 70% of the variation in what an applicant costs — more than the ad's click-through rate (30%) and far more than the auction (18%). What good looks like is a band, not a number: campaigns converting under 5% ran a median $53.77 per applicant, 5–10% $23.13, 10–20% $11.11, 20–35% $4.41, and over 35% $1.61. By role the bands shift — caregivers converted at 31%, warehouse at 20%, registered nurses at 11%, CDL drivers at 8% — and the third-party comparator for job-board ads is Appcast's 6.1%. Below: the three rates people confuse, the bands, the rate by role, what moves it, and two calculators. Cost per applicant is not cost per hire.
Source: Boostpoint 2026 Social Job Advertising Benchmark — 891 Boostpoint-managed campaigns on Meta (1,334 campaign-months), 2026; costs are what advertisers paid for advertising only.
A note on who's writing this
Boostpoint runs recruitment ads with a short in-platform application behind them, so a page arguing that the application form is the biggest cost lever is an argument for our product, and we say so. The figures are the published 2026 benchmark — 891 campaigns and 1,334 campaign-months — with the expensive bands shown as clearly as the cheap ones; several earlier campaign-level analyses are labeled as such and the benchmark is canonical where they conflict; the job-board comparator is Appcast's own published figure for pay-for-performance ads, which measures a different funnel from ours and is presented as theirs. One row of the benchmark's role table is not published on this page. Nothing here is a cost per hire.
Three rates people call "conversion," and which one this page means
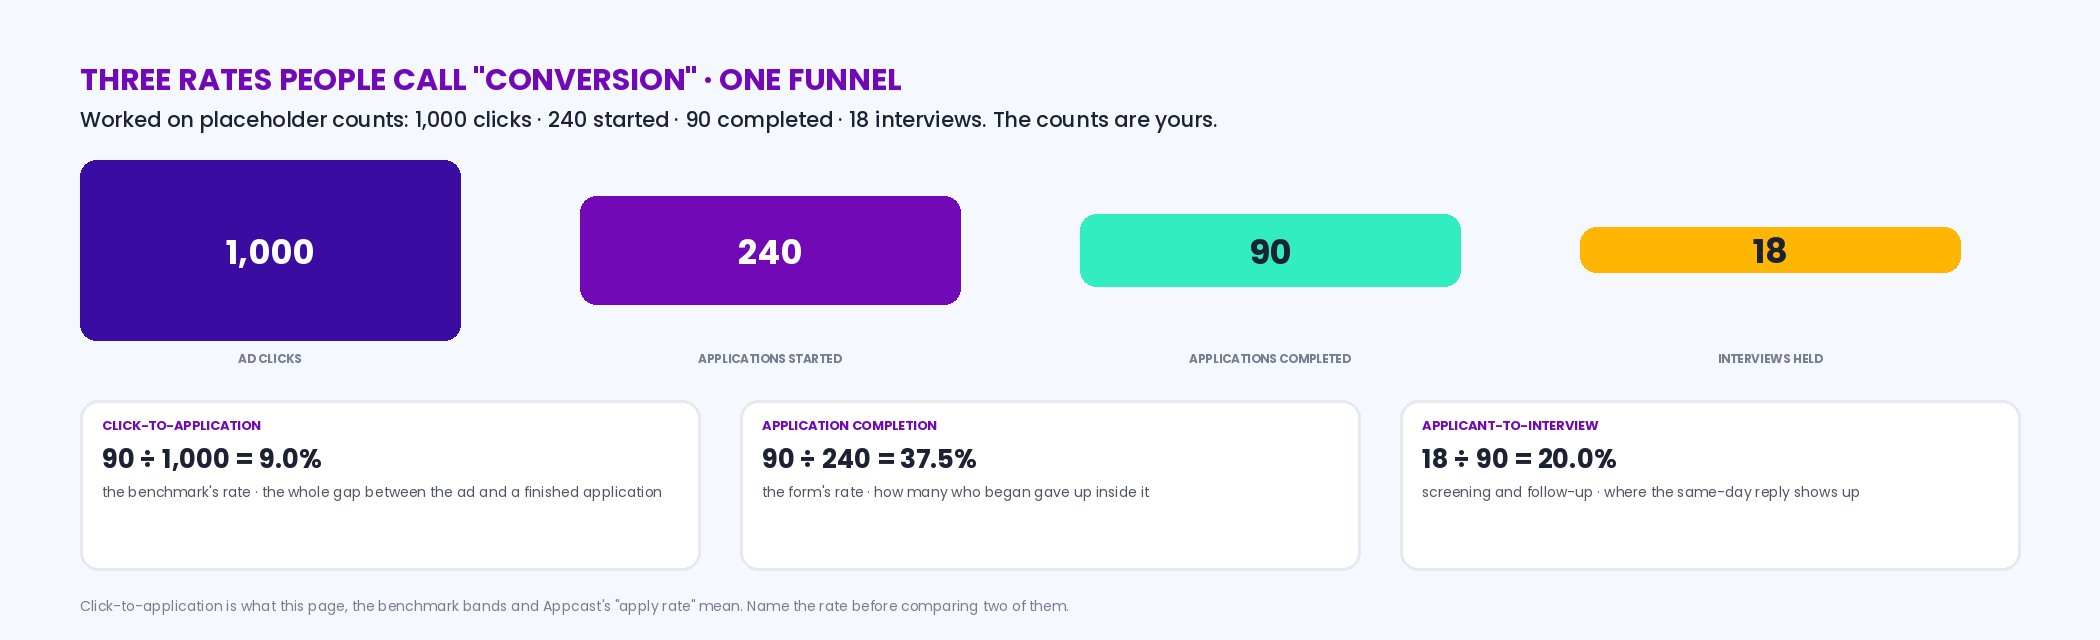
Recruiting funnels have at least three conversion rates, and arguments about "what's a good conversion rate" usually turn out to be two people measuring different steps. Click-to-application rate — applications completed divided by ad clicks — is what this page and our benchmark mean by conversion, and what Appcast means by "apply rate." It measures the whole gap between the ad and a finished application: the landing, the form, the friction, the honesty of the ad. Application completion rate — applications finished divided by applications started — isolates the form: a 40% completion rate says six in ten people who began the form gave up inside it, which is a field-count problem, not an audience problem. Applicant-to-interview rate — interviews held divided by applications — is a screening and follow-up measure, and it's where the same-day reply and the knockout questions show up. All three are yours to compute from an ad account and an ATS; the calculator below takes the four counts and returns all three, and places the first one on the benchmark bands. Where the ad platform hosts the form, click-to-application and completion are both visible; where the ad sends people to a career-site portal, the completion step usually isn't measured at all, which is one reason portals convert so badly and nobody notices.
What good looks like: the five bands
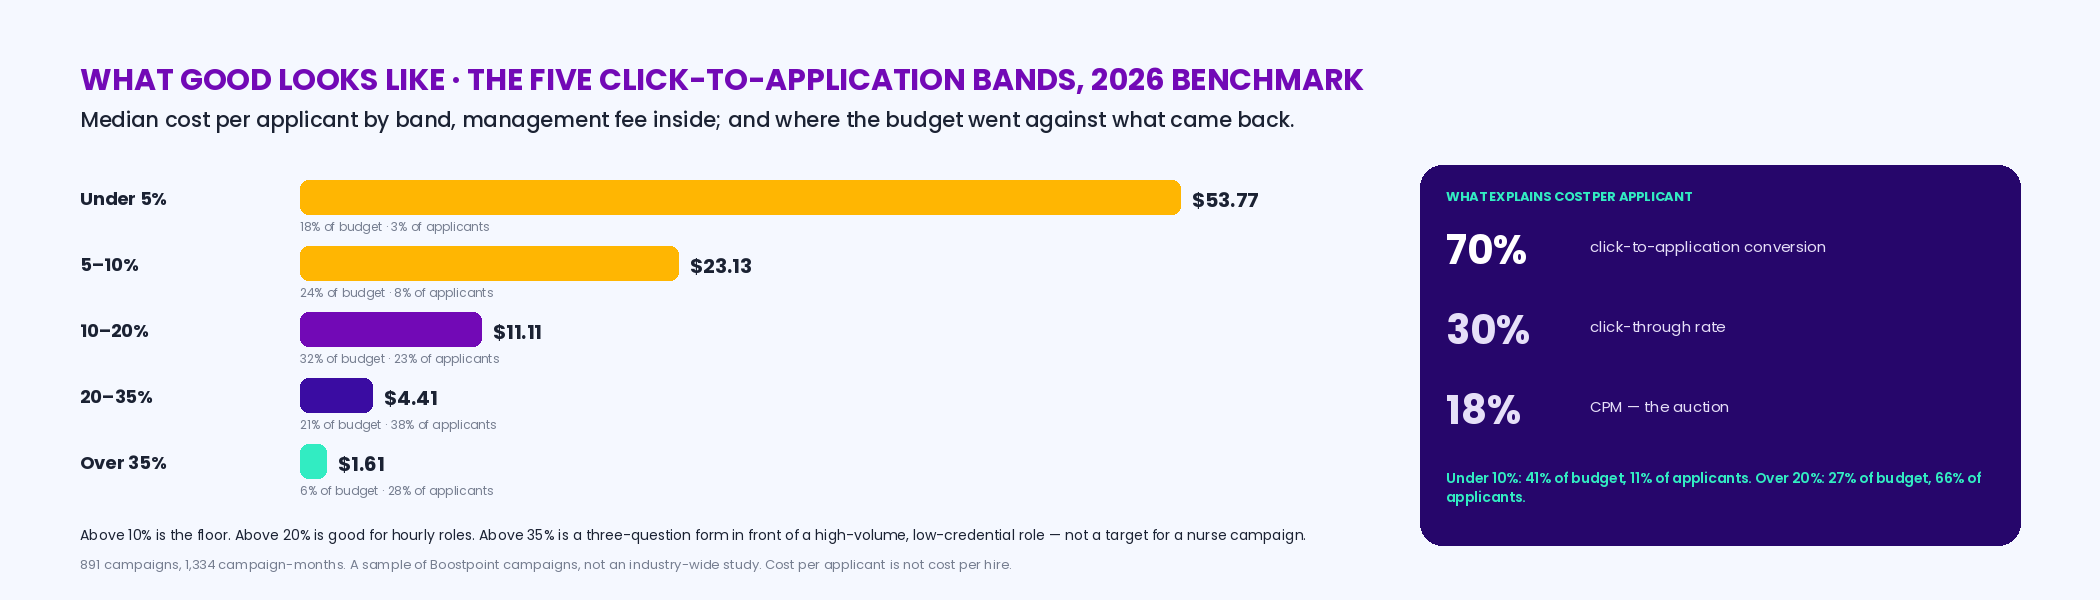
We didn't set thresholds; the data drew them. Sorting 1,334 campaign-months by click-to-application rate and reading the median cost per applicant in each band gives a curve steep enough to be the most useful thing in the benchmark. Under 5%, a median $53.77 per applicant; 5% to 10%, $23.13; 10% to 20%, $11.11; 20% to 35%, $4.41; over 35%, $1.61. The money tells the same story from the other side: campaigns converting under 10% took 41% of all budget and returned 11% of all applicants, while campaigns over 20% took 27% of budget and returned 66%. So "good" has three honest answers. Above 10% is the floor: below it you're paying twenty to fifty dollars for what others pay five for, and the fix is almost always the form. Above 20% is good for most hourly roles: the median warehouse campaign sits there, and it's where budget starts buying applicants roughly in proportion. Above 35% is what a three-question form in front of a high-volume, low-credential role looks like — caregivers, customer service — and it isn't a target for a nurse campaign, because the pool is different. The bands are cross-industry; the role table below is where to read your own.
| Click-to-application rate | Median cost per applicant | Share of all budget | Share of all applicants | What it usually means |
|---|---|---|---|---|
| Under 5% | $53.77 | 18% | 3% | A portal, a login, a résumé upload — or an ad that promised something the form didn't |
| 5% to 10% | $23.13 | 24% | 8% | A long form, a credentialed role, or a first line that doesn't name the wage |
| 10% to 20% | $11.11 | 32% | 23% | The floor for hourly roles; the median for most technician, trades and nursing campaigns |
| 20% to 35% | $4.41 | 21% | 38% | Good: a short in-platform form, the wage and shift in the first line, an hourly pool |
| Over 35% | $1.61 | 6% | 28% | Three questions and a phone number in front of a high-volume, low-credential role |
Source: Boostpoint 2026 Social Job Advertising Benchmark — 891 Boostpoint-managed campaigns on Meta (1,334 campaign-months), 2026; costs are what advertisers paid for advertising only.
Interactive
Conversion calculator — clicks, applications started, applications completed and interviews; get all three rates, your band, and what the same clicks return at every band
Nothing is stored or sent — this runs in your browser. Counts come from your ad account and ATS for one campaign over one period. Bands are the 2026 benchmark's; your row is highlighted.
completed ÷ clicks — the benchmark's rate
completed ÷ started — the form's rate
interviews ÷ completed — screening and follow-up
median cost per applicant in that band
Conversion rate by role: the pool sets the ceiling
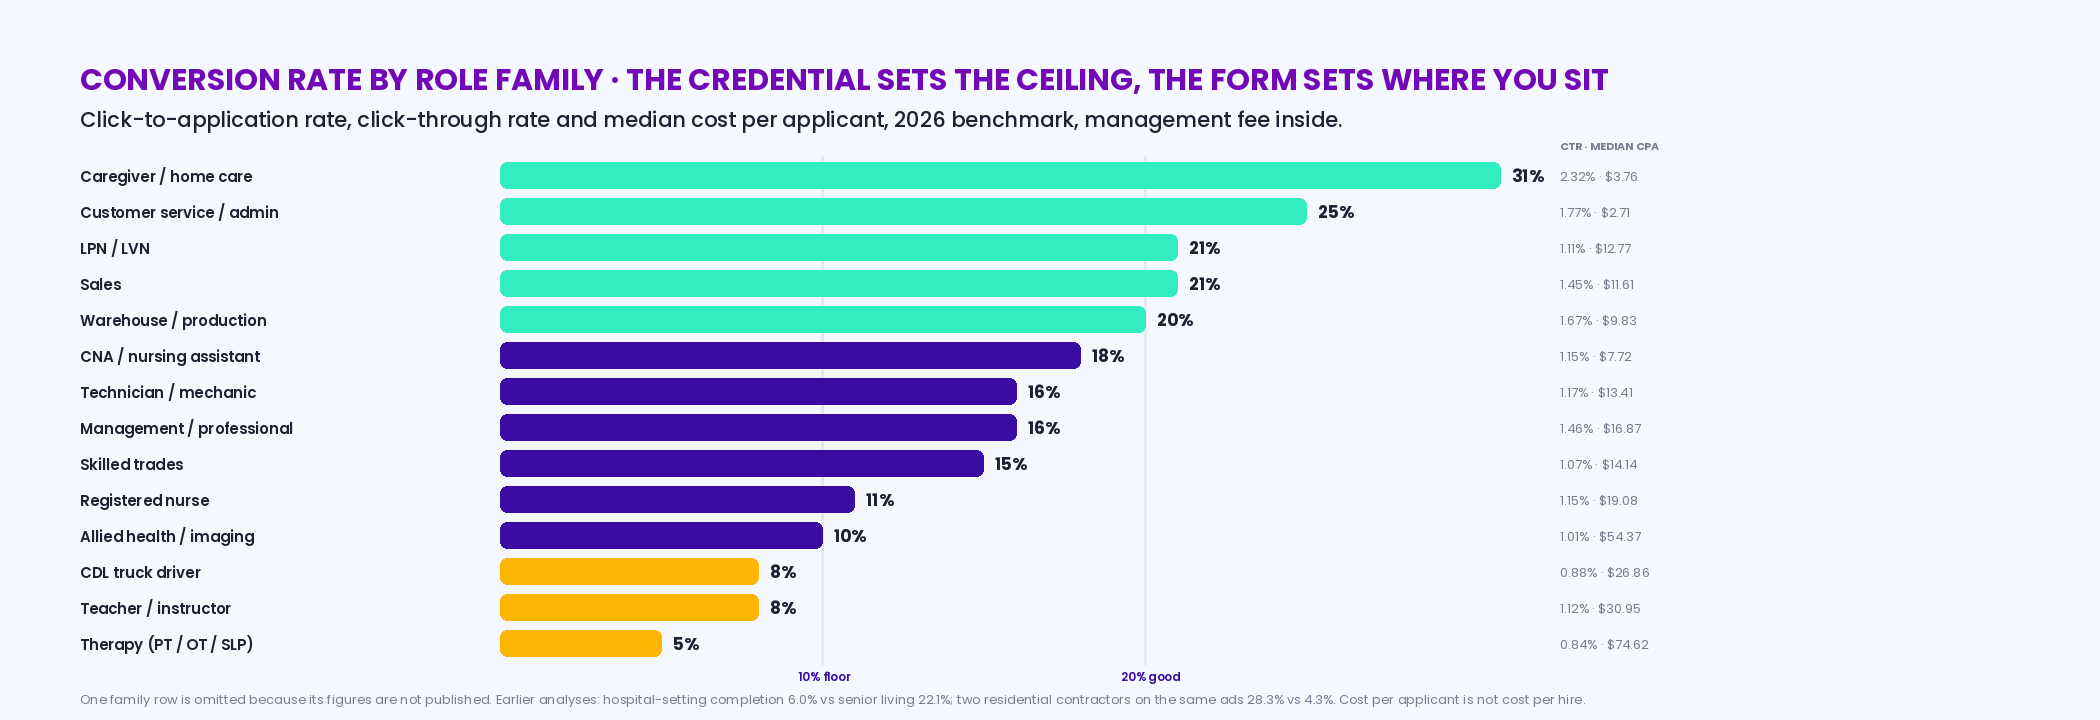
The bands are cross-industry, and the reason a nurse campaign shouldn't be judged against a caregiver campaign is in the role table. Click-to-application rates by role family in the benchmark: caregiver and home care 31%, customer service and admin 25%, LPN and LVN 21%, sales 21%, warehouse and production 20%, CNA 18%, technician and mechanic 16%, management and professional 16%, skilled trades 15%, registered nurse 11%, allied health 10%, CDL truck driver 8%, teacher and instructor 8%, therapy 5%. The pattern is the credential: the scarcer the license, the fewer of the people who click can honestly finish the form, and the more the ad's click-through rate falls too (caregivers 2.32%, CDL drivers 0.88%). By sector the same thing: Retail and Corporate 26%, Skilled Trades and Field Service 18%, Healthcare and Senior Living 16%, Transportation and Logistics 13%, Behavioral and Education 10%. Two earlier campaign-level analyses sharpen it. In healthcare, completion ran 22.1% in senior living and 21.6% in home care against 6.0% in hospital settings, and by role caregiver 31.3%, LPN 18.4%, CNA 17.4%, RN 12.4%, therapy 5.4% — the hospital's portal and the credential together. In the trades, completion across contractors in one book ranged from 3.5% to 18.6%, and two residential home-improvement companies running the same sales campaigns differed six-fold: 28.3% and $4.63 per applicant against 4.3% and $27.77. Same role, same ad, same platform; different form. That's the finding that turns "the pool sets the ceiling" into "the form sets where you sit under it."
Interactive
Role-family comparer — pick the role family and enter your click-to-application rate; see the benchmark's rate, click-through and median cost for that family, your gap, and what the gap costs
Nothing is stored or sent — this runs in your browser. The cost line scales the family's median by the ratio of apply rates and is an illustration of direction, not a forecast.
apply rate · click-through · median cost per applicant
your rate minus the family's
clicks × gap, a month
family median × (family rate ÷ your rate)
The third-party comparator: what job-board ads convert at
Our benchmark measures social ads with an in-platform application. The job-board world publishes its own conversion figures, and the most rigorous is Appcast's Recruitment Marketing Benchmark Report, which for 2025 analyzed "2024 job ad data from more than 1,300 employers in the U.S., analyzing 379 million job ad clicks and over 30 million applies" on pay-for-performance ads — cost-per-click and cost-per-application, excluding duration-based postings. Appcast's finding: "apply rates climbed in 2024, ending the year at 6.1%, a 35% increase from January to December," with technology the highest occupation at 6.41%, marketing and advertising at 6.31%, and business and consumer services at 6.29% (February 11, 2025). Read that beside the bands with care. It's a different funnel — a board's click usually lands on an employer's career site, and the application is whatever that site demands — and a different population, people who searched. But it is the honest comparator: a click-to-application rate of 6.1% sits in our 5–10% band, where the median cost per applicant was $23.13, and the occupations Appcast lists at the top are salaried, title-searched roles where a board is the right tool. Indeed's own guidance points the same direction from inside a board: jobs with a salary get "up to 2.5X more applications" and listings with salary, schedule and benefits get "50% more apply starts" — Indeed's figures about Indeed's users, and the same first line we'd write. What a per-click price turns into per applicant at each rate is on the job board ROI page.
What moves the rate: the form, the first line, the pool, the platform
Four levers, in the order they pay. The form. Every field is a step down a staircase, and the completion rate measures how many people fall off. Three questions and a phone number — name, can you work this shift, do you have the credential — inside the platform, with no account, no résumé and no redirect, is what the over-20% bands are made of; a twelve-field portal with a login is what the under-5% band is made of, and the six-fold gap between two residential contractors running the same ad is the cleanest evidence we have. The first line. The wage, the shift and the site, in that order, before the company name; a click on an ad that names the hourly rate and the second shift is a click from someone who already accepted both, and they finish the form. The anatomy is on the job ad page and the healthcare versions on the templates page. The pool. A credentialed role converts lower because fewer clickers qualify, and no form fixes that; the honest move is to read a nurse campaign against the nurse family, not the caregiver family, and to put the knockout question first so unqualified clickers leave at question one instead of at the résumé upload. The platform. Under Meta's employment rules there's no age, gender or ZIP targeting, so the ad's copy does the selecting and the conversion rate is a measure of how well it did (the rules); a board's searchers pre-selected themselves by typing the title, which is why board apply rates measure a different thing. Budget is not on the list, and the reason is on the budget page: raising spend on a campaign converting under 10% buys more of the same expensive applicants.
When a low conversion rate is the right answer
Three cases. A campaign for a licensed role with a hard knockout question first will show a low click-to-application rate by design — the unqualified leave at question one — and a high applicant-to-interview rate to match; judge it on the second number. A campaign whose ad tells the whole truth about a hard job (nights, outdoors, on call) will convert lower than one that doesn't, and its hires will stay; the 90-day exit is where the dishonest ad's conversion rate gets paid back, and that story is on the first-90-days page. And a job-board posting at 6% is doing what boards do for a title-searched role; the mistake is comparing it to a social campaign's 25% for a caregiver, not the 6% itself. Which channel fits which role is on the channel guide.
Frequently asked questions
What is a good candidate conversion rate?
For click-to-application on a social recruiting ad, above 10% is the floor and above 20% is good for hourly roles; in our 2026 benchmark, campaigns under 5% ran a median $53.77 per applicant, 10–20% $11.11, 20–35% $4.41 and over 35% $1.61. The ceiling depends on the role: caregivers converted at 31%, warehouse at 20%, registered nurses at 11%, CDL drivers at 8%. For pay-for-performance job-board ads, Appcast's 2025 report put the 2024 apply rate at 6.1%. Cost per applicant is not cost per hire.
What is the difference between apply rate and application completion rate?
Apply rate (click-to-application) is completed applications divided by ad clicks, and measures the whole gap between the ad and a finished application. Application completion rate is completed divided by started, and isolates the form: a 40% completion rate means six in ten people who began the form abandoned it. A third rate, applicant-to-interview, is interviews divided by applications and measures screening and follow-up. The benchmark's bands and Appcast's figure are both click-to-application.
Why does conversion rate matter more than click-through rate?
Because it explained more of the cost. Across 891 campaigns, click-to-application conversion explained 70% of the variation in cost per applicant, click-through rate 30%, and CPM 18%. Click-through decides how many people arrive; conversion decides how many of them become applicants, and a long form loses most of them after the click has already been paid for. Campaigns converting under 10% took 41% of all budget and returned 11% of all applicants.
How do you increase candidate conversion rate?
Shorten the form to three questions and a phone number inside the platform — no account, no résumé, no redirect; put the wage, the shift and the site in the first line of the ad so the click comes from someone who already accepted them; put the knockout question first; and reply the same day. Two residential contractors in our earlier analysis ran the same sales ads at 28.3% and 4.3% conversion — $4.63 versus $27.77 per applicant — and the difference was the form.
What is the apply rate benchmark for job boards?
Appcast's 2025 Recruitment Marketing Benchmark Report, analyzing 2024 pay-for-performance job ads from more than 1,300 US employers (379 million clicks, over 30 million applies), reported apply rates "ending the year at 6.1%," with technology highest at 6.41%. That's a click landing on an employer's own application, usually a career site, from a person who searched — a different funnel from a social ad with an in-platform form, which is why our bands run higher. Both figures are what they are; comparing them is only useful if you name the funnel.
Does conversion rate vary by role?
Yes, and the pattern is the credential. In the benchmark: caregiver 31%, customer service 25%, LPN and sales 21%, warehouse 20%, CNA 18%, technician and management 16%, skilled trades 15%, registered nurse 11%, allied health 10%, CDL driver and teacher 8%, therapy 5%. Judge a campaign against its own family; a nurse campaign at 12% is above its family's median while a caregiver campaign at 12% is far below.
Can a high conversion rate be bad?
It can be misleading. A form with no knockout question converts high and sends unqualified applicants to a manager who then stops calling anyone; the applicant-to-interview rate collapses and the hiring team blames the channel. A high click-to-application rate paired with a low applicant-to-interview rate usually means the qualification question belongs in the form, not the phone screen. Read the three rates together.
How is this different from the recruiting analytics page?
That page is the six-metric framework — what to measure weekly, the frequency threshold, reporting by campaign rather than in aggregate — with the apply-rate bands as one of six. This page is the deep dive on the one metric: the three definitions, the bands in full, the rate by role family and sector, the third-party comparator, what moves it, and two calculators that place your campaign.
What is a good application conversion rate?
It depends which rate you mean, and the three get confused constantly. If you mean clicks to completed applications on a social job ad, the bands above are the reference and the median sits well above what job-board traffic converts at. If you mean visitors to applicants on a careers page, or applicants to hires, those are different numbers with different causes. Pick one definition, write it down, and compare only against itself over time.
Why is my application conversion rate low?
Four causes, in the order they usually apply: the form is too long or asks for a resume upload on a phone; the first line of the ad promised something the landing page does not repeat; the pool is wrong for the role, which shows up as clicks from people who were never going to qualify; and the platform is sending cheap clicks rather than relevant ones. The first is the most common and the cheapest to fix.
Find out which band you're in
Bring one campaign's clicks and applications. We'll place it on the band and the role family, show you the campaigns closest to yours from the benchmark, and tell you whether the form or the first line is the lever.
Book a DemoBoostpoint figures come from the 2026 Social Job Advertising Benchmark — 891 campaigns and 1,334 campaign-months across 15 role families, segments with fewer than 3 employers or 15 campaign-months suppressed: conversion explaining 70% of cost variation, click-through 30%, CPM 18%; apply-rate bands under 5% $53.77 (18% of budget, 3% of applicants), 5–10% $23.13 (24%, 8%), 10–20% $11.11 (32%, 23%), 20–35% $4.41 (21%, 38%), over 35% $1.61 (6%, 28%); role-family apply rates, click-through rates and medians as listed (caregiver 31% / 2.32% / $3.76 through therapy 5% / 0.84% / $74.62); sector apply rates Retail/Corporate 26%, Skilled Trades & Field Service 18%, Healthcare & Senior Living 16%, Transportation & Logistics 13%, Behavioral & Education 10%. One role family's figures are not published on this page. Earlier campaign-level analyses (a different methodology; the benchmark is canonical where they conflict): healthcare completion by setting senior living 22.1%, home care 21.6%, hospital 6.0%; by role caregiver 31.3%, LPN 18.4%, CNA 17.4%, RN 12.4%, therapy 5.4%; trades completion 3.5%–18.6% across contractors; residential home improvement 28.3% / $4.63 vs 4.3% / $27.77; click-to-apply manufacturing 17.2%, trucking 16.8%, trades 9.1%. Appcast, 2025 Recruitment Marketing Benchmark Report, February 11, 2025 — Appcast's figures for pay-for-performance job ads. Indeed, "Optimize jobs from your career site or ATS," May 11, 2026 — Indeed's claims. The calculators compute on the reader's inputs. Cost per applicant is not cost per hire; we do not track hires and publish no cost-per-hire figure. A sample of Boostpoint campaigns, not an industry-wide study.