
Recruiting Analytics: The Six Metrics That Change a Decision, and the Dashboard Numbers That Don't
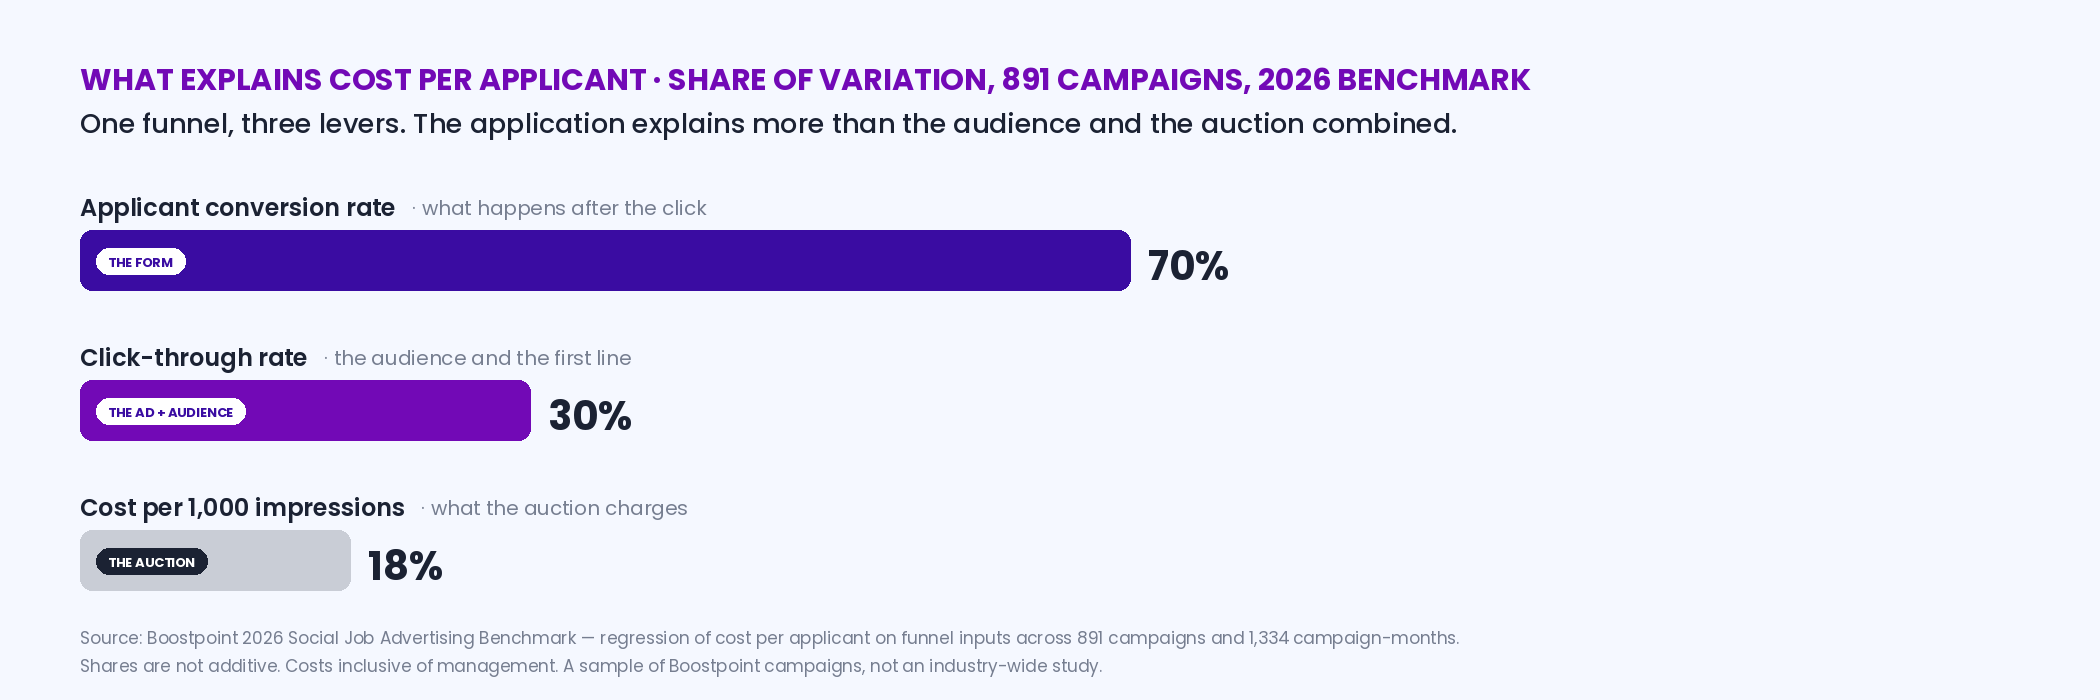
Recruiting analytics is worth doing only where a number changes what you do next. Across the 891 campaigns in Boostpoint's 2026 Social Job Advertising Benchmark, one number explained 70% of the variation in cost per applicant — the apply rate, what happens after the click — while click-through (the audience and the ad) explained 30% and CPM, what the auction charges, 18%. One threshold, a frequency of 2.5, told you when to act. And one cut of the data, campaign by campaign, showed the top 10% of campaigns producing 57% of all applicants on 22% of the budget. Six metrics carry that; the rest is a dashboard.
Source: Boostpoint 2026 Social Job Advertising Benchmark — 891 Boostpoint-managed campaigns on Meta (1,334 campaign-months), 2026; costs are what advertisers paid for advertising only.
A note on who's writing this
Boostpoint runs social media job ads and publishes the campaign data behind them, so this page is written from the advertising side of the funnel — the part that produces applicants — and it says so where the line is. The metrics that live in your applicant tracking system after the application (time to fill, offer acceptance, retention, quality of hire) are defined here because the glossary entries this page replaces defined them, and because a recruiting dashboard without them is half a dashboard. But we don't measure them and we won't invent benchmarks for them. In particular: we publish cost per applicant, never cost per hire, because we don't track hires, and the formula for cost per hire needs your ATS, not our ad data. Turning those metrics into a return, a payback period and a recruiting cost ratio is arithmetic rather than analytics, and it is laid out on the recruiting ROI calculator.
Most recruiting dashboards report what happened. Analytics says what to do.
A dashboard with impressions, reach, clicks, click-through rate, cost per click, applications, cost per application, and spend is complete and useless, because it treats eight numbers as eight facts when they are one funnel with three levers. When we regressed cost per applicant across the 891 campaigns in the 2026 benchmark against the funnel's inputs, the result was lopsided: applicant conversion — the share of clicks that became applications — explained 70% of the variation; click-through rate, which is the audience and the ad together, explained 30%; and cost per thousand impressions, which is what the auction charges, explained 18%. That ordering is the whole discipline. If cost per applicant is high, the analytics question is not "how do we lower CPM" — the auction is the smallest lever — but "what happened to the people who clicked."
None of this works unless the instrumentation is in place before the first dollar, which is a separate job. How to measure recruitment marketing covers the three things to wire up first and the cadence to read them on.
The six metrics, and what each one decides
| Metric | Formula | The decision it changes | Reference point | Where it lives |
|---|---|---|---|---|
| 1. Apply rate (applicant conversion) | Applications ÷ clicks | Whether to fix the form before anything else | Under 5% → $53.77 per applicant; over 35% → $1.61 (2026 benchmark). Explains 70% of cost variation. | Ad platform + form |
| 2. Frequency | Impressions ÷ people reached | When to rotate creative, pause, or move budget | Median $7.85 per applicant under 1.5; $26.78 over 4.0. Act when it passes 2.5. | Ad platform |
| 3. Cost per applicant | Spend ÷ applications | Which campaigns get next month's budget | Median campaign $13.88; volume-weighted average $8.02. Compare by campaign, never in aggregate. | Ad platform |
| 4. Applicants per campaign-month | Applications ÷ campaign-months | Whether the volume is there at all, before cost is discussed | Median 20 on a $334 budget, 6,061 people reached. | Ad platform |
| 5. Contact-to-interview time | Hours from application to first human contact; days to interview | Whether applicants are being lost after they apply | No benchmark published; our practice is a text within the hour and an interview inside the week. | Your ATS or phone log |
| 6. Click-through rate | Clicks ÷ impressions | Whether the audience and first line are right — after 1 and 2 are fixed | Falls from 1.69% to 0.94% as frequency rises across the range. Explains 30% of cost variation. | Ad platform |
| Context: time to fill | Days from requisition open to accepted offer | Staffing plans and the cost of the vacancy | Third-party: NSI's 2026 report puts RN time-to-fill at 78 days. We publish none. | Your ATS |
| Context: cost per hire | (Internal + external recruiting costs) ÷ hires | Budget allocation across channels — once you have hires data | Third-party: SHRM put the average at "nearly $4,700" (April 2022). We do not compute it from ad data and publish no figure. | Your finance + ATS |
| Context: offer acceptance, 90-day retention, quality of hire | Offers accepted ÷ extended; hires still employed at 90 days ÷ hires; performance rating of hires | Whether the pipeline is producing the right people, not just people | Yours to set; no Boostpoint benchmark. | Your ATS + HRIS |
Numbers one through four are the ones the ad platform gives you and the ones that decide next week's spend. Five is the metric almost nobody tracks and the one that quietly wastes the other four: an applicant who cost $8.02 to produce and is not contacted for four days was, in practice, free to a competitor. Six is real but comes after one and two, because a better click-through rate on a campaign that loses 90% of its clicks at the form is a faster way to pay $53.77. The context rows are yours; we list them so the dashboard is whole.
Interactive
Funnel diagnostic — paste one campaign's numbers, find the lever
Nothing is stored or sent — this runs in your browser. Defaults: the 2026 benchmark's median campaign-month ($334, 6,061 people reached, 20 applicants) with illustrative impressions and clicks — replace all five with yours. Reads each metric against the benchmark's thresholds and names the lever.
Thresholds from the 2026 benchmark: apply-rate bands under 5% / 5–10% / 10–20% / 20–35% / over 35%; frequency rule 2.5; click-through reference 1.69% (low frequency) to 0.94% (high). Your figures are yours; the benchmark's are medians across all sectors, advertising costs only, so they compare directly with the cost per applicant your ad platform reports. Cost per applicant is not cost per hire; this tool computes no hire figure.
Report by campaign, never in aggregate: the concentration finding
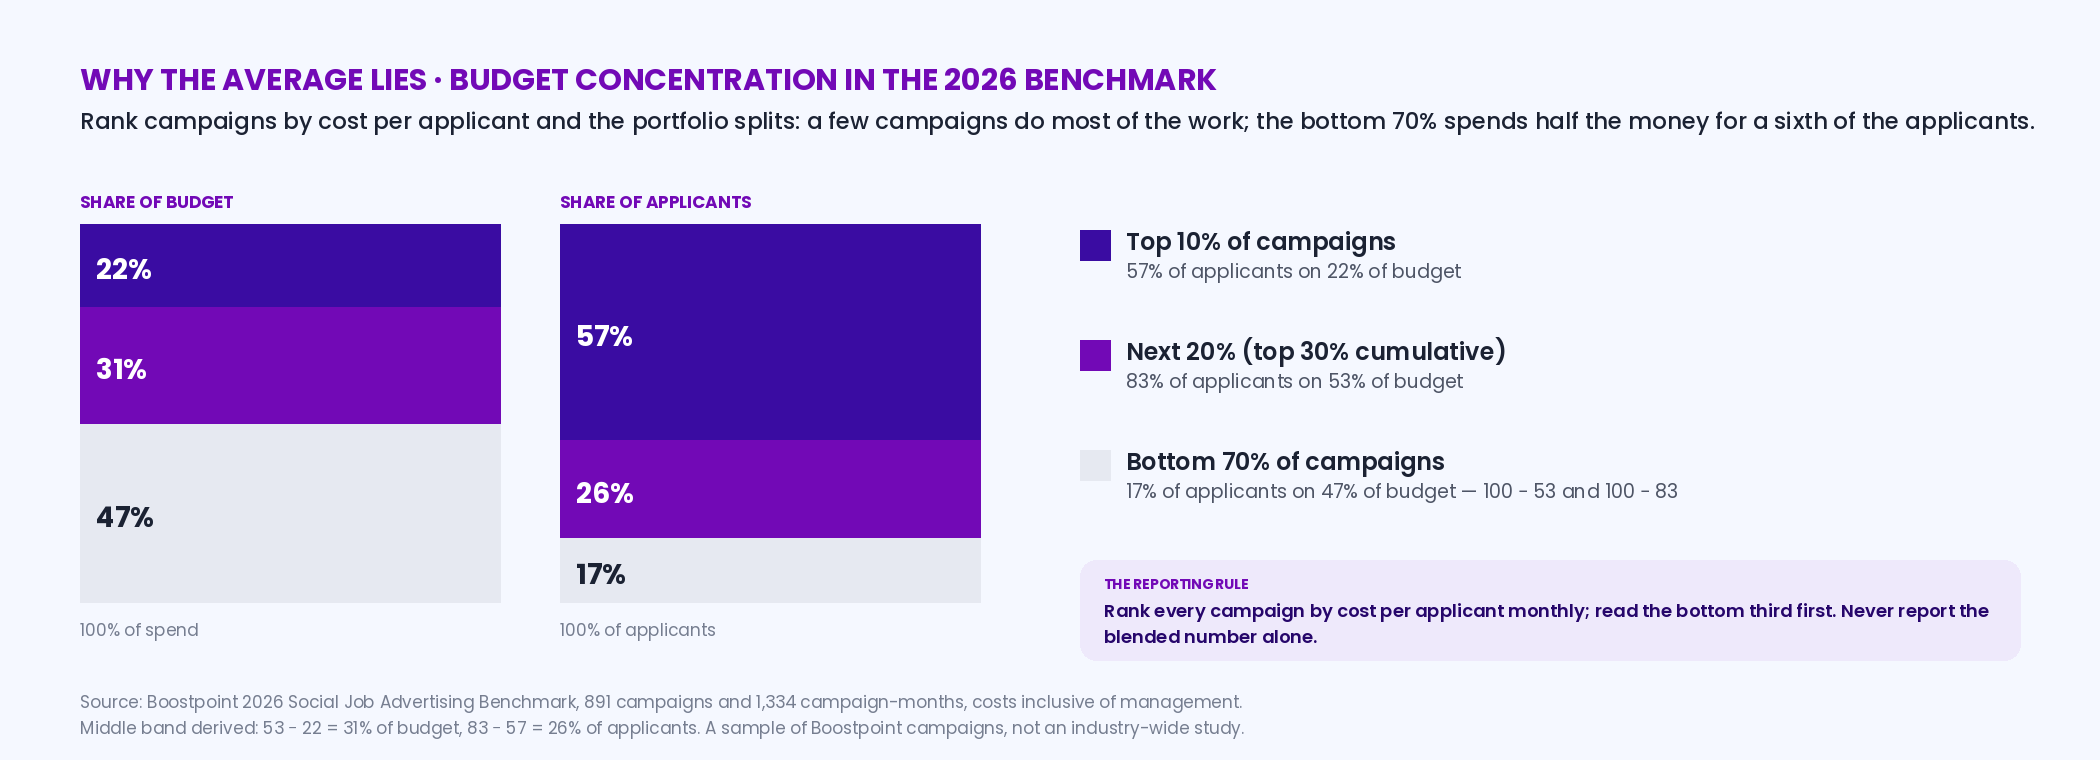
The single most useful thing recruiting analytics can do is refuse to average. In the 2026 benchmark, the top 10% of campaigns produced 57% of all applicants on 22% of the budget; the top 30% produced 83% on 53%. Read the other way: the bottom 70% of campaigns spent 47% of the money for 17% of the applicants. An aggregate cost per applicant hides that completely — it reports one blended number that no actual campaign produced — and a dashboard built on it will tell you the program is fine while half the budget does nothing. The reporting rule that follows is simple: rank every campaign by cost per applicant each month, look at the bottom third first, and ask the funnel question of each one. Most of the bottom third will turn out to have an apply rate under 10% or a frequency past 3.0, and both are fixable in a week.
The apply-rate bands: where the budget went and what came back
| Apply rate (applications ÷ clicks) | Median cost per applicant | Share of budget | Share of applicants |
|---|---|---|---|
| Under 5% | $53.77 | 18% | 3% |
| 5–10% | $23.13 | 24% | 8% |
| 10–20% | $11.11 | 32% | 23% |
| 20–35% | $4.41 | 21% | 38% |
| Over 35% | $1.61 | 6% | 28% |
Source: Boostpoint 2026 Social Job Advertising Benchmark — 891 Boostpoint-managed campaigns on Meta (1,334 campaign-months), 2026; costs are what advertisers paid for advertising only.
Across the first two rows, 41% of all budget ran in campaigns converting under 10% of clicks and returned 11% of all applicants (the bands are rounded separately). That is the single line a recruiting analytics report should lead with, because it names both the waste and the fix. The fix is not analytical; it is the form — under a minute, on a phone, three questions, no résumé — and what a good ad does before the form is on what makes a good job ad. Analytics' job is to find which campaigns are in the top two rows and say so by name.
Frequency: the one metric with a threshold, and a weekly ritual
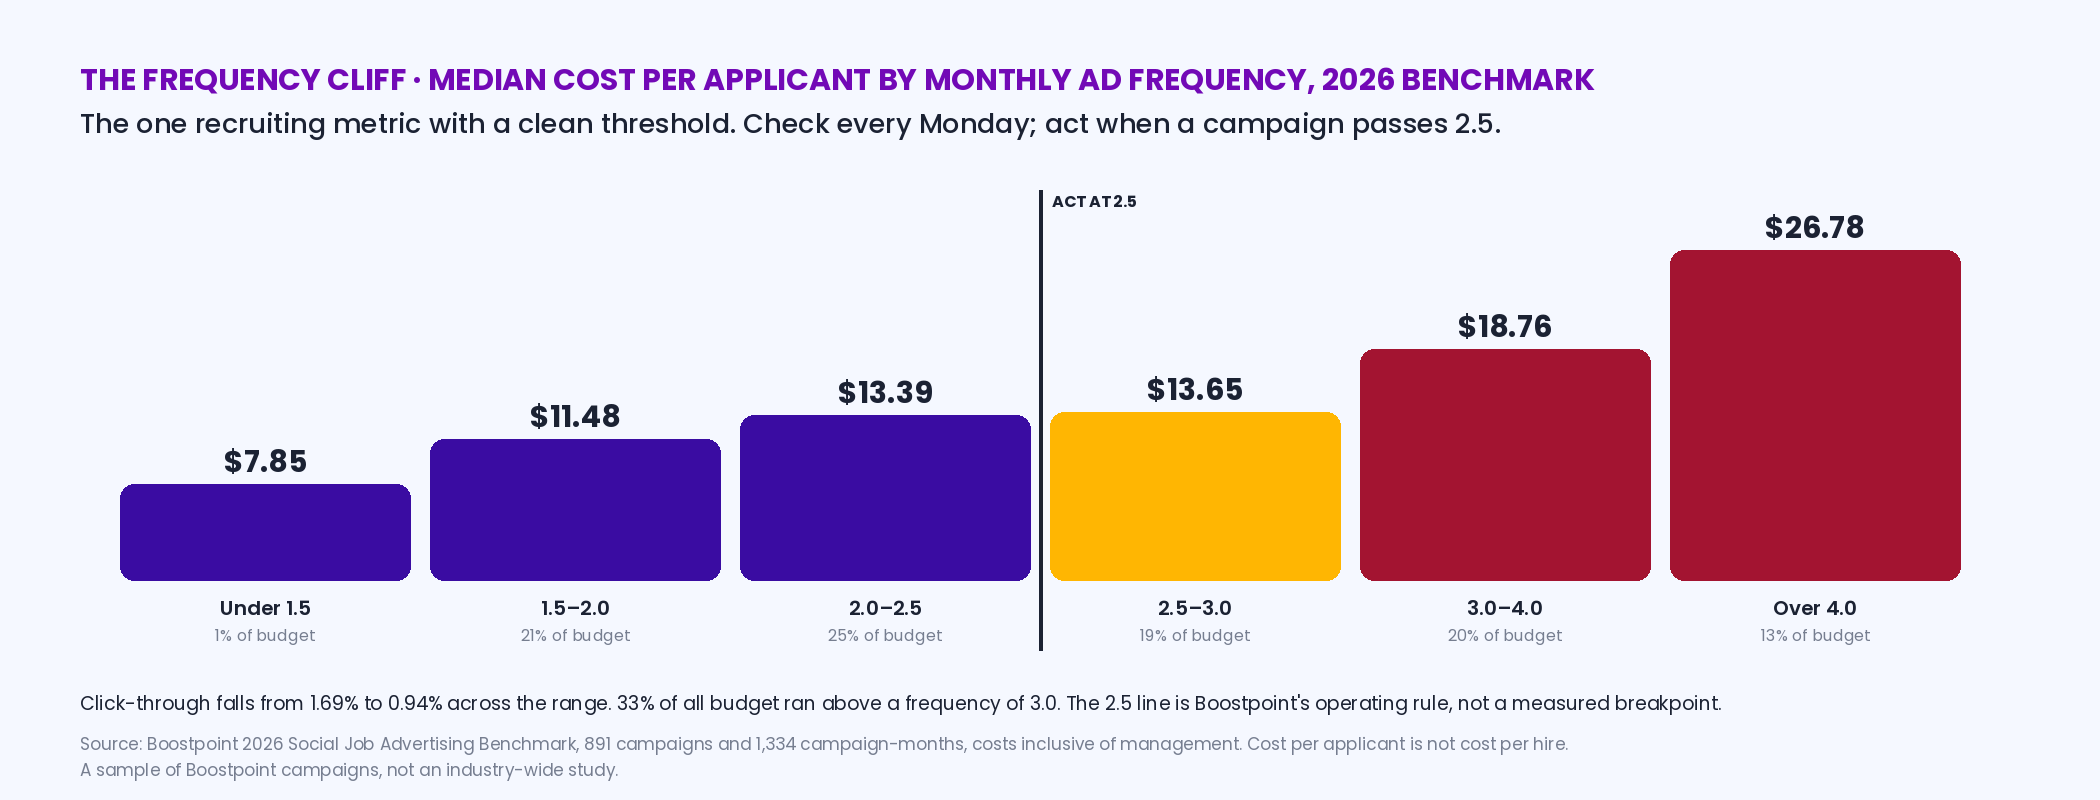
Frequency is impressions divided by people reached — how many times, on average, the same person has seen the ad. It is the only metric on this page with a clean operating threshold, because the benchmark's cliff is steep and consistent. Median cost per applicant was $7.85 below a frequency of 1.5; $11.48 at 1.5–2.0; $13.39 at 2.0–2.5; $13.65 at 2.5–3.0; $18.76 at 3.0–4.0; and $26.78 above 4.0. Click-through fell from 1.69% to 0.94% across that range. And 33% of all budget ran above 3.0. The ritual: every Monday, sort live campaigns by frequency; anything past 2.5 gets a new first line or new footage, a pause, or its budget moved to a campaign with a date on it — the event-driven structure that ran at a median $8.02. Nothing else in recruiting analytics is this mechanical, which is why it is the one rule worth automating.
Interactive
Recruiting analytics dashboard builder — four tiles per audience
Nothing is stored or sent — this runs in your browser. Pick who reads the report; the tiles are the four numbers that person can act on, with the cadence and the threshold.
Boostpoint's practice for what each audience can act on, not a product screenshot. Thresholds are the 2026 benchmark's; ATS-side cadences and targets are yours to set. No cost-per-hire tile: we don't compute it from ad data, and if you build one, it needs hires from your ATS, not applicants from ours.
Recruiting ROI, honestly
The formula is the same as any ROI: (value returned − cost) ÷ cost. The problem in recruiting is the numerator. The cost side is knowable — ad spend, software subscriptions and agency fees, recruiter time, tools, the three glossary entries this page replaces listed them — but the value of a hire is a retention curve and a productivity estimate, not a number a dashboard produces. What we can say with our data is narrower and more useful: the cost side of recruiting advertising is fully measurable per campaign (cost per applicant, from advertising spend), the biggest driver of that cost is the form (70%), and about two-fifths of the budget in the benchmark is doing very little (41% under a 10% apply rate). An ROI calculation that starts from a blended cost per applicant and a guessed value per hire will be precise and wrong; a report that ranks campaigns by cost per applicant, flags the frequency cliff, and tracks hours-to-contact will change what you spend next month. If you want a cost-per-hire figure, take hires from your ATS and costs from finance, and treat SHRM's "nearly $4,700" (2022) as a reference for what other employers report, not as a target — the spread by role and market is wider than any average.
Time to fill and the ATS-side metrics
Time to fill is days from requisition open to accepted offer; time to hire, which is often confused with it, runs from the candidate's first contact to acceptance. Both are ATS metrics, both matter, and neither is something we measure. The one third-party reference we'll cite is NSI's 2026 report, which puts average RN time-to-fill at 78 days — and the reason it belongs on an analytics page is that it converts the metrics above into money: every day a position is empty has a cost, so a campaign that cuts hours-to-contact from four days to one is worth more than a campaign that cuts cost per applicant by a dollar. Offer acceptance rate, 90-day retention, and quality of hire close the loop on whether the applicants the front of the funnel produced were the right ones; set your own targets, report them beside the six above, and resist the urge to blame the ad for a retention problem the schedule caused. If a role has to be filled this week rather than measured this quarter, the triage is on how to fill open positions fast.
A recruiting dashboard describes. Recruiting analytics decides — six numbers, one threshold, and a refusal to average.
If you need somewhere to put the numbers while the hiring is actually happening, our recruitment tracker template builds a CSV in your browser with a days-in-stage column, which is the one measure a dashboard almost never surfaces.
Recruitment metrics and KPIs: which numbers are which
The words are used interchangeably and should not be. A recruitment metric is anything you can count. A recruitment KPI is the small subset you have agreed to be held to, with a target attached and an owner who can move it. Most teams track thirty metrics and have no KPIs, which is why the monthly report is long and nothing changes after it.
A workable set is five or six. The test for promoting a metric to a KPI is simple: if the number moves in the wrong direction, does somebody know what to do on Monday? If not, it is a metric and it belongs in an appendix.
| KPI | Definition | What it decides | Owner |
|---|---|---|---|
| Cost per applicant | Total advertising spend divided by applications received | Whether the channel is working and what next month’s budget buys | Whoever runs the advertising |
| Apply rate | Completed applications divided by clicks | Whether the form and the offer are the problem, rather than the ad | Recruiting operations |
| Time to first contact | Minutes between an application landing and a human or automated reply | How many of the applicants you paid for you actually keep | The recruiting team |
| Time to fill | Days from requisition approval to accepted offer | Whether the process or the pipeline is the constraint | Recruiter and hiring manager jointly |
| Offer acceptance rate | Offers accepted divided by offers made | Whether pay and the candidate experience are competitive | Hiring manager and compensation |
| 90-day retention | Share of hires still employed at 90 days | Whether you are solving hiring or repeating it | Operations, not recruiting |
Two rules keep a KPI set honest. First, every KPI needs a denominator that someone can audit; “quality of hire” fails this test in most organizations and should stay a metric until it does not. Second, a KPI with no target is a number on a slide. Set the target from your own trailing quarter rather than from an industry figure, then check it against the industry figure to see whether you are aiming at the right thing.
For the benchmark numbers themselves — what a cost per applicant, an apply rate or a time to fill actually looks like across employers and roles — see our hiring metrics benchmarks. This page is how to measure; that page is what the numbers are.
Recruiting report template
A useful recruiting report is one page with three blocks: a source of hire report, a campaign table ranked by cost per applicant, and your recruitment KPIs against target. Copy the structure below into a spreadsheet and fill it monthly. Every column is something you can count; nothing needs a vendor.
Block 1: Source of hire report
| Source | Spend | Applicants | Cost per applicant | Contacted | Interviewed | Hires | Still employed at 90 days |
|---|---|---|---|---|---|---|---|
| [Social ads] | [$] | [#] | [spend ÷ applicants] | [#] | [#] | [#] | [#] |
| [Job board] | [$] | [#] | [ ] | [#] | [#] | [#] | [#] |
| [Referrals] | [bonuses paid] | [#] | [ ] | [#] | [#] | [#] | [#] |
| [Agency] | [fees] | [#] | [ ] | [#] | [#] | [#] | [#] |
| [Walk-in / careers page] | [$] | [#] | [ ] | [#] | [#] | [#] | [#] |
Source of hire only works if the source is captured at application, not reconstructed later. Tag each ad link or form with its source, and make “source” a required field in your ATS. The last two columns come from your ATS and HRIS; the advertising columns come from the ad platform. Divide spend by hires yourself only when you have real hires; an applicant figure is not a hire figure.
Block 2: Campaign table
One row per campaign, sorted by cost per applicant, with apply rate and frequency beside it. Highlight the bottom third, any apply rate under 10% and any frequency past 2.5. Those are the rows to act on this month, for the reasons set out above.
Block 3: Recruitment KPI template
| KPI | This month | Target | Trailing quarter | Owner | Action if off target |
|---|---|---|---|---|---|
| Cost per applicant | [ ] | [ ] | [ ] | [name] | [ ] |
| Apply rate | [ ] | [ ] | [ ] | [name] | [ ] |
| Time to first contact | [ ] | [ ] | [ ] | [name] | [ ] |
| Time to fill | [ ] | [ ] | [ ] | [name] | [ ] |
| Offer acceptance rate | [ ] | [ ] | [ ] | [name] | [ ] |
| 90-day retention | [ ] | [ ] | [ ] | [name] | [ ] |
End the report with three lines: what changed, why, and what you will do next month. For a working file that tracks each candidate by stage, use our recruitment tracker template.
Recruiter workload: how many hires per recruiter
There is no reliable standard number of hires per recruiter, and we do not publish one. Figures quoted online differ widely by role type and by how “recruiter” is defined. A recruiter filling a dozen frontline openings a week and one running a single specialist search are doing different jobs. The better approach is to work out your own capacity from hours.
- Hours per hire. Time the work for one hire: reviewing applicants, first contact, screening calls, interviews, references and the offer. Use your own records, not a guess.
- Hours available. The hours a recruiter actually spends on candidate work each week, after meetings, reporting and admin.
- Capacity. Hours available divided by hours per hire gives hires per week at a sustainable pace.
An illustration with stated assumptions: if a recruiter spends 24 hours a week on candidate work and a frontline hire takes 6 hours, capacity is 4 hires a week. Double the hours per hire and capacity halves. For frontline hiring, the clearest signal is whether workload is slowing first contact. If time to first contact is rising as openings rise, the recruiter is over capacity, whatever the headline count says. At that point the options are to cut hours per hire (a shorter form, automated first replies, scheduled group interviews), add capacity, or push some screening to hiring managers.
Report recruiter workload as open requisitions and active candidates per recruiter alongside time to first contact, so the trend is visible before applicants start going cold. How to divide the work between a central team, site recruiters and hiring managers is covered in recruiting team structure.
Frequently asked questions
Recruitment analytics software: what it can see, and what it cannot
Recruiting analytics tools fall into two families, and neither sees the whole funnel. Advertising-side tools know impressions, clicks, apply rate and cost per applicant, because those events happen in the ad platform. ATS-side tools know stages, time in stage, offers and hires, because those happen after the application lands. The join between them — which ad produced the person who is now a good employee — is the number everybody wants and almost nobody has.
- Before buying, check which side the tool sits on, and whether it can receive the other side at all. A dashboard that reports beautifully on one half is a half.
- Insist on campaign-level reporting. Aggregated recruiting dashboards hide the thing you would act on: it is normal for a minority of campaigns to produce most of the applicants, and an average conceals exactly that.
- Be skeptical of quality-of-hire modules. Quality of hire is defined differently by every vendor, and a number you cannot reproduce by hand is not a metric.
- Ask what it does with roles that get no applicants. Tools built for corporate funnels often have nothing to say about an empty one, which is the frontline problem.
For most frontline employers the useful version of this is not software at all: a monthly sheet with applicants, cost per applicant and apply rate by campaign, next to hires by role, will outperform a dashboard nobody opens. What each metric decides, and the four we refuse to publish a number for, are on hiring metrics benchmarks.
What is recruiting analytics?
The use of recruiting data to change a decision — which campaign gets budget, which form gets fixed, which applicant gets called first — as opposed to a dashboard that reports what happened. In practice it is a small number of metrics with thresholds: apply rate, frequency, cost per applicant, applicants per campaign-month, hours to contact, and click-through rate on the advertising side; time to fill, offer acceptance, retention, and quality of hire on the ATS side.
What are the most important recruiting metrics?
On the advertising side, apply rate first: across 891 campaigns in our 2026 benchmark it explained 70% of the variation in cost per applicant, with audience (click-through) at 30% and CPM at 18%. Then frequency, which has a threshold (act at 2.5), cost per applicant by campaign, and hours to first contact. On the ATS side, time to fill, offer acceptance, and 90-day retention.
What is a good apply rate for recruitment ads?
In the 2026 benchmark, campaigns converting under 5% of clicks paid a median $53.77 per applicant; 5–10%, $23.13; 10–20%, $11.11; 20–35%, $4.41; over 35%, $1.61. Above 20% is where cost falls sharply, and the difference is almost always the form — length, résumé upload, account creation — not the audience.
What should a recruitment analytics dashboard include?
Four tiles per audience, each with a cadence and a threshold: for an owner, cost per applicant by campaign, applicants per month, hours to contact, and time to fill; for a recruiter, apply rate, frequency, hours to contact, and interviews scheduled. The builder on this page lays them out. Leave off impressions and CPM as headline tiles — they are context, not decisions.
How do you calculate cost per hire?
Total internal and external recruiting costs divided by hires in the period — ad spend, agency fees, recruiter time, tools, referral bonuses over the number of people who started. It needs hires from your ATS and costs from finance. We publish cost per applicant, not cost per hire, because we don't track hires; SHRM reported an average of "nearly $4,700" in 2022, with wide variation by role.
How do you measure recruiting ROI?
(Value returned − recruiting cost) ÷ recruiting cost. The cost is measurable; the value of a hire is an estimate built from retention and productivity, so treat any ROI figure as an assumption made visible. The measurable, decision-changing version is per-campaign cost per applicant ranked monthly, with the apply-rate and frequency levers attached to each.
What is ad frequency and why does it matter in recruiting?
Impressions divided by people reached — how many times the same person has seen the ad. In the 2026 benchmark, median cost per applicant rose from $7.85 under a frequency of 1.5 to $26.78 above 4.0, and click-through fell from 1.69% to 0.94%; 33% of all budget ran above 3.0. The rule: check weekly and act at 2.5 by rotating creative, pausing, or moving budget.
Why shouldn't you report an average cost per applicant?
Because no campaign produced it. In our data the top 10% of campaigns produced 57% of applicants on 22% of budget, and the bottom 70% spent 47% of the budget for 17% of the applicants. An average hides that; a ranked list by campaign shows exactly which ones to fix and which to fund.
What does recruitment analytics software do?
It reports either the advertising side of the funnel (impressions, clicks, apply rate, cost per applicant) or the ATS side (stages, time in stage, offers, hires). Few tools do both, and the join between them is the number most employers actually want.
Do I need recruiting analytics software?
For most frontline employers, no. A monthly sheet showing applicants, cost per applicant and apply rate by campaign, next to hires by role, beats a dashboard nobody opens. Software earns its place once several people need the same view.
What is the difference between recruitment metrics and recruitment KPIs?
A metric is anything you can count; a KPI is the handful you have agreed to be judged on, each with a target and an owner. The practical test for promoting a metric to a KPI is whether somebody knows what to do differently when it moves the wrong way. Most teams track far too many metrics and have no KPIs at all.
What are the most important recruiting KPIs?
For frontline hiring, six carry almost all the decision weight: cost per applicant, apply rate, time to first contact, time to fill, offer acceptance rate and 90-day retention. The first three tell you whether the advertising and the application are working, and the last three tell you whether the process and the job are.
How do I set targets for recruitment KPIs?
Start from your own trailing quarter rather than an industry average, because your roles, your pay and your locations set the baseline. Then compare that figure with published benchmarks to check you are aiming at the right thing — a cost per applicant that looks poor against a blended average may be perfectly normal for the specific role family you hire.
What are recruiting funnel metrics?
The rates between stages rather than the counts within them: reach to click, click to applicant, applicant to contacted, contacted to scheduled, scheduled to attended, attended to offer, offer to start. The counts tell you how busy you were; the rates tell you where the funnel leaks. The six metrics above are the ones that decide something, and the three stages almost nobody measures — contacted, scheduled, attended — are where frontline funnels lose the most people.
Which recruiting funnel metric should you fix first?
The earliest stage with a rate below what you would accept, because every downstream improvement is multiplied by it. In practice that is almost always applicant-to-contacted: a pipeline where half the applicants are never reached cannot be rescued by a better interview process, and it is usually a speed problem rather than a capacity one.
What should a recruiting report include?
A monthly recruiting report should include a source of hire table (spend, applicants, cost per applicant, contacted, interviewed, hires and 90-day retention by source), a campaign table ranked by cost per applicant with apply rate and frequency, and a short KPI table showing this month against target and the trailing quarter. Finish with what changed, why, and next month's actions.
What is a source of hire report?
A source of hire report shows where your hires came from, such as social ads, job boards, referrals, agencies or walk-ins, with the spend and the funnel for each source. It needs the source captured at application and a hires count from your ATS. Its job is to show which sources produce people who start and stay, not just applicants.
How many hires should a recruiter make per month?
There is no reliable standard, because workload depends on the role and the process. Work it out from your own numbers: divide the hours a recruiter spends on candidate work by the hours one hire takes. At 24 hours a week and 6 hours per hire, that is 4 hires a week, or 16 in a four-week month. Watch time to first contact; if it rises, the recruiter is over capacity.
What should a recruiting metrics dashboard show?
It should show the funnel by campaign, in the order the levers matter: cost per applicant, apply rate, frequency and click-through rate from the ad platform, then hours to contact, applicants per hire and time to fill from your ATS. In Boostpoint's 2026 benchmark the median campaign cost $13.88 per applicant, apply rate explained 70% of the variation in cost per applicant, and median cost was $18.76 at a frequency of 3.0 to 4.0 and $26.78 above 4.0. Applicant-to-hire comes from your ATS; we do not measure it.
See your campaigns the way the benchmark does
We report every campaign by cost per applicant, flag the frequency cliff before it costs you, and show you which of the three levers is yours to pull — with 891 campaigns to compare against.
Book a DemoBoostpoint figures come from the 2026 Social Job Advertising Benchmark — 891 campaigns and 1,334 campaign-months: applicant conversion explains 70% of variation in cost per applicant, click-through rate 30%, CPM 18% (shares not additive); apply-rate bands under 5% $53.77 (18% of budget, 3% of applicants), 5–10% $23.13 (24%, 8%), 10–20% $11.11 (32%, 23%), 20–35% $4.41 (21%, 38%), over 35% $1.61 (6%, 28%); 41% of budget in campaigns converting under 10% returned 11% of applicants; frequency bands under 1.5 $7.85, 1.5–2.0 $11.48, 2.0–2.5 $13.39, 2.5–3.0 $13.65, 3.0–4.0 $18.76, over 4.0 $26.78, 33% of budget above 3.0, click-through 1.69% to 0.94%; top 10% of campaigns 57% of applicants on 22% of budget, top 30% 83% on 53%; median campaign $13.88, volume-weighted average $8.02; median campaign-month $334, 20 applicants, 6,061 reached; event-driven median $8.02. Third-party: SHRM (April 11, 2022) average cost per hire "nearly $4,700"; NSI Nursing Solutions 2026 report, RN time-to-fill 78 days. Cost per applicant is not cost per hire; we do not track hires and publish no cost-per-hire or ROI figure. The metric ranking, the 2.5 rule, dashboard tiles, and contact-time practice are Boostpoint's practice, not measured results. A sample of Boostpoint campaigns, not an industry-wide study.