
Mass Hiring: How to Staff a Surge Without a Surge Budget
To hire 50 people for a new facility quickly, run the opening as a dated event: one campaign per role family, the opening date and headcount in the ad, a one-minute application and same-day contact. In Boostpoint’s 2026 Social Job Advertising Benchmark, event-driven campaigns had a median of $8.02 per applicant, the cheapest structure measured. Mass hiring rarely requires mass budget. The median social recruiting campaign in Boostpoint's 2026 Social Job Advertising Benchmark ran on $334 a month, and campaigns built around a specific event or deadline produced applicants at a median of $8.02 — the cheapest structure we measured. What determines output isn't spend. It's what happens after the click.
Peak season is coming, a new location is opening, or a contract just landed and you need forty people by a date that isn't moving. The instinct is to treat mass hiring as a spending problem: blast every channel, raise every budget, hope volume follows. Our campaign data says the physics work differently — and that the employers who staff surges cheapest are doing something structural, not something expensive.
One note before the numbers: Boostpoint runs social job advertising campaigns, so we're not neutral about the advertising route. Where temp agencies are the better tool — and for some surges they clearly are — this page says so, with their fee figures included.
What mass hiring actually costs
Across the 891 campaigns and 1,334 campaign-months in our 2026 Social Job Advertising Benchmark, the volume-weighted average cost per applicant was $8.02 — lower than the $13.88 median campaign, because applicant volume concentrates in exactly the high-throughput frontline roles mass hiring targets. Warehouse and production applicants blended to $4.44. Customer service blended to $2.98. Caregivers, $3.87.
And the budgets behind those numbers are smaller than most people guess:
| Measure | Value |
|---|---|
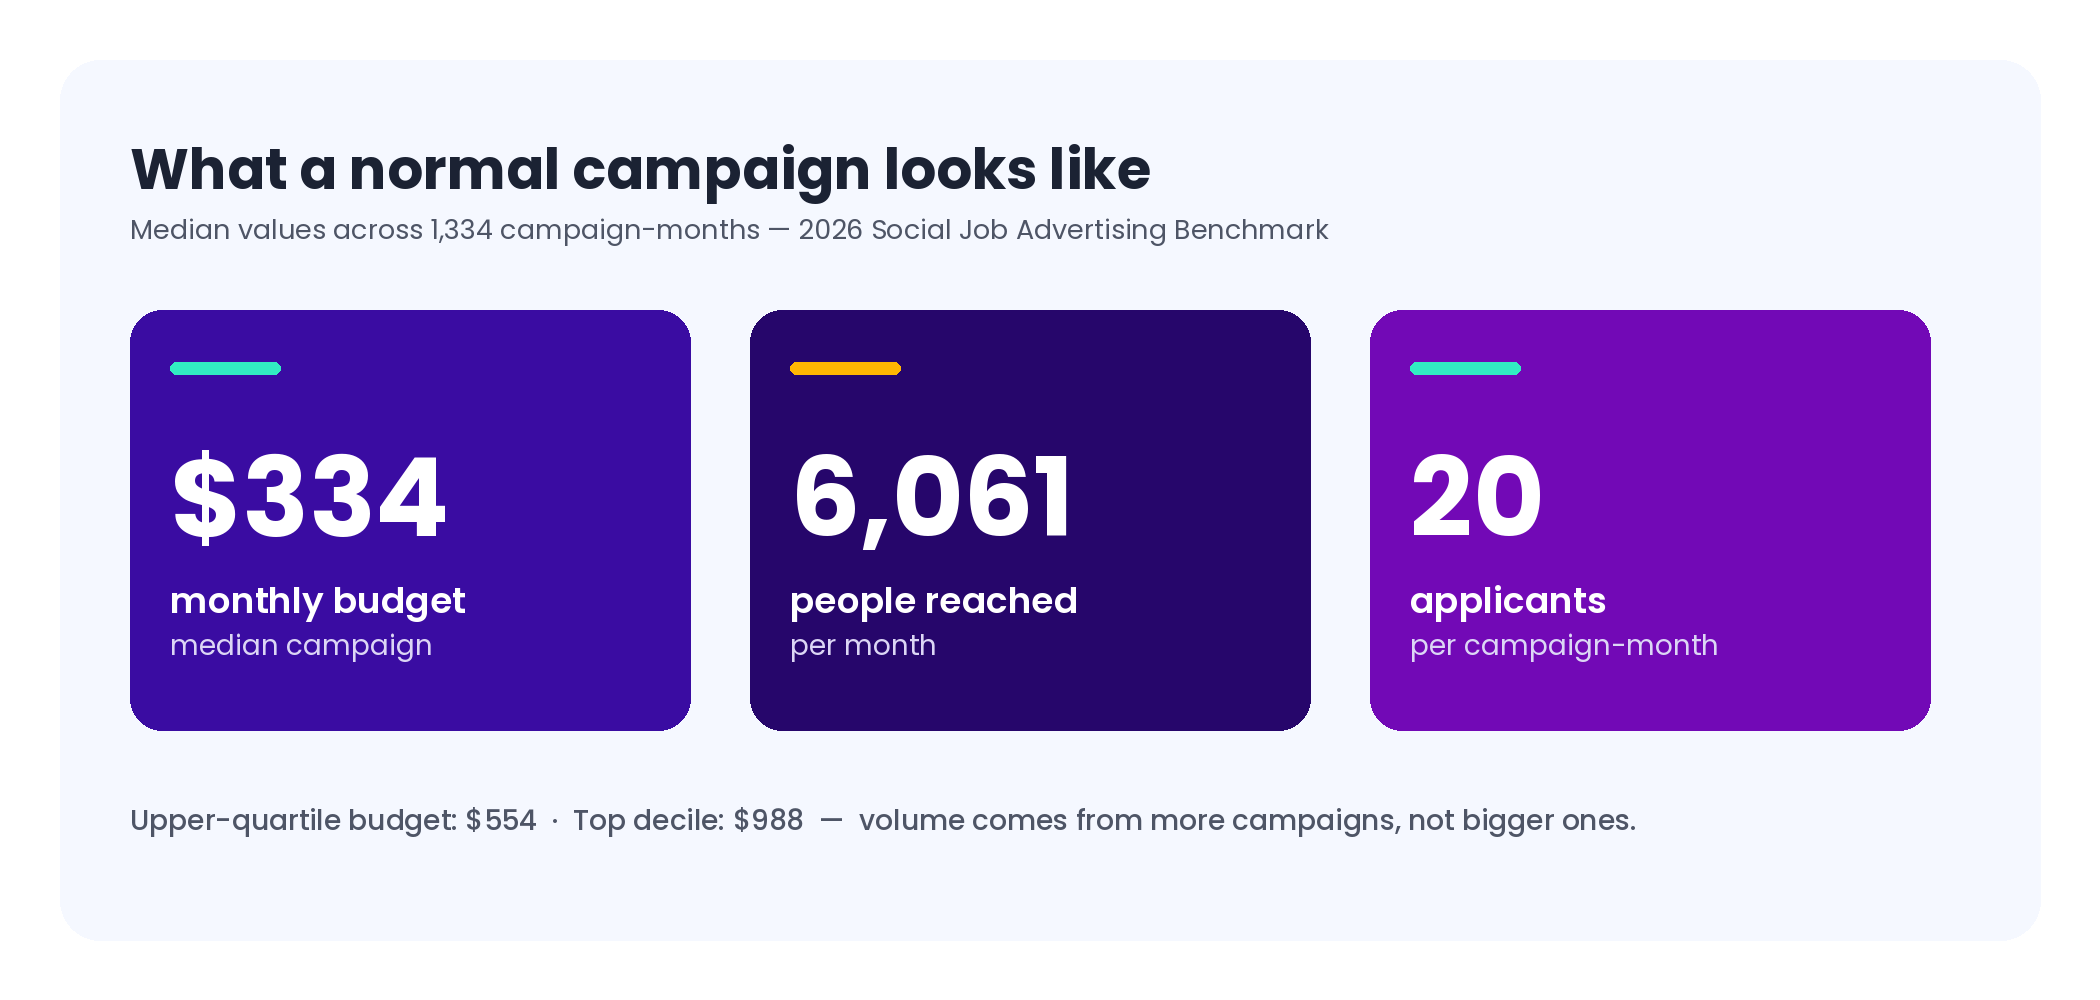
| Median monthly campaign budget | $334 |
| Upper quartile budget | $554 |
| Top decile budget | $988 |
| Median applicants per campaign-month | 20 |
| Median people reached per month | 6,061 |
A surge doesn't change the arithmetic — it multiplies it. Hiring at volume across roles or locations means running more of these campaigns, not one giant one. That is the mass-hiring pattern: one campaign per role family per market.
The structure finding: deadline campaigns are the cheapest campaigns
The benchmark compared three ways employers structure campaigns, and the result matters directly for surge hiring:
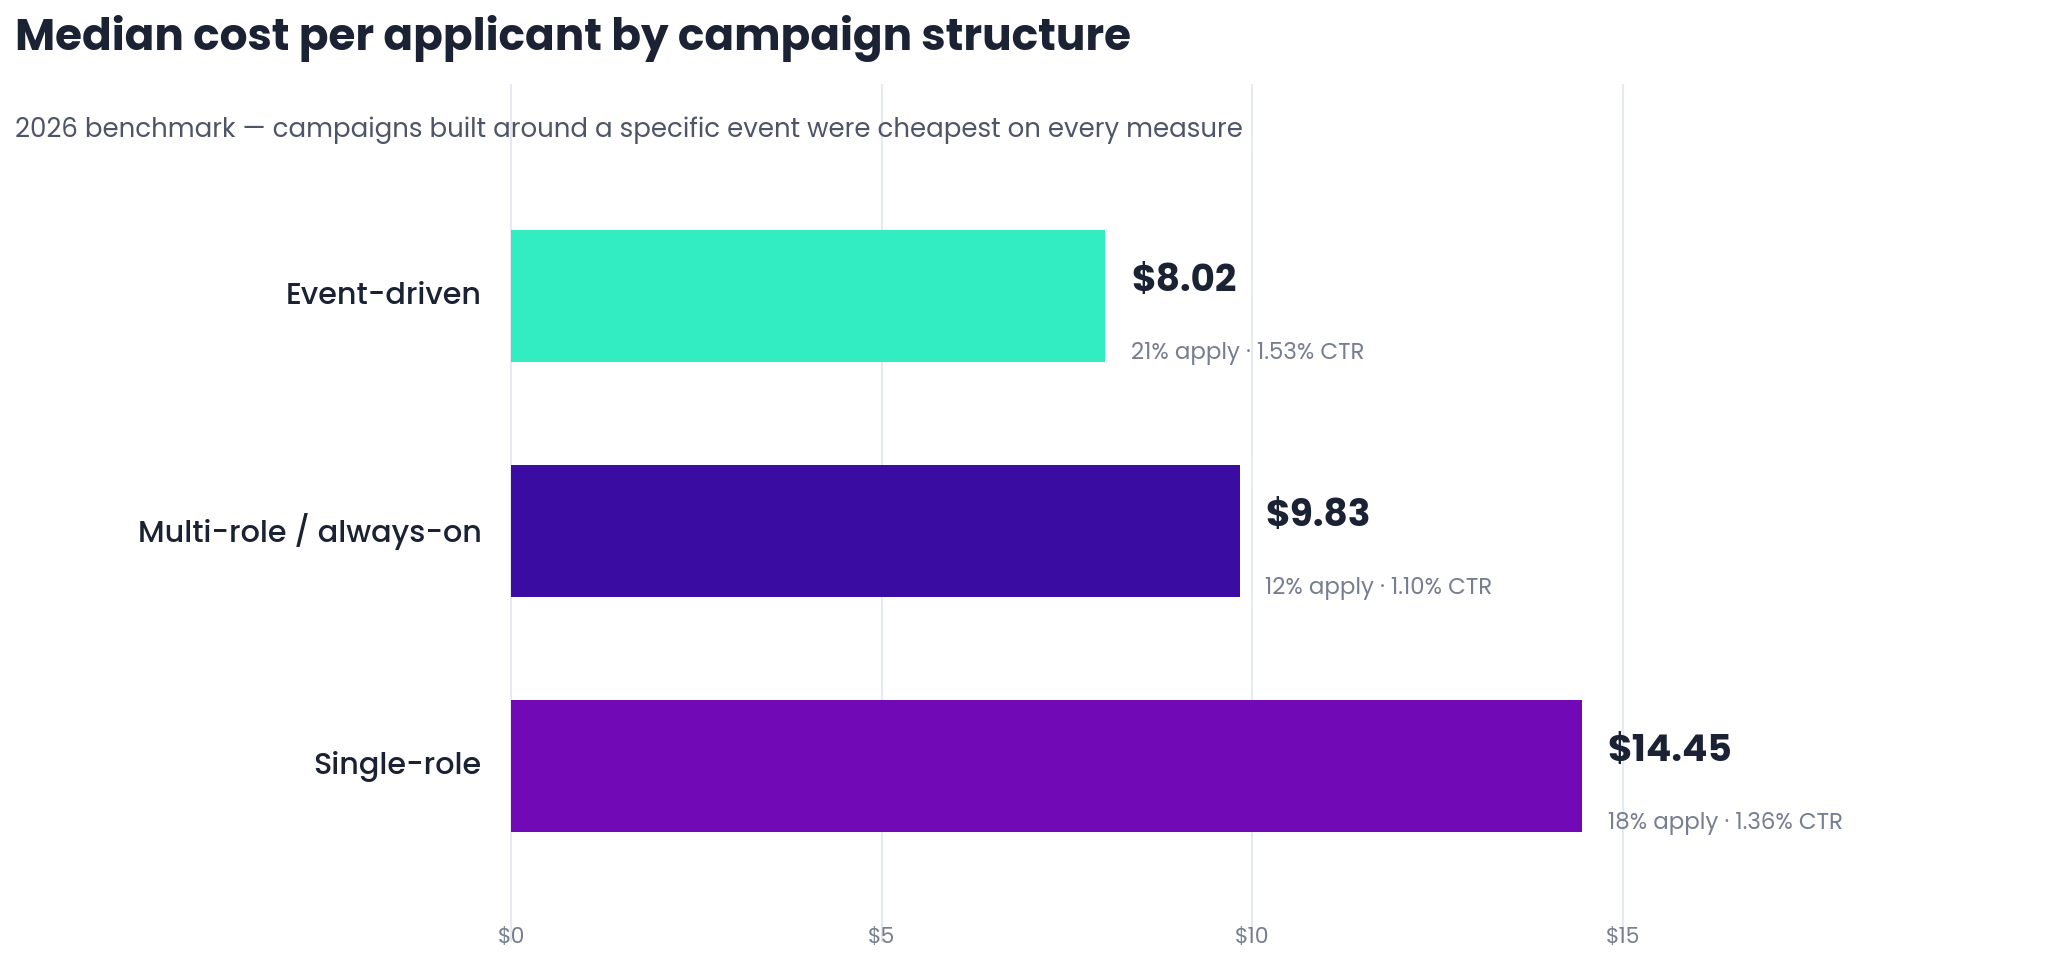
Event-driven
- 21% apply rate
- 1.53% click-through rate
- Built around a date: opening day, hiring event, season start
Multi-role / always-on
- 12% apply rate
- 1.10% click-through rate
- One evergreen campaign covering many openings
Single-role
- 18% apply rate
- 1.36% click-through rate
- One campaign, one specific opening
Event-driven campaigns — ads built around a specific moment with a real deadline — beat single-role campaigns on cost, click-through, and conversion simultaneously. The mechanism isn't mysterious: a deadline gives the ad a reason to exist now. "We're hiring 40 people before the store opens October 1" out-converts "We're hiring" because urgency is doing qualification work. It concentrates spend into a short flight before ad fatigue sets in, and it gives candidates a date to act against.
This is precisely the shape of a surge. Peak season hiring, a new location, a contract start — mass hiring comes with a built-in event. Most employers advertise it as if it were evergreen anyway, and pay the always-on conversion rate of 12% instead of the event rate of 21%.
Budget doesn't decide your output. Conversion does.
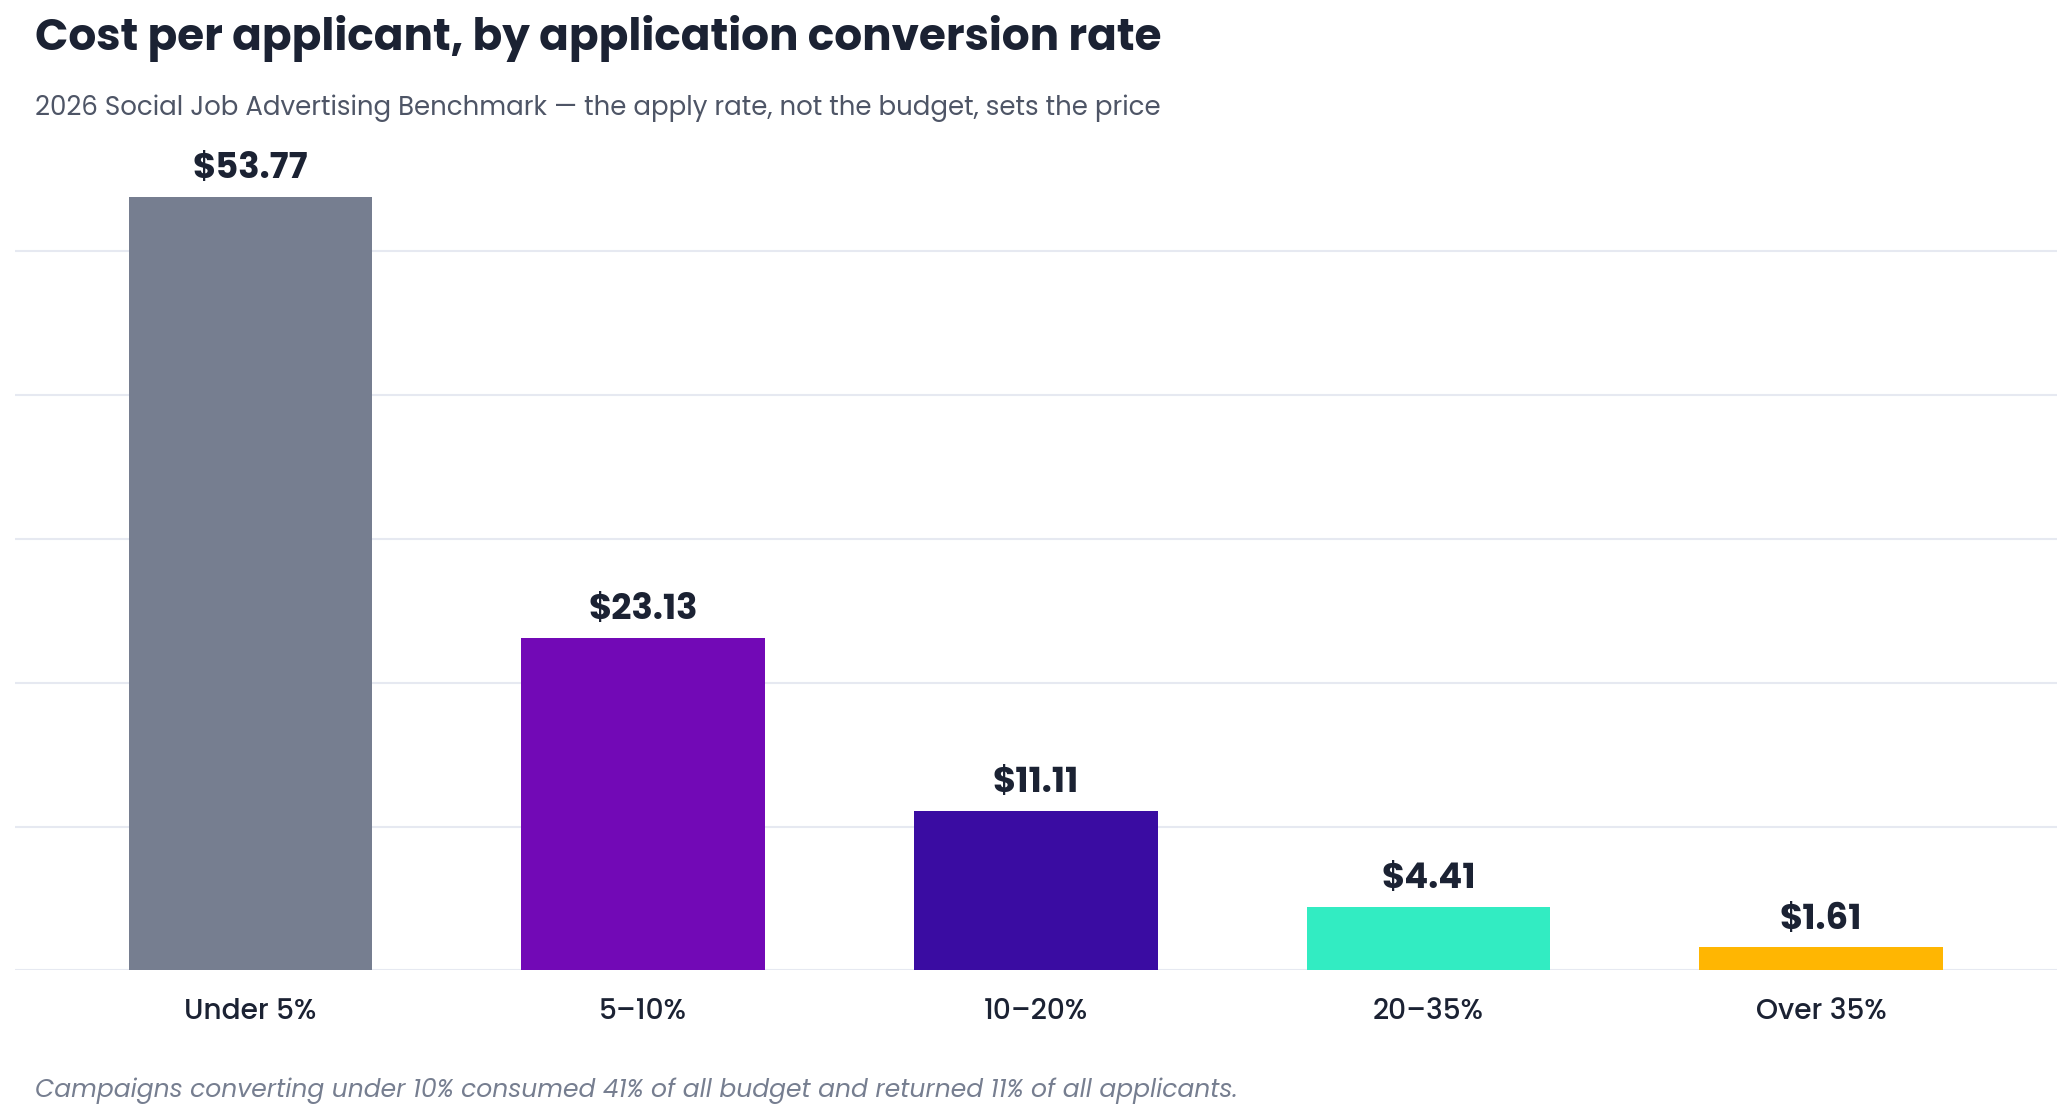
A pattern that runs through the whole benchmark: application conversion — what happens after the click — explains 70% of the variation in cost per applicant. Click-through rate explains 30%. What the ad auction charges explains just 18%. Here's what that means in dollars:
| Apply rate | Cost per applicant | Share of all budget | Share of all applicants |
|---|---|---|---|
| Under 5% | $53.77 | 18% | 3% |
| 5–10% | $23.13 | 24% | 8% |
| 10–20% | $11.11 | 32% | 23% |
| 20–35% | $4.41 | 21% | 38% |
| Over 35% | $1.61 | 6% | 28% |
Read the extremes: campaigns converting under 10% consumed 41% of all budget and returned 11% of all applicants. Campaigns converting over 35% produced applicants at $1.61. For a hiring surge, this is the whole game — a team that fixes its application flow before launch will out-hire a team that doubles its budget, at a fraction of the cost. Keep the application in-platform, keep it under a minute, and use knockout questions to do the screening the deadline can't.
The surge playbook: a launch timeline
Working backward from the day people need to start. The weeks are guidance from running these campaigns, not benchmark data — compress them if you have to, but know what you're compressing.
A surge is one application of the structure finding above. The other five — a single hard-to-fill role, an always-on pipeline, a new site, a single-shift campaign and a dated hiring event — are laid out side by side, with the window and form each one uses, on our recruitment campaign examples page.
When a temp agency is the right call for a surge
Sometimes it is, and pretending otherwise would make the rest of this page less believable:
- The surge is next week. Advertising produces applicants in days, but interviews, offers, and starts take your process time. If the dock needs bodies Monday, a light industrial staffing firm's bench is usually the faster tool.
- It's genuinely one-off. A single event, a one-time inventory count, a spike you'll never repeat. The advertising machine — creative, audiences, forms — pays for itself through reuse. No reuse, weaker case.
- You can't process the volume. Ads at surge budgets will produce hundreds of applicants. If nobody can screen and contact them same-day, you'll pay for applicants that expire. Agencies charge partly to be that capacity.
- You want the headcount off your payroll. Temp markups — typically 40–55% on light industrial wages (LG Resources, The Resource Company) and 25–100% in construction (Leapros, Hunter Recruiting) — buy real things: the agency employs the workers, carries payroll taxes and workers' comp, and absorbs the no-shows.
If the job is a handful of openings on a short deadline rather than a surge, the step order is different; our guide to filling open positions fast covers it.
The math when you have a few weeks of runway
Say the surge is 60 seasonal warehouse roles and you have the timeline above. Two honest columns — and they're not the same product, so read the caveat after the table:
| Route | The math | Result |
|---|---|---|
| Advertising: applicants | 60 hires × 12 applicants per hire (your ratio may differ) = 720 applicants × $4.44 blended warehouse cost | $3,196.80 in ad spend |
| Temp agency: markup premium | $18.00/hr × 40 hrs × 12 wks = $8,640 wages per worker; 40–55% markup = $3,456–$4,752 premium each × 60 workers | $207,360–$285,120 in markup |
These columns buy different things. The temp markup employs the workers — payroll, taxes, comp, replacements for no-shows — and delivers them fast. The ad spend buys applicants you still have to interview, hire, and put on your own payroll, with all the cost and admin that carries. But the gap between $3,196.80 and $207,360 is what you're paying for that service, priced per surge. Employers who hit the same peak every year are paying it annually for a season they can see coming twelve months out.
A surge you can see coming is an event, and event-driven campaigns are the cheapest applicants in our data. The employers who struggle treat every surge as an emergency — and emergencies pay agency rates.
Run your own numbers
- Applicants needed: hires needed × your applicants-per-hire ratio. If you don't know the ratio, pull last season's numbers from your ATS — for frontline roles, somewhere between 8 and 15 is common, but yours is the one that matters.
- Ad budget: applicants needed × cost per applicant for your role family (warehouse $9.83 median / $4.44 blended; customer service $2.71 median; caregiver $3.76 median — full table in the benchmark).
- The agency comparison: hourly wage × hours × weeks × the quoted markup × headcount. Then decide what the difference is worth in speed and offloaded admin — that's a real number too, it's just one only you can price.
One thing we can't compute for you: cost per hire. Our campaigns track applicants; hires happen in your ATS. Any surge-staffing math you build should use your own applicants-per-hire ratio, not a vendor's extrapolation.
The assessment step that keeps up with a surge is usually a group session rather than a queue of one-to-ones. Group interviews for employers has the structure, a four-dimension scoring sheet and a planner that sizes the day.
Frequently asked questions
What is mass hiring?
Mass hiring (also called bulk, surge, or high-volume hiring) is filling many positions in a compressed window — for peak season, a new location, a large contract, or rapid growth. It's most common in frontline and hourly work: warehouse, retail, customer service, care, and production roles.
How much does mass hiring cost with social advertising?
Across 1,334 campaign-months in our 2026 benchmark, the volume-weighted average was $8.02 per applicant, and high-volume frontline roles ran cheaper: warehouse and production blended to $4.44, customer service to $2.98, caregivers to $3.87. The median campaign budget was $334 a month.
What is surge hiring and how is it different?
Surge hiring is mass hiring with a hard deadline — a season start, an opening day, a contract date. That deadline is an advantage: campaigns built around a specific event produced applicants at a median of $8.02 in our data, versus $14.45 for standard single-role campaigns, with a 21% apply rate against 12% for always-on campaigns.
Do I need a big budget to hire at volume?
The data says no. The median campaign in our benchmark ran $334 a month, the upper quartile $554, and the top decile $988. Volume comes from running more small campaigns — per role family, per market — not from one large one.
What's the cheapest way to structure a high-volume campaign?
Build it around the event. Event-driven campaigns were the cheapest structure in our benchmark at an $8.02 median, with a 21% apply rate and 1.53% click-through — beating single-role campaigns ($14.45 median) and multi-role always-on campaigns ($9.83 median, 12% apply rate) on every measure.
When should I use a temp agency instead of advertising?
When the surge starts too soon to run a hiring process, when it's genuinely one-off, when nobody can contact applicants same-day, or when you want the workers employed off your payroll. Expect markups around 40–55% on light industrial wages and 25–100% in construction — fees that buy speed, employment administration, and no-show coverage.
How far ahead should I start peak season hiring?
Six weeks before start dates is a comfortable runway: four weeks to build roles, forms, and creative, then a soft launch two weeks out to fix conversion leaks cheaply, then full budget in launch week. It compresses to three or four weeks if it must — what shouldn't be cut is the soft launch, because that's where application-flow problems get fixed at partial budget.
Why do some high-volume campaigns produce so few applicants?
Almost always the application, not the ads. In our benchmark, campaigns converting under 10% of clicks consumed 41% of all budget and returned 11% of all applicants, while campaigns converting above 35% produced applicants at $1.61. Long, off-platform application flows are where surge budgets go to die.
How do I hire 50 people for a new facility quickly?
Treat the opening as a dated event. About six weeks out, lock the roles and headcount, build a one-minute in-platform application, then run one campaign per role family with the opening date and pay in the ad, and line up same-day contact. In Boostpoint's 2026 Social Job Advertising Benchmark, event-driven campaigns had a median of $8.02 per applicant against $14.45 for single-role campaigns. If people must start next week, a staffing agency's bench is faster.
How do you run a mass hiring event?
Pick a date, a location and a headcount, then advertise the event itself: the roles, the pay, the date and interviews on the day, with one campaign per role family. Collect applications in a one-minute mobile form beforehand, text reminders the day before and the morning of, and staff enough interviewers to decide on the spot. In Boostpoint's 2026 Social Job Advertising Benchmark, event-driven campaigns produced the lowest median cost per applicant of any campaign structure.
How many applicants do I need to hire 50 people?
Multiply the hires by your own applicants-per-hire ratio from last season's ATS data; for frontline roles, 8 to 15 applicants per hire is common. At 10 per hire, 50 hires needs 500 applicants. Then multiply by your role's cost per applicant: in Boostpoint's 2026 Social Job Advertising Benchmark, the median was $9.83 for warehouse and production roles and $2.71 for customer service.
Can I do mass hiring without a staffing agency?
Yes, if you have a few weeks of runway and someone who can contact applicants the same day. Run separate social job ad campaigns per role family and market, use a one-minute in-app application with text follow-up, and process volume through group interviews or a hiring event. In Boostpoint's 2026 Social Job Advertising Benchmark, the median monthly campaign budget was $334. An agency still makes sense when people must start next week.
How do I hire a lot of employees quickly?
Plan the processing, not just the applicants, because in a surge the bottleneck is usually the steps you do one person at a time. Set a date and a headcount by role, run one campaign per role family with the pay and start date in the first line, and keep the application to about a minute. Then remove the single-file steps: text every applicant automatically, book group interviews or a hiring event instead of individual slots, make conditional offers on the day, and start people in cohorts with orientation batched. Paperwork still runs per person: Form I-9 Section 1 is due at the time of hire and Section 2 within three business days of the hire under 8 CFR 274a.2, so staff the first day for it. If people must start next week, a staffing agency's bench is faster.
Staffing a surge this season?
We'll show you what campaigns like yours produced — budgets, applicant costs, and timelines from real event-driven hiring pushes.
Book a DemoAdvertising figures come from the 2026 Social Job Advertising Benchmark: 891 campaigns and 1,334 campaign-months run in 2026, reported as medians, quartiles, and volume-weighted averages of what advertisers paid. Campaigns run with click objectives rather than lead objectives are excluded; segments with fewer than 3 employers or 15 campaign-months are not published. Structure comparisons (event-driven n=78, multi-role n=46, single-role n=1,210; these counts are campaign-months) reflect how advertisers chose to run campaigns, not a controlled experiment. Timeline weeks are operating guidance, not benchmark data. Temp agency markup ranges are third-party figures from LG Resources, The Resource Company, Leapros, and Hunter Recruiting, cited in-text. Cost per applicant is not cost per hire; we track applications, not hires. Full methodology at boostpoint.com/benchmarks/. This is a sample of Boostpoint campaigns, not an industry-wide study.