
Recruitment Campaign Examples: Six Shapes, What Each Is Made Of, and What They Cost
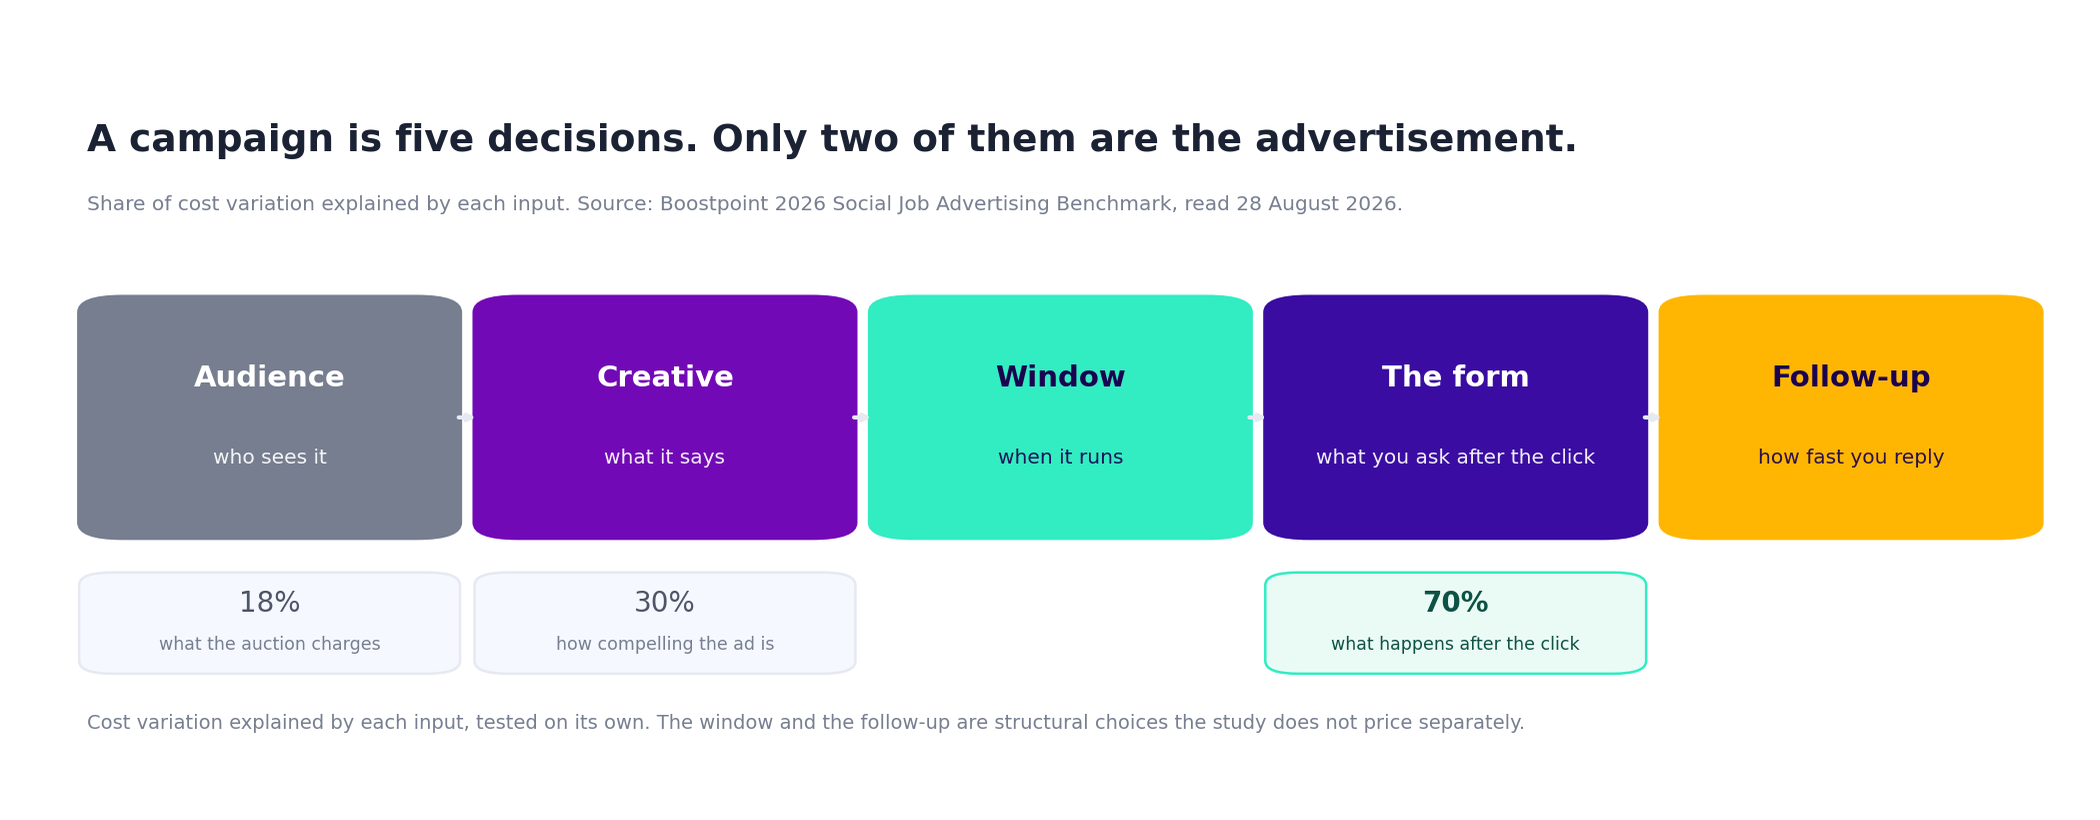
A recruitment campaign is not an ad. It is five decisions — who you are talking to, what the ad says, how long it runs, what the form asks, and how fast you reply — and the shape those five take together is what separates a campaign that costs $8.02 an applicant from one that costs $14.45. Below are six campaign shapes drawn from our own delivery, anonymized, each with the structure it uses and the published median it ran at.
A note on who's writing this, and what the neighboring pages own
Boostpoint builds and runs these campaigns, so treat the shapes below as our own working patterns rather than an industry survey. Every number is one already published in our 2026 Social Job Advertising Benchmark — 891 campaigns on Meta across 1,334 campaign-months — and is labeled where it appears. No employer is named, because none is named in the benchmark either.
Three sibling pages own parts of this subject and this page does not repeat them. What makes a good job ad owns the ad itself, part by part, and help wanted ad examples owns the written examples. Recruitment marketing budget owns what to spend and has the builder for it — you will find no budget arithmetic here. And mass hiring owns the surge case, where a campaign is one part of a much larger operation. What is left, and what this page is for, is the campaign as a unit of work: its parts, its shapes, and how to tell whether one worked.
The five parts of a recruitment campaign
Almost every campaign that disappoints is missing one of these, and it is rarely the one the team is arguing about.
- The audience. Who sees it, and how wide that pool is. US employment ads run under Meta's Special Ad Category rules, which remove age, gender and detailed targeting and restrict location targeting — so the audience is mostly geography, and the words do the rest of the targeting.
- The creative. The ad. Pay, shift and place in the first two lines, and more than one version of it, because one ad repeated to the same people is the mechanism behind the frequency problem further down.
- The window. When it starts, when it ends, and whether there is a date in it. This is the single biggest structural choice available and the one most often left unmade.
- The form. What you ask after the click. This is where the money is won or lost, and the data on that is unambiguous.
- The follow-up. What happens in the hours after a form arrives. A campaign with no reply plan is an expensive way to generate a list.
The three structures, and what each is measured at
Every campaign we run resolves to one of three structures, and they do not cost the same. These are the published medians; the surge application of the same finding is on our mass hiring page.
| Structure | Median cost per applicant | Apply rate | Click-through | What it is |
|---|---|---|---|---|
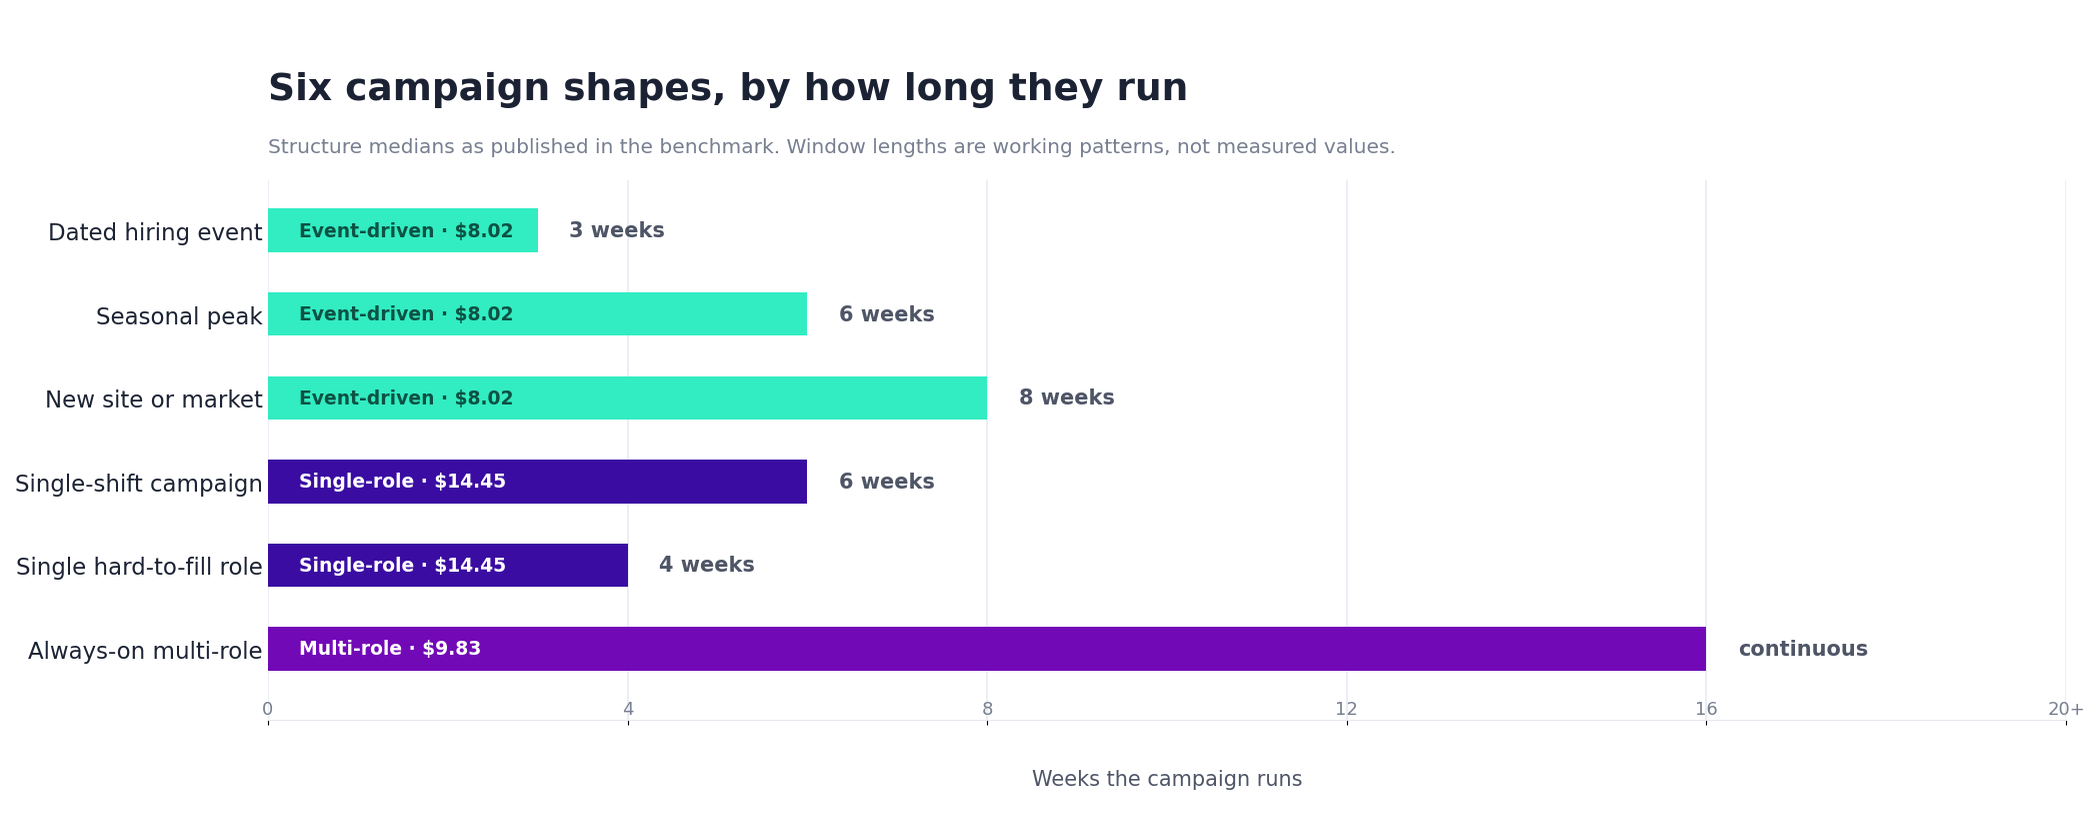
| Event-driven | $8.02 | 21% | 1.53% | Built around a date: opening day, hiring event, season start |
| Multi-role, always-on | $9.83 | 12% | 1.10% | One evergreen campaign covering many openings |
| Single-role | $14.45 | 18% | 1.36% | One campaign, one specific opening |
The event-driven structure beats the other two on cost, click-through and conversion at the same time, which is unusual and worth pausing on. The mechanism is not mysterious: a date gives a reader a reason to act now, and an ad without one competes with the reader's intention to deal with it later.
Six recruitment campaign examples
Six shapes we run, described as structures rather than case studies. No employer is identified and no result is claimed beyond the published medians already shown.
1. The dated hiring event
A single date, two to three weeks of run-up, three creative variants, a two-question form that registers rather than applies, and interviews on the day. Everything in the ad points at the date. This is the event-driven structure and it carries the study's lowest median at $8.02. The room-filling mechanics are on our open house hiring event page.
2. The single hard-to-fill role
One opening, two ad variants, a three-question form, a two-to-four week window and a rebuild rather than an extension when it tires. This is the most common shape employers ask for and the most expensive of the three at a $14.45 median — not because the role is hard, but because one opening supports only one message.
3. The always-on multi-role pipeline
One campaign covering many openings, running continuously, reviewed monthly. The median is $9.83, but note the apply rate: 12%, the lowest of the three. Breadth buys efficiency at the top of the funnel and loses precision after the click, which is the trade you are making when you choose it.
4. The new site or new market
Structurally an event campaign — opening day is the date — with one difference that matters. Nobody in that radius has heard of you, so the first week is spent buying recognition rather than applications, and judging it on week-one cost per applicant will lead you to switch it off just before it starts working.
5. The single-shift campaign
Nights, weekends, or a specific rotation, advertised as the thing itself rather than as a footnote on a general ad. The audience is smaller and self-selecting, which usually means a narrower radius and a longer window. Our how to fill open shifts page covers what changes when the shift starts at 11pm.
6. The seasonal peak
A dated push with a hard end, run against a known calendar rather than a vacancy. It behaves like the event-driven structure because it is one. The operational half — how many people you actually need in the room, and when to start — belongs to mass hiring, which is where that arithmetic lives.
From launch to start date.
Across all the roles in scope.
The structure medians are published benchmark values. The window, variant count, form length and follow-up timing are Boostpoint's working patterns, not measured results, and no cost or budget is derived here — cost per applicant is not cost per hire.
What actually decides the cost, whichever shape you pick
Across the study we tested how much of the variation between campaigns each input explains on its own. What happens after the click explains about 70%. Click-through explains 30%. What the auction charges explains 18%. Nearly every hour most teams spend negotiating media efficiency is aimed at the smallest of the three levers.
The consequence is visible in the budget. Campaigns where fewer than one in ten clickers finished the form consumed 41% of all budget and returned 11% of all applicants. Campaigns above a 35% apply rate used 6% of budget to deliver 28% of applicants, at $1.61 each. The difference between those two groups is not the ad. It is the form.
The window, and the frequency cliff at the end of it
Frequency is the average number of times each person in your audience saw your ad in a month, and it is the most reliable early warning in the dataset. Below roughly 2.5, median cost per applicant sits between $11.48 and $13.39. Above 3.0 it rises to $18.76, and above 4.0 to $26.78 — more than double the low-frequency figure — while click-through falls from 1.69% to 0.94%. A third of all budget in the study ran above 3.0.
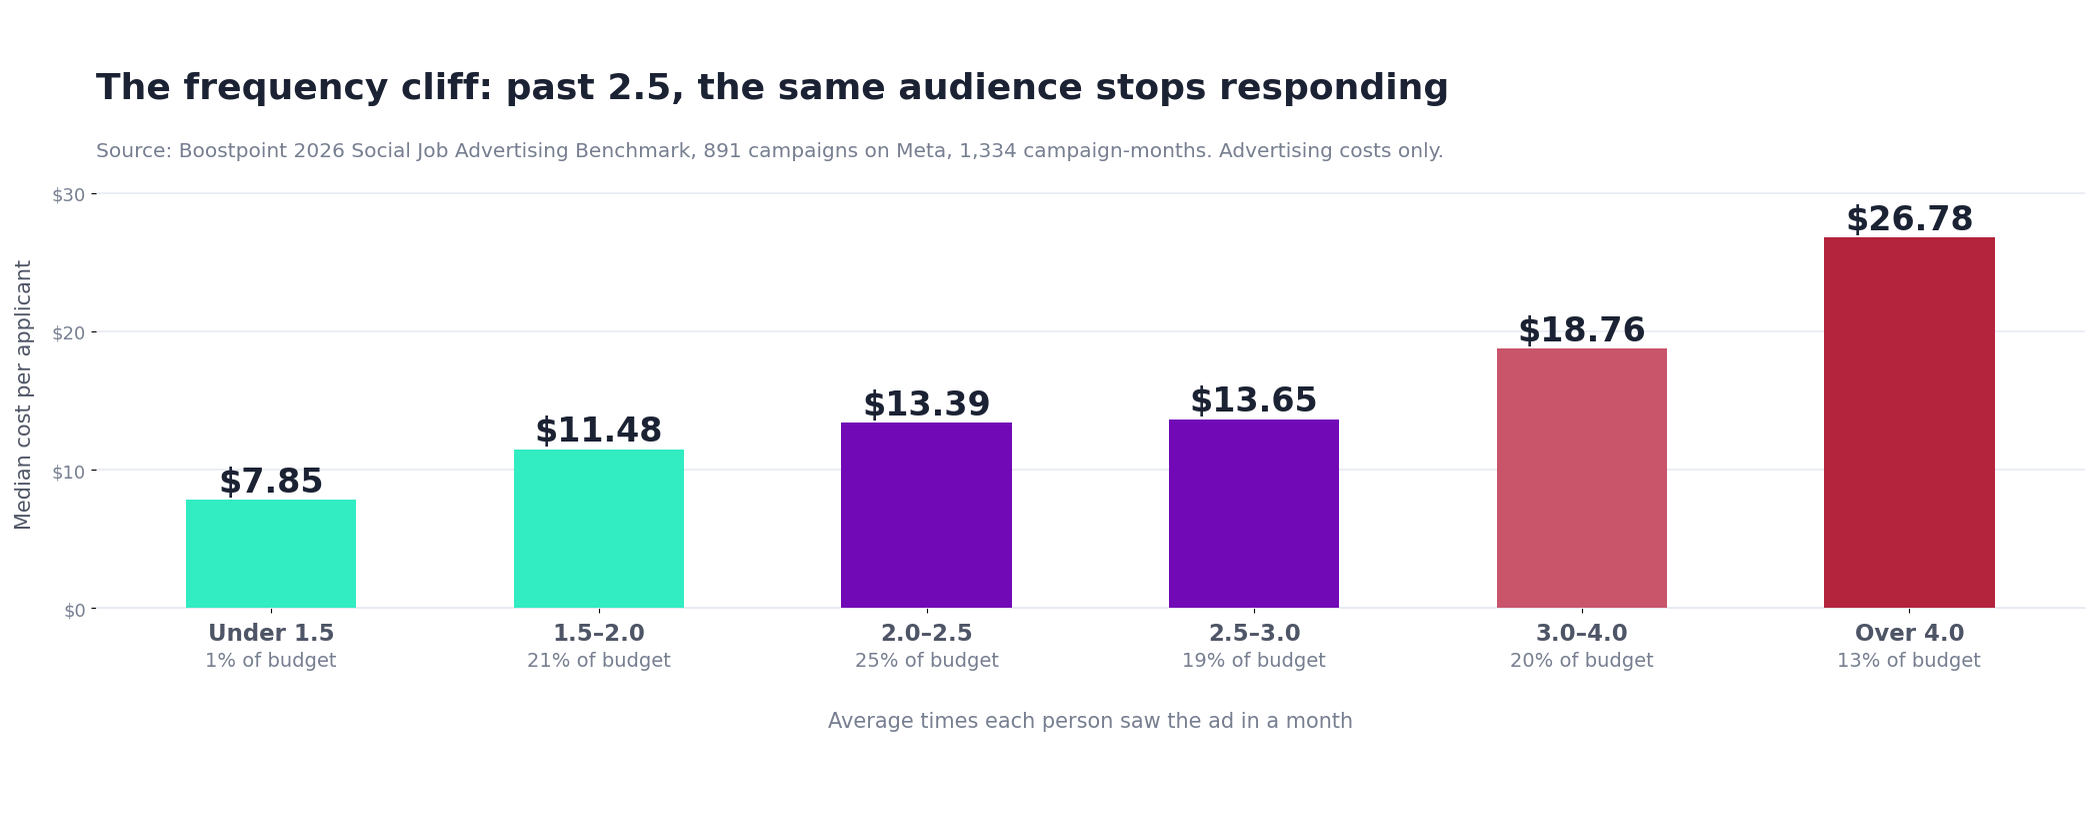
High frequency is almost always a budget-to-audience mismatch — a daily spend large enough to saturate the targeted audience within days. The fix is rarely to cut the budget. It is to widen the audience so the same money reaches more people fewer times. Check frequency weekly, and act when a campaign passes 2.5 rather than waiting for cost per applicant to tell you afterwards.
Frequently asked questions
Recruitment campaign ideas: ten that hold up for hourly roles
The six examples above are structures. These are starting points, and each one is really an argument for why someone should move now rather than later.
- The pay change. If the wage went up, that is the campaign. Lead with the number and the date it took effect.
- One shift, named. Advertise the weekend or the overnight on its own. The people who want those hours are a different audience from the people who want days.
- The hiring event. A place, a date and walk-ins welcome. Events consistently produce the lowest cost per applicant of any structure we run.
- An employee saying why they stayed. Twelve seconds, filmed on a phone, one honest sentence.
- The referral push. Run it at your own employees rather than by email, and say what the bonus is and when it pays.
- Past applicants, reopened. The cheapest audience you own, subject to the consent they gave you when they applied.
- The commute campaign. Target the radius people would drive, not a job title. For frontline work, distance decides more applications than the description does.
- The seasonal ramp, with an end date in it. A stated window gives people a reason to act and gives you a reason to stop spending.
- No experience, we train. Only run it if it is true, and say what the training is.
- The second job. Evenings and weekends advertised as additional income rather than as a career move.
None of these is a creative exercise. Each one is a different answer to the same question an applicant is asking, which is why this job, and why now.
What is a recruitment campaign?
A set of five decisions run together: the audience who sees it, the creative they see, the window it runs in, the form they complete, and the follow-up after they do. A single job ad is one of those five. Campaigns are judged on cost per applicant and apply rate rather than impressions or clicks, because those are the two numbers that move with the decisions you control.
What does a good recruitment campaign look like?
It has a date in it, more than one creative variant, a form short enough to finish on a phone during a break, and a reply plan measured in hours. In our benchmark the event-driven structure — the one built around a date — ran at a $8.02 median cost per applicant with a 21% apply rate, against $14.45 for the single-role always-on campaign.
How long should a recruitment campaign run?
Long enough to be judged and short enough to keep its edge. Fewer than three weeks of delivery usually leads to the wrong conclusion about performance, and past a monthly frequency of about 2.5 the same audience stops responding — median cost per applicant rises from around $13.39 to $18.76 above 3.0. Two to four weeks is the working range for a single role.
What is the difference between a hiring campaign and a job ad?
The ad is the creative; the campaign is the ad plus the audience, the window, the form and the follow-up. Employers who describe a disappointing result usually describe an ad problem, but the benchmark attributes about 70% of the cost variation between campaigns to what happens after the click, and only 18% to what the auction charges for the impression.
What are examples of recruitment campaigns?
Six shapes cover most frontline hiring: a dated hiring event, a single hard-to-fill role, an always-on multi-role pipeline, a new site or market opening, a single-shift campaign for nights or weekends, and a seasonal peak. Four of the six are event-driven in structure, which is the cheapest shape we measure, and the difference between them is what the date is attached to.
How do you measure a recruitment campaign?
Cost per applicant and apply rate, weekly, with frequency watched alongside them. A completed form is the unit — not a click, not an impression. Cost per applicant is not cost per hire and no cost per hire can honestly be derived from ad platform data, because the platform cannot see what your recruiters did with the applications after they arrived.
Why do recruitment campaigns stop working?
Usually frequency. The audience has seen the ad, and the same money now reaches the same people more times rather than reaching more people. Median cost per applicant roughly doubles between a monthly frequency under 1.5 and one above 4.0, and click-through falls from 1.69% to 0.94% across the same range. Widening the audience fixes it more often than cutting the budget does.
Can you target a recruitment campaign by age or job title?
Not on Meta in the US. Employment ads run under the Special Ad Category, which removes age, gender and detailed targeting and restricts location targeting. In practice the audience is mostly geography and the words do the targeting — which is why pay, shift and place in the first two lines of the ad matter more in recruitment advertising than in almost any other category.
What are some recruiting campaign ideas that work for frontline roles?
The ones built around a change rather than a mood. A pay rise, a new shift, a hiring event with a date on it, a season with an end to it: each gives a reason to act this week. Recruiting campaign ideas that fail are usually generic hiring posts with no pay, no place and no deadline, which give a reader nothing to decide about. Start from what changed, and the ad tends to write itself.
Where do hiring campaign ideas usually go wrong?
In the half that comes after the click. Most hiring campaign ideas are judged on the creative and lost on the application form, the reply time, or a window left open so long that the same people see the same ad for the fifth time. Decide the length of the form, who answers, and when the campaign ends before anything is built. A good idea pointed at a fifteen-minute application is worse than a plain one pointed at a short form.
What is a hiring campaign?
A hiring campaign is a planned push to fill one or more roles within a set window, with its own audience, ad, application and budget, measured on what each applicant costs. It differs from a job posting, which waits to be found, because a campaign puts the job in front of people who were not looking.
How do you plan a hiring campaign?
Pick the shape first — a dated hiring event, a single hard-to-fill role, an always-on pipeline, a new site, a single shift or a seasonal peak — then set the window, the audience radius, a short application and a budget from your applicant goal times your expected cost per applicant. Watch frequency weekly and widen the audience before costs climb.
Running one of these six
We build the campaign, run it where frontline candidates actually are, and report what each applicant cost — cost per applicant, not cost per hire. If you already know which shape you need, the fastest conversation starts there.
All campaign figures: Boostpoint 2026 Social Job Advertising Benchmark — 891 Boostpoint-managed campaigns on Meta across 1,334 campaign-months in 2026, advertising costs only. Structure medians: event-driven $8.02 at a 21% apply rate and 1.53% click-through, multi-role always-on $9.83 at 12% and 1.10%, single-role $14.45 at 18% and 1.36%. Cost variation explained: 70% by applicant conversion after the click, 30% by click-through, 18% by cost per thousand impressions. Apply-rate bands: campaigns under 10% took 41% of budget and returned 11% of applicants; campaigns above 35% used 6% of budget for 28% of applicants at $1.61 each. Frequency: $7.85 under 1.5, $11.48 at 1.5–2.0, $13.39 at 2.0–2.5, $13.65 at 2.5–3.0, $18.76 at 3.0–4.0, $26.78 above 4.0, with click-through falling from 1.69% to 0.94%. Cost per applicant is not cost per hire, and no cost per hire is derived from it anywhere on this page. Window lengths, creative counts and follow-up timings are Boostpoint's working patterns rather than measured values, and are labeled as such. Meta Special Ad Category rules read from Meta's published advertising policies. Last updated August 2026.