
The First 90 Days: No-Shows, Week-One Quits and 90-Day Exits, and Why Most of Them Were Decided Before the Ad Was Written
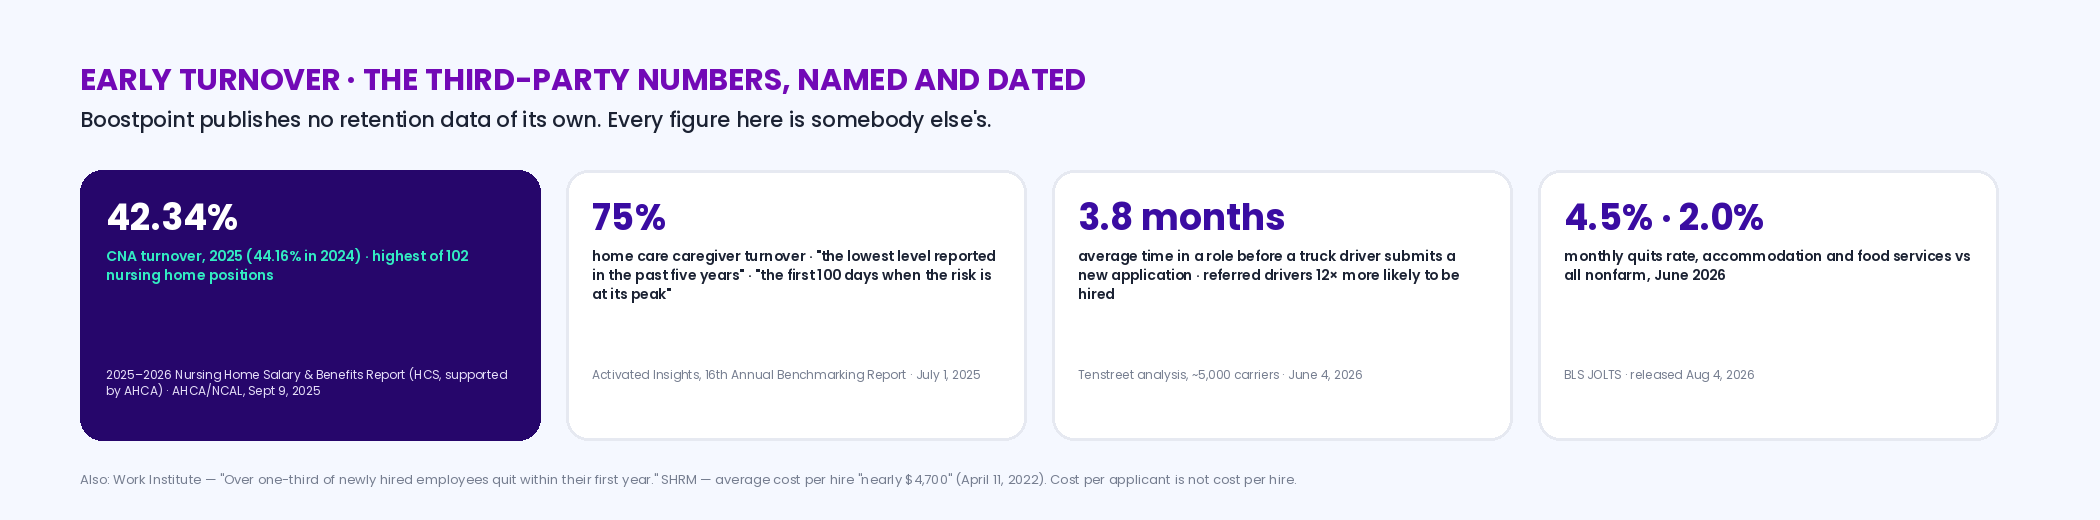
First-90-days turnover is the hire that never shows, the one who quits in week one, and the one who's gone by day 90 — and in frontline work it's most of the turnover there is. The numbers are third parties': CNA turnover ran 42.34% in 2025 (AHCA's salary and benefits report), home care caregiver turnover 75% (Activated Insights, 2025), and truck drivers file a new application after an average of 3.8 months in a role (Tenstreet, June 2026). We publish no retention data of our own; what we can say from ours is that the expectation an applicant arrives with was set by the ad, and an ad that names the wage, the shift and the site in the first line is the first retention tool. Below: the third-party numbers, where the loop leaks, the 90-day cadence, and two planners.
A note on who's writing this
Boostpoint sells recruitment advertising, which ends at the application — we see applicants, not starts, and not who's still there at day 90. So every turnover figure on this page is a third party's, named and dated, and every cadence step is our practice or our clients' rather than a measured result; where we say "same day," that's how we run follow-up, not a statistic. The one claim we make from our own data is narrower: in our benchmark the click-to-application conversion rate explained 70% of the variation in what an applicant costs, and the same first line that converts — the wage, the shift, the site — is the one that sets the expectation the hire shows up with. Cost per applicant is not cost per hire, and nothing here is a cost per hire or a retention rate of ours.
The case that early turnover is a hiring problem, not a management one
The manager's version of early turnover is that people don't want to work anymore. The recruiter's version is more useful: a new hire who leaves in the first 90 days is usually leaving a job that turned out to be different from the one they applied for. The shift was nights when the ad said "flexible"; the pay was the base when the ad said "up to"; the site was forty minutes farther than the ad implied; the manager they met on day one wasn't the one who interviewed them. None of that is a training problem, and no onboarding program fixes a mismatch that was written into the ad. That's the case this page makes first, because it's the part a recruiting company can honestly speak to: the first retention tool is an accurate ad, the second is a fast, specific reply, and the third is a start date that arrives with the paperwork already done. The management half — the buddy, the check-ins, the 90-day review — matters too, and the cadence below has it, but it comes second.
One thing moves quietly across all five of those exits: what a candidate already believed about working for you before they applied. Employer branding on a budget treats that as a tiebreaker rather than a fix, which is the honest framing for frontline roles.
The third-party numbers
Frontline turnover is measured by the industries themselves, and the measured figures are worth reading exactly. In skilled nursing, the 2025–2026 Nursing Home Salary and Benefits Report — from the Hospital and Healthcare Compensation Service, supported by AHCA, covering 917 nursing homes and more than 111,600 employees — put CNA turnover at 42.34% in 2025, down from 44.16% in 2024 and still the highest of any position tracked (AHCA/NCAL, September 9, 2025). In home care, Activated Insights' 16th annual benchmarking report, released July 1, 2025, reported caregiver turnover "dropping to 75%, the lowest level reported in the past five years," and describes "the first 100 days when the risk is at its peak." In trucking, Tenstreet's analysis of roughly 5,000 carriers (June 4, 2026) found drivers submitting new applications after an average of 3.8 months in their current roles, with average tenure rising since late 2023 — and that drivers referred by another driver were 12 times more likely to be hired than the platform average. Across the economy, the BLS quits rate for accommodation and food services was 4.5% a month in June 2026 against 2.0% for all nonfarm employment (JOLTS, released August 4, 2026), and Work Institute, which runs exit interviews, puts it plainly: "Over one-third of newly hired employees quit within their first year." Every one of those figures is somebody else's, and each industry's own page has the detail: caregivers, drivers.
| Role or sector | Figure | What it measures | Source |
|---|---|---|---|
| CNAs, skilled nursing | 42.34% (2025), from 44.16% (2024) | Annual turnover; highest of 102 positions tracked | 2025–2026 Nursing Home Salary & Benefits Report (HCS, supported by AHCA), AHCA/NCAL, September 9, 2025 |
| Caregivers, home care | 75% (2025 report) | Annual turnover, "lowest level reported in the past five years"; "the first 100 days when the risk is at its peak" | Activated Insights, 16th Annual Benchmarking Report, July 1, 2025 |
| Truck drivers | 3.8 months | Average time in a role before submitting a new application; referred drivers 12× more likely to be hired | Tenstreet analysis, ~5,000 carriers, June 4, 2026 |
| Accommodation and food services | 4.5% a month vs 2.0% all nonfarm | Quits rate, June 2026 | BLS JOLTS, released August 4, 2026 |
| All new hires | "Over one-third … within their first year" | Share of new hires who quit in year one | Work Institute, first-year turnover page |
| The cost of the second hire | "Nearly $4,700" | Average cost per hire, all-in, all industries | SHRM, April 11, 2022 |
Where the loop leaks: five exits between the application and day 90
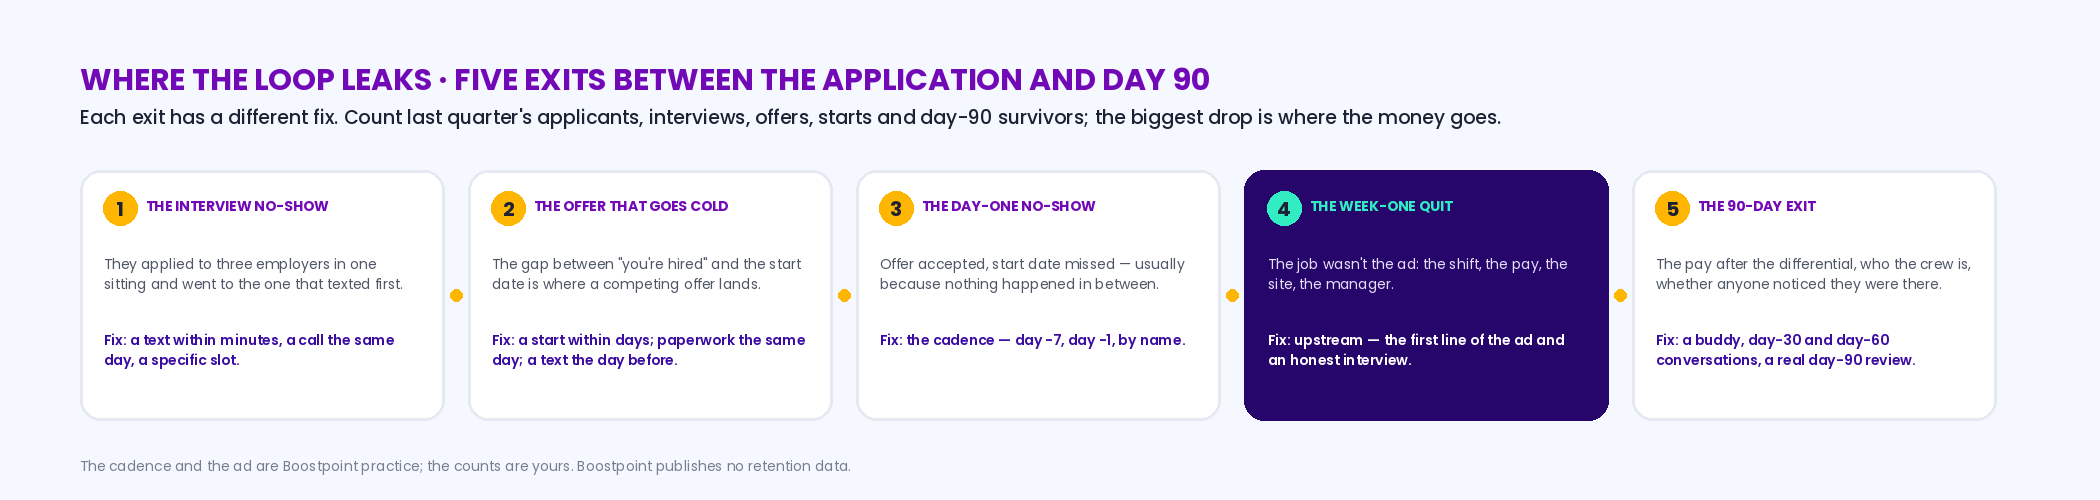
Treat the 90 days after the application as a funnel with five exits, because each one has a different fix. The interview no-show: the applicant applied to three employers in one sitting and went to the one that texted first; the fix is the reply, within minutes by text and the same day by phone, with a specific slot rather than "we'll be in touch" — the on-the-spot version collapses the interview into the walk-in (how that works). The offer that goes cold: the gap between "you're hired" and the start date is where a competing offer lands; the fix is a start date within days, paperwork sent the same day the offer is made, and a text the day before day one (the job offer). The day-one no-show: an offer accepted and a start date missed, usually because nothing happened in the days between; the fix is the cadence below. The week-one quit: the job wasn't the ad — the shift, the pay, the site, the manager — and this one is decided upstream, in the first line of the ad and the honesty of the interview. The 90-day exit: the hire found out what the job pays after the differential, who the crew is, and whether anyone noticed they were there; the fix is a buddy, a day-30 and day-60 conversation, and a 90-day review that's a raise conversation when it should be. Which exit is leaking is a number you already have: count the applicants, the interviews held, the offers accepted, the day-one starts and the day-90 survivors for the last quarter, and the biggest drop is where the money goes. Tag the source on each so you can see whether a channel's hires leave faster — the tagging is on the analytics page.
What early turnover costs — on your numbers, not ours
We don't publish a cost per hire and won't compute one from ad data, so the cost of an early quit here is built from two figures you supply and one third-party reference. Your figures: how many people you hire a year, and what share are gone by day 90 — from your own records, and if you've never counted, the last quarter's starts against today's roster is a ten-minute exercise. The reference: SHRM's average cost per hire of "nearly $4,700" (April 2022), an all-in, cross-industry figure that's a placeholder for what replacing someone costs you, not a measurement of your business. The advertising side is the smaller number and the one we can speak to: replacing an early quit means buying another set of applicants at whatever the role's cost per applicant is — the benchmark's all-industry median is $13.88 — times your own applicants-per-hire ratio. The calculator does both and keeps them separate, because the advertising cost of a re-hire is not its cost per hire, and confusing the two is how a "cheap" channel with fast-quitting hires looks like a bargain.
Interactive
Early turnover cost calculator — hires a year, the share gone by day 90, what a replacement costs you, and your applicants-per-hire ratio; get the early quits, the replacement cost, and the re-advertising media
Nothing is stored or sent — this runs in your browser. The 90-day share and the replacement cost are yours; SHRM's "nearly $4,700" is a placeholder for the second, not your figure. The media line uses the benchmark median and is an illustration.
hires × share gone by day 90
early quits × your cost to replace
early quits × your ratio
applicants × $13.88 benchmark median
There is a cost side to those same ninety days. A departure before the training ramp is repaid writes off the whole investment, and the repayment window is set by industry tenure rather than by the training plan — we work it through in new hire training for hourly roles.
The 90-day cadence: eight touches, with dates
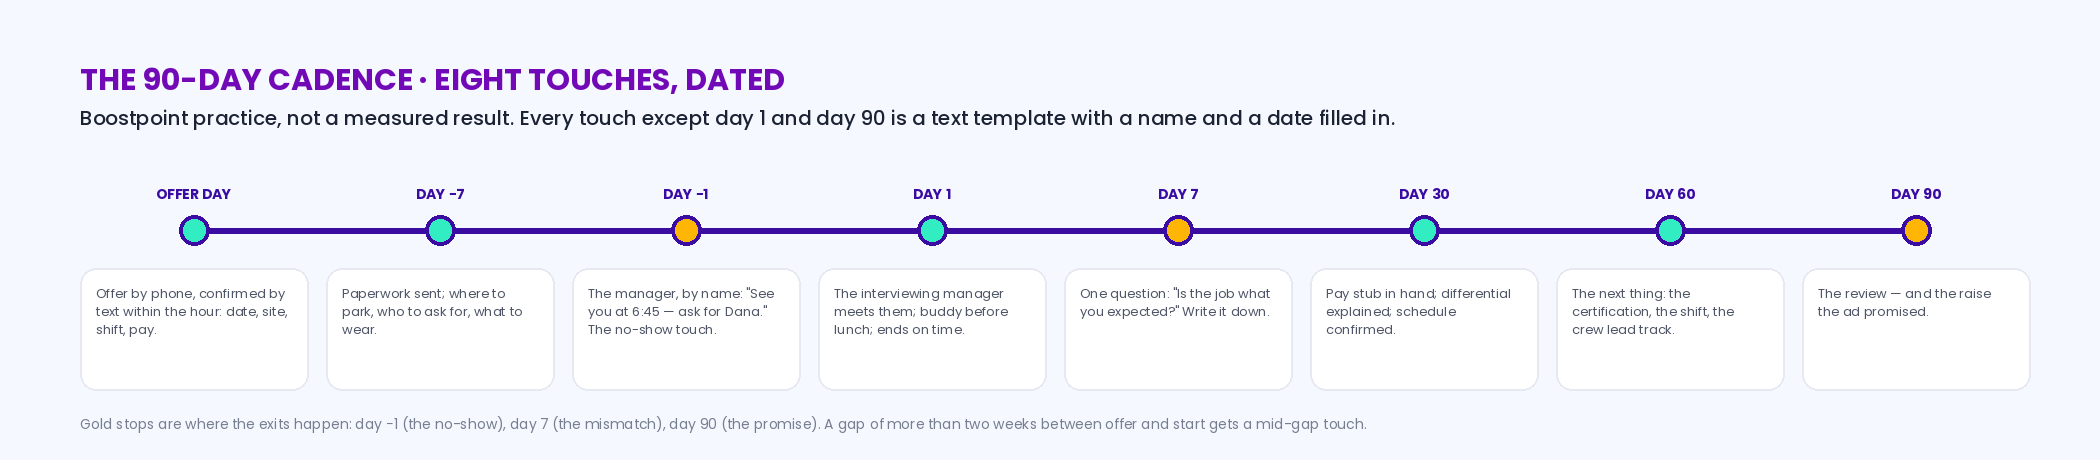
The onboarding programs that reduce early exits are not elaborate; they're dated. What follows is the cadence we recommend and run with clients — practice, not a measured result — and the builder turns a start date into the calendar. Offer day: the offer by phone, confirmed by text within the hour, with the start date, the site, the shift and the pay in the text so there's a record the hire can re-read. Day −7: paperwork sent and the first day described — where to park, who to ask for, what to wear, when lunch is. Day −1: a text from the manager, by name: "See you at 6:45 tomorrow, ask for Dana." This is the no-show touch; most day-one no-shows had heard nothing since the offer. Day 1: the manager who interviewed them is the one who meets them; a buddy is assigned before lunch; the first day ends at a normal time. Day 7: the manager asks one question — "Is the job what you expected?" — and writes down the answer, because the gap between the ad and the job is now visible and fixable. Day 30: the first real check-in, with the pay stub in hand, the differential explained, and the schedule confirmed. Day 60: a conversation about the next thing — the certification, the shift they'd rather have, the crew lead track (the induction program). Day 90: the review, and if the ad said "raise at 90 days," the raise. Every one of those can be a text template; texting is the medium for all of them, and the communication glossary covers the tone.
Interactive
90-day cadence builder — the offer date and the start date; get the eight touches with dates, who owns each, and what it says
Nothing is stored or sent — this runs in your browser. The cadence is Boostpoint's practice, not a measured result; the dates are arithmetic on yours.
New hire check-in questions for day 30, 60 and 90
Good new hire check-in questions ask about specific things you can fix, not how the person “feels about the job.” Each check-in in the cadence above has a different job: day 30 checks the job matches the ad, day 60 looks for the reason they might leave, and day 90 decides whether they are staying and what comes next. Five questions each is enough. Write the answers down, because the pattern across ten hires is worth more than any one conversation. These are Boostpoint's working questions, not measured results.
Day 30: is the job the one we advertised?
- “Is the job what you expected when you applied? What's different?”
- “Is your paycheck what you expected? Is anything on the stub unclear?” (Have the stub in hand and explain the differential.)
- “Is your schedule the one you were promised?”
- “Is there anything you still haven't been shown how to do?”
- “Who do you go to when you're stuck, and do they help?”
Day 60: what would make you leave?
- “What's the hardest part of the job right now?”
- “If a friend asked you whether to apply here, what would you tell them?”
- “Has anyone offered you another job, or have you looked?” Ask it plainly; the honest answer is the useful one.
- “What's one thing we could change that would make this shift easier?”
- “What would you like to be doing six months from now: a certification, a different shift, lead work?”
Day 90: are you staying, and what comes next?
- “Looking back at the first three months, what should we have told you on day one?”
- “What do you need from me to do this job well for the next year?”
- “Here is how I think you're doing. Does that match what you think?” (Give your own view first, with an example.)
- “Here is what happens to your pay now.” If the ad promised a raise at 90 days, this is where you deliver it.
- “Which of your coworkers should we hire more of, and do you know anyone like them?” Someone who has just decided to stay is a natural person to ask for a referral.
How to run the check-ins
Keep each one to fifteen minutes, on paid time, away from the floor. Have the buddy ask the day-30 questions if the manager is the problem. Log every answer under three headings (pay, schedule, manager), and compare the log against your source tags on the recruiting analytics page. Keep questions about the job; if a hire raises health, family or other personal circumstances, listen, point them to HR for any accommodation or leave process, and do not note it as a performance issue.
How to keep new hires engaged when the manager is on the floor
The objection to any cadence is that the manager is running a shift and can't run a program. Three answers. Make the touches texts, drafted once, sent from a template with the name and date filled in — a day −1 text takes eleven seconds. Give the buddy the day-7 and day-30 questions, because a peer gets a truer answer than a boss does and the manager gets the written answer either way. And put the day-90 raise in the ad, so the promise is public and the review is a formality; a promise in the ad is the cheapest engagement tool there is, provided it's kept. What doesn't work is the welcome packet — a hire who got a binder and no text on day −1 is a hire who was welcomed and then forgotten, and the data above says the first 100 days is when they decide.
This page prices the early exit specifically — the hire who leaves before day 90. For the whole-year figure across every role you fill, computed from your own headcount, turnover rate and replacement cost, use the turnover cost calculator.
For the wider picture — how your industry's quits rate compares with the rest of the economy, and whether your hiring difficulty is really a retention problem — our labor shortage page works through the BLS openings, hires and quits figures industry by industry.
One part of that arc has its own rules and its own arithmetic: the orientation session between the accepted offer and the first shift. What legally has to happen in it, and what it costs you in paid hours, is on new hire orientation.
Early attrition has a tax consequence people miss. The Work Opportunity Tax Credit pays its full rate only at 400 hours, about ten weeks of full-time work; our page on the WOTC tax credit works through what that means for a high-turnover operation.
New hire retention: the first day and the first week
New hires quit in the first week, or never show up on day one, mostly because something they were promised did not match what they found, or because nobody contacted them between the offer and the start. Both are decided before day one. The third-party figures above put the risk window in the first 100 days in home care, and the most expensive exit is the one that happens before the new hire has done any work.
When it happens anyway, handle it as data, not as a surprise:
- Call once, the same day. A short, non-judgmental call or text (“We missed you today. Is everything OK, and do you still want the job?”) recovers some no-shows, and the answer tells you why the others left.
- Go back to the runner-up. The candidate you did not hire last week is the fastest replacement you have. Keep the second-choice list warm until the new hire reaches day seven.
- Log the reason. Pay different from the ad, a shift that changed, a commute that was longer than it looked, a better offer: each points at a different fix, and after ten entries the pattern is obvious.
- Apply the attendance policy only once someone has started. A day-one no-show is a hiring failure; a no-show in week three is an attendance issue, handled under your no call no show policy.
When the fix isn't onboarding
Three cases where the cadence won't help. If the pay is below the employer two exits down, the hire will leave at day 30 with the stub in hand, and the honest fix is the pay or the ad — advertise the real number and let the people who'll work for it apply. If the shift is nights and the ad said flexible, the week-one quit is a recruiting problem: fix the first line (the job ad page). And if a channel's hires leave measurably faster than another's — which your tagged data will show — the problem is the channel's pool or its honesty, not the onboarding; the driver version of that story, agencies over-promising home time, is on the truck driver turnover page.
For the sector where early-tenure churn does the most damage to a hiring plan, retail employee turnover breaks the annual rate into the voluntary share and the part that leaves inside ninety days.
If you run a formal probationary period over those first weeks, our guide to the new hire probationary period covers how long it should be for hourly roles and what it does not change legally.
Frequently asked questions
What is first-90-days turnover?
The share of new hires who leave within their first 90 days — the interview no-shows, offer declines, day-one no-shows, week-one quits and 90-day exits that, in frontline work, make up most turnover. Home care's benchmarking report describes "the first 100 days when the risk is at its peak" (Activated Insights, 2025); Work Institute says "over one-third of newly hired employees quit within their first year." Boostpoint publishes no retention data; the figures here are third parties'.
How do you reduce new hire no-shows?
Close the gap between offer and start, and fill it with texts. Confirm the offer by text within the hour with the date, site, shift and pay; send paperwork a week out with the first-day details; and have the manager text by name the day before. Most day-one no-shows heard nothing between the offer and the start date. A start date within days of the offer beats one three weeks out, because the gap is where competing offers land. This is Boostpoint's practice, not a measured result.
How do you reduce onboarding drop-off?
Match the job to the ad and date the touches. Week-one quits are mostly expectation mismatches — the shift, the pay, the site or the manager turned out different from the ad — so the first fix is upstream, in the ad's first line. Then eight dated touches: offer day, day −7, day −1, day 1, day 7, day 30, day 60, day 90, with a buddy assigned on day one and a manager who asks "is the job what you expected?" on day seven and writes the answer down.
What is a normal 90-day turnover rate?
There's no single published figure, and we don't publish one. The industry annual figures are the reference: CNA turnover 42.34% in 2025 (AHCA/HCS report), home care caregivers 75% (Activated Insights, 2025), and truck drivers re-applying elsewhere after an average of 3.8 months (Tenstreet, 2026). Your own 90-day share is last quarter's starts against today's roster, and it's the number the calculator on this page uses.
How much does early turnover cost?
Your replacement cost times your early quits, plus the advertising to re-find applicants. SHRM's cross-industry average cost per hire is "nearly $4,700" (April 2022), a placeholder for your figure. The advertising side is your applicants-per-hire ratio times the role's cost per applicant — $13.88 median across our 2026 benchmark — and it is not a cost per hire. Forty hires a year with 30% gone by day 90 is 12 early quits; at $4,700 each that's $56,400, and re-finding 72 applicants at the median is about $999 of media.
Does the recruiting channel affect early turnover?
It can, and your tagged data will show it. Tenstreet's 2026 analysis found referred drivers 12 times more likely to be hired than the platform average; the truck driver turnover page describes agencies over-promising home time and hires leaving when the truth arrives. Tag every hire's source, count who's still there at day 90 by source, and let the number decide. We publish no retention data by channel and don't claim ours is better.
What should happen in the first week?
The manager who interviewed them meets them on day one, a buddy is assigned before lunch, the first day ends on time, and on day seven the manager asks one question — "Is the job what you expected?" — and records the answer. The answer is the gap between the ad and the job, and it's the cheapest piece of recruiting feedback you'll get all year.
Does Boostpoint have retention data?
No. Our data ends at the application; we see applicants, not starts or 90-day survivors, and we don't compute a cost per hire or a retention rate from ad data. What we can say is that the first line of the ad sets the expectation the hire arrives with, and that click-to-application conversion explained 70% of the variation in cost per applicant across our 2026 benchmark. The turnover figures on this page are AHCA's, Activated Insights', Tenstreet's, the BLS's, Work Institute's and SHRM's.
What should I do when a new hire quits after one day, or doesn’t show up on day one?
Contact them once the same day to ask whether they still want the job and why they left or did not come, then go straight to your runner-up candidate while that person is still available. Log the reason: most early exits trace back to a gap between the job ad and the job, or to no contact between offer and start, and both are fixable before the next hire.
What questions should you ask a new hire at 30 days?
Ask whether the job matches what they expected when they applied, whether their paycheck and schedule are what they were promised, what they still have not been shown how to do, and who they go to when they are stuck. Have the pay stub in hand. The goal at day 30 is to find any gap between the ad and the job while it can still be fixed.
What should a 90-day check-in cover?
A 90-day check-in should cover what the new hire wishes they had known on day one, what they need from their manager for the next year, your honest view of their performance with an example, and what happens to their pay now. If the job ad promised a raise at 90 days, deliver it in this meeting. It is also a good moment to ask for referrals.
Write the ad the hire will still recognize at day 90
Bring your last quarter's starts and who's still there. We'll build the ad with the wage, the shift and the site in the first line, the three-question form, and the same-day reply — and show you how to tag the source so day-90 survival by channel is a number you own.
Book a DemoThird-party figures: AHCA/NCAL, "2025–2026 Nursing Home Report Reveals Lower Turnover," September 9, 2025, summarizing the 2025–2026 Nursing Home Salary & Benefits Report by the Hospital & Healthcare Compensation Service (917 nursing homes, more than 111,600 employees, 102 positions) — CNA turnover 42.34% in 2025, 44.16% in 2024; Activated Insights, 16th Annual Benchmarking Report for Home Care, Home Health and Hospice, July 1, 2025 — caregiver turnover 75%, "the first 100 days when the risk is at its peak"; Tenstreet analysis of approximately 5,000 carriers, June 4, 2026 — new applications after an average of 3.8 months, referred drivers 12 times more likely to be hired; BLS JOLTS, June 2026, released August 4, 2026 — quits rate 4.5% accommodation and food services, 2.0% total nonfarm; Work Institute first-year turnover page (undated) — "over one-third of newly hired employees quit within their first year"; SHRM, average cost per hire "nearly $4,700," April 11, 2022. Boostpoint publishes no retention data of its own; every cadence step is practice, not a measured result. Boostpoint figures from the 2026 Social Job Advertising Benchmark — 891 campaigns and 1,334 campaign-months: conversion explaining 70% of cost variation; median $13.88 per applicant, $8.02 volume-weighted, percentiles $2.91 and $66.45. The calculators compute on the reader's inputs. Cost per applicant is not cost per hire; we do not track hires and publish no cost-per-hire figure. A sample of Boostpoint campaigns, not an industry-wide study.