
Is There a Labor Shortage? What the Hiring Data Actually Shows
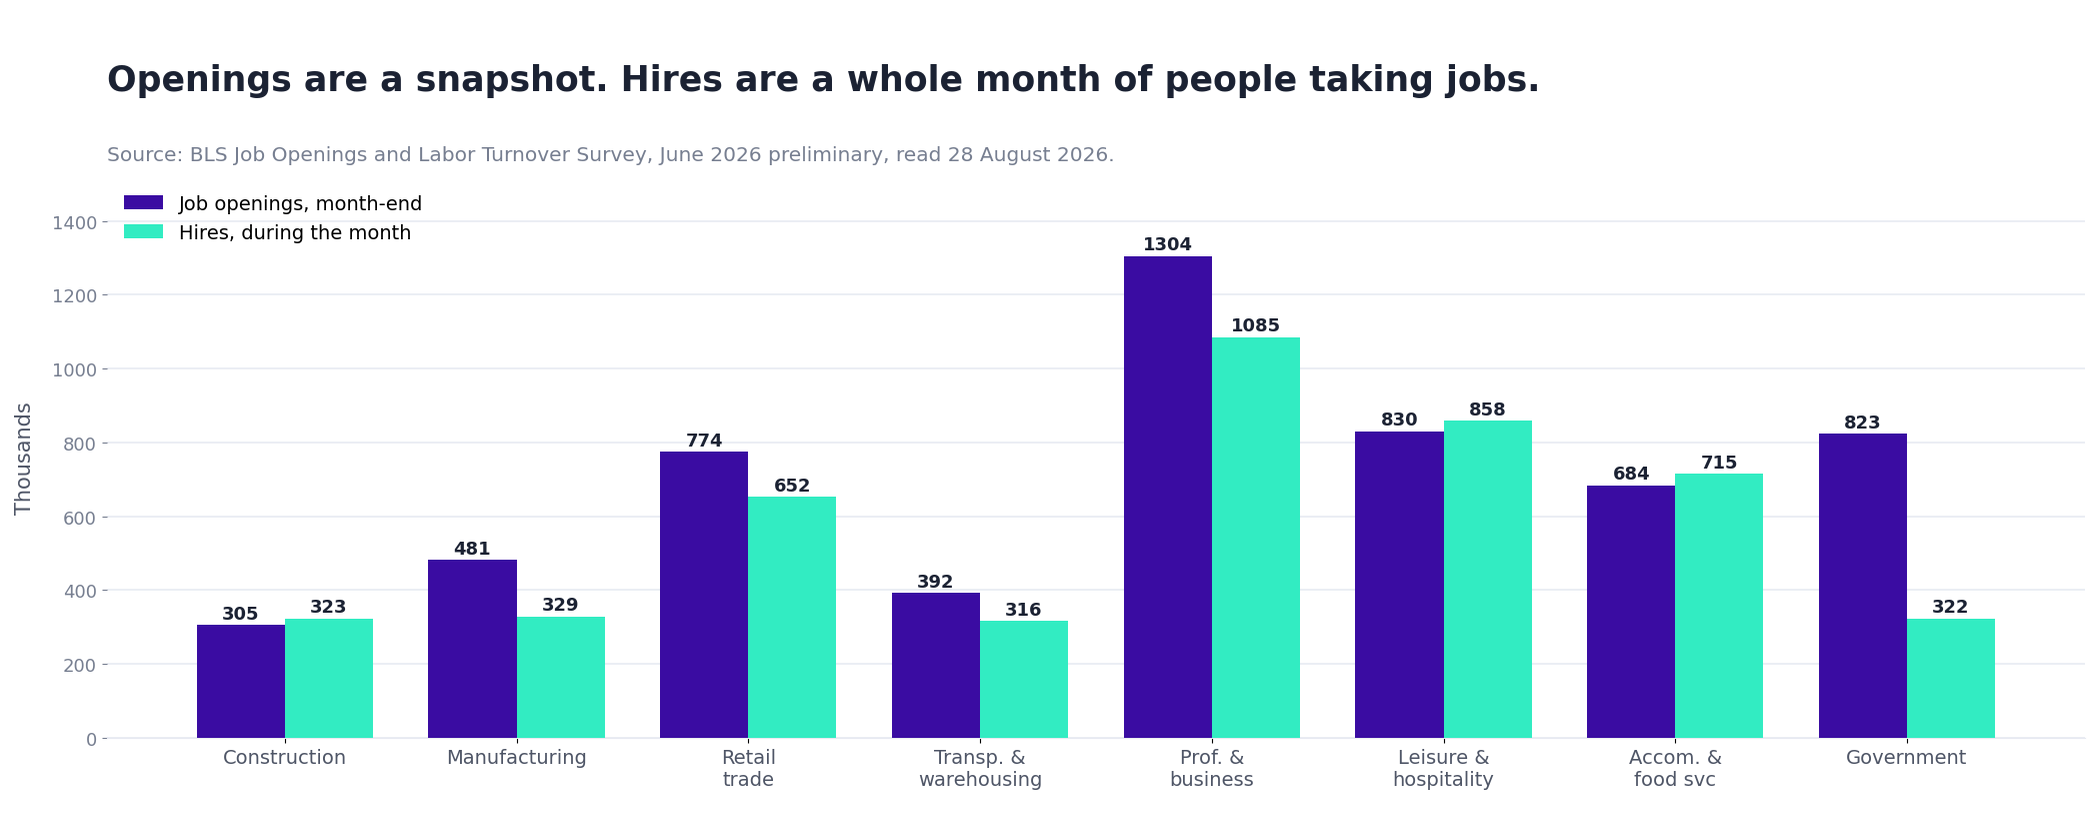
In three of the industries that complain loudest about it — construction, leisure and hospitality, and accommodation and food services — more people were hired during June 2026 than there were job openings at the end of it. That is not what an empty labor market looks like. Where a genuine shortage does exist, it is concentrated in work that a license or certification gates; everywhere else the openings number is measuring turnover replacing itself.
A note on who's writing this
Boostpoint sells recruitment advertising, so "there is no shortage, you just need better ads" would be a convenient conclusion for us. This page does not make that argument. Some shortages are real and no amount of advertising fixes them. What we can do is separate the two cases using data neither of us controls: every labor-market figure below comes from the U.S. Bureau of Labor Statistics Job Openings and Labor Turnover Survey for June 2026, released 4 August 2026 and read on 28 August 2026.
For the non-certified end of care work, our caregiver shortage analysis has the federal openings data and what a caregiver applicant actually costs.
What "labor shortage" means once you look at the measurements
The phrase gets used for three different things, and JOLTS measures them separately:
- Job openings — positions open on the last business day of the month that an employer is actively recruiting for. A stock, measured at a moment.
- Hires — every addition to a payroll during the month. A flow, measured across the whole period.
- Quits — voluntary separations during the month, the standard proxy for how confident workers feel about finding something else.
Comparing a stock against a flow is where most of the argument goes wrong. "There are 7.4 million job openings" sounds like 7.4 million jobs nobody will do. In the same month, 5.3 million people were hired — total nonfarm openings were 7,359,000 against 5,348,000 hires, an openings rate of 4.4% against a hires rate of 3.4%. The vacancy count is not a queue of unwanted jobs; it is a snapshot of a conveyor that is constantly refilling.
The numbers, by industry
All figures are June 2026, preliminary, in thousands.
| Industry | Openings | Hires | Quits | Openings per hire |
|---|---|---|---|---|
| Total nonfarm | 7,359 (4.4%) | 5,348 (3.4%) | 3,232 (2.0%) | 1.38 |
| Construction | 305 (3.5%) | 323 (3.9%) | 143 (1.7%) | 0.94 |
| Manufacturing | 481 (3.7%) | 329 (2.6%) | 192 (1.5%) | 1.46 |
| Trade, transportation and utilities | 1,330 (4.4%) | 1,118 (3.9%) | 732 (2.5%) | 1.19 |
| Retail trade | 774 (4.8%) | 652 (4.2%) | 471 (3.0%) | 1.19 |
| Transportation, warehousing and utilities | 392 (5.2%) | 316 (4.4%) | 171 (2.4%) | 1.24 |
| Professional and business services | 1,304 (5.5%) | 1,085 (4.8%) | 488 (2.2%) | 1.20 |
| Leisure and hospitality | 830 (4.7%) | 858 (5.1%) | 704 (4.2%) | 0.97 |
| Accommodation and food services | 684 (4.6%) | 715 (5.0%) | 638 (4.5%) | 0.96 |
| Government | 823 (3.4%) | 322 (1.4%) | 186 (0.8%) | 2.56 |
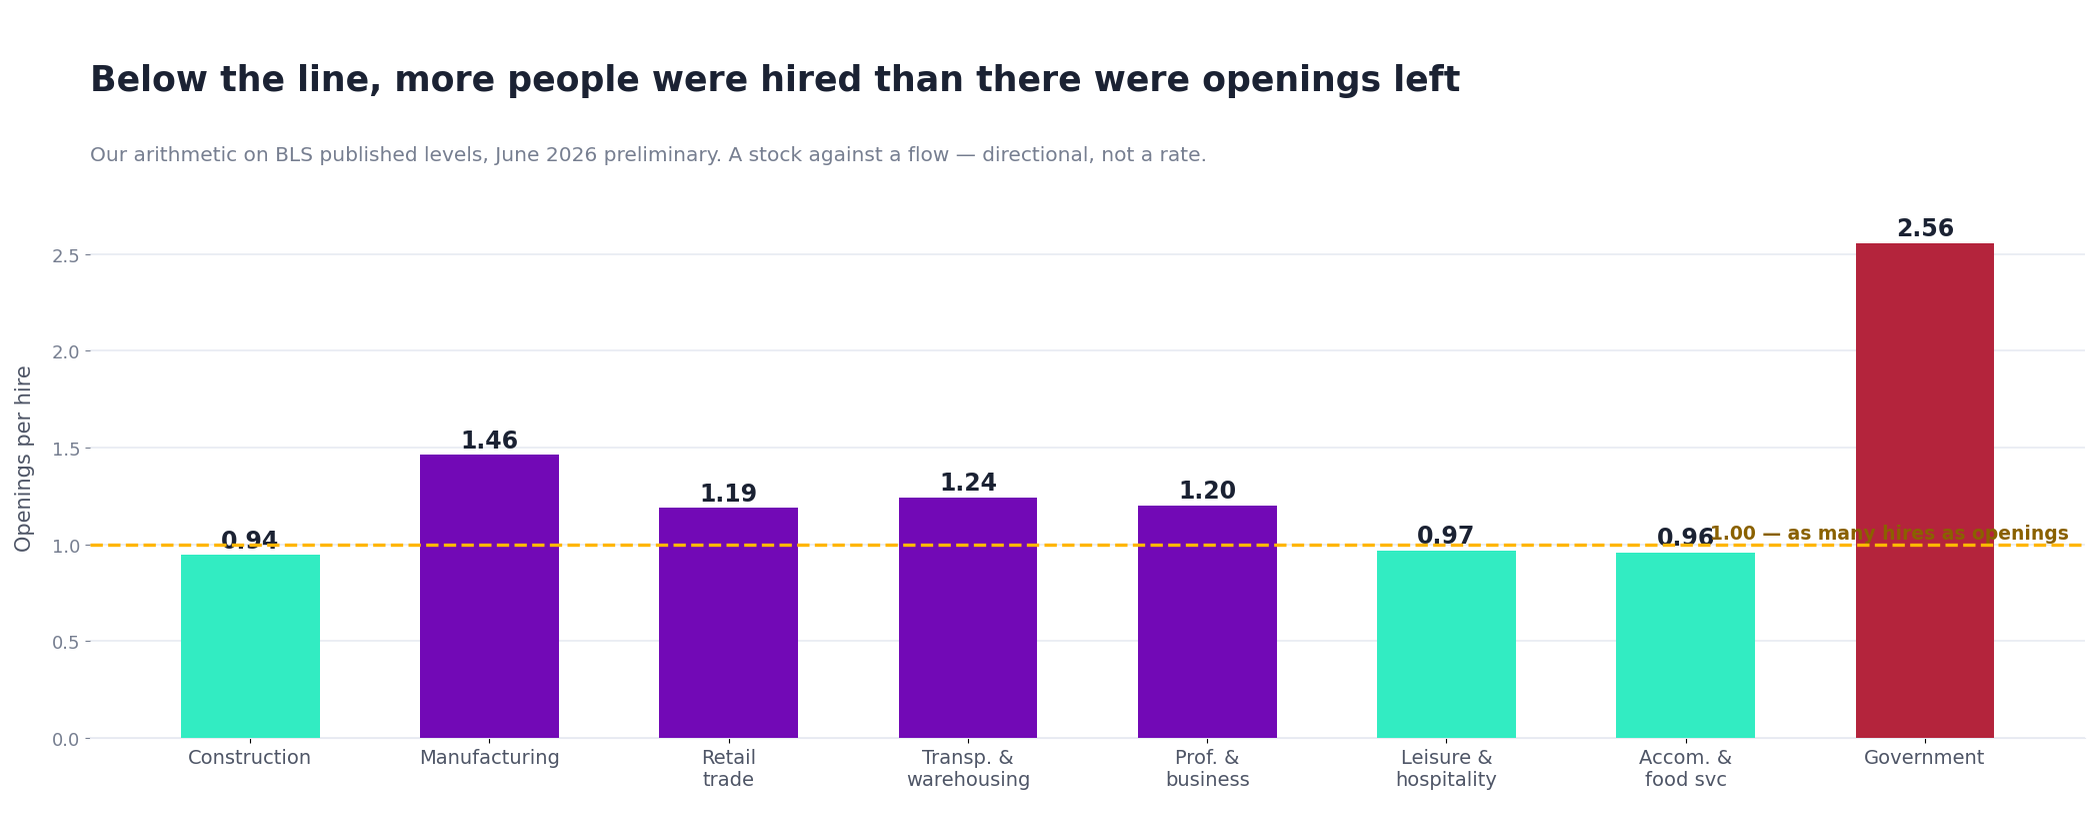
Read the last column first. Anything below 1.00 means the industry hired more people during the month than it had openings left at the end of it. Construction (0.94), accommodation and food services (0.96) and leisure and hospitality (0.97) are all below the line. Government sits at 2.56 — nearly eight times construction's gap — and manufacturing at 1.46.
Find your industry
Pick the industry you hire in. The panel shows what JOLTS published for June 2026 and what the gap between openings and hires actually implies for you.
Trucking has its own page here, where the federal openings projections are taken apart rather than summarized: the truck driver shortage.
Where the shortage is real
Two signatures in the table mark a genuine supply constraint rather than a hiring one.
The first is a high openings ratio next to a low hires rate. Government is the clearest case: a 3.4% openings rate against a 1.4% hires rate, 2.56 openings per hire. Manufacturing shows a milder version — 3.7% openings against a 2.6% hires rate. In both, employers are not failing to attract interest so much as failing to convert it inside a process that includes background checks, credential verification and approval steps measured in weeks.
The second is a credential gate. Where a role legally requires a license — a CDL, an RN license, a state trade card, a pesticide applicator license — the pool is fixed in the short run and no ad reaches somebody who does not hold the credential. Our own campaign data shows the same pattern from the other side: in the 2026 benchmark, licensed and credentialed roles convert far worse than open-entry ones. Registered nurse campaigns saw 11% of clickers complete an application and CDL driver campaigns 8%, against 31% for caregivers and 25% for customer service. Cost follows: a median $19.08 per applicant for RNs and $26.86 for CDL drivers against $3.76 for caregivers.
A useful test: if you removed every requirement that is not legally mandatory, would your applicant pool grow? If yes, you have a specification problem. If no, you have a genuine shortage — and the answer is a training pipeline, not a bigger ad budget.
Where it is not a shortage
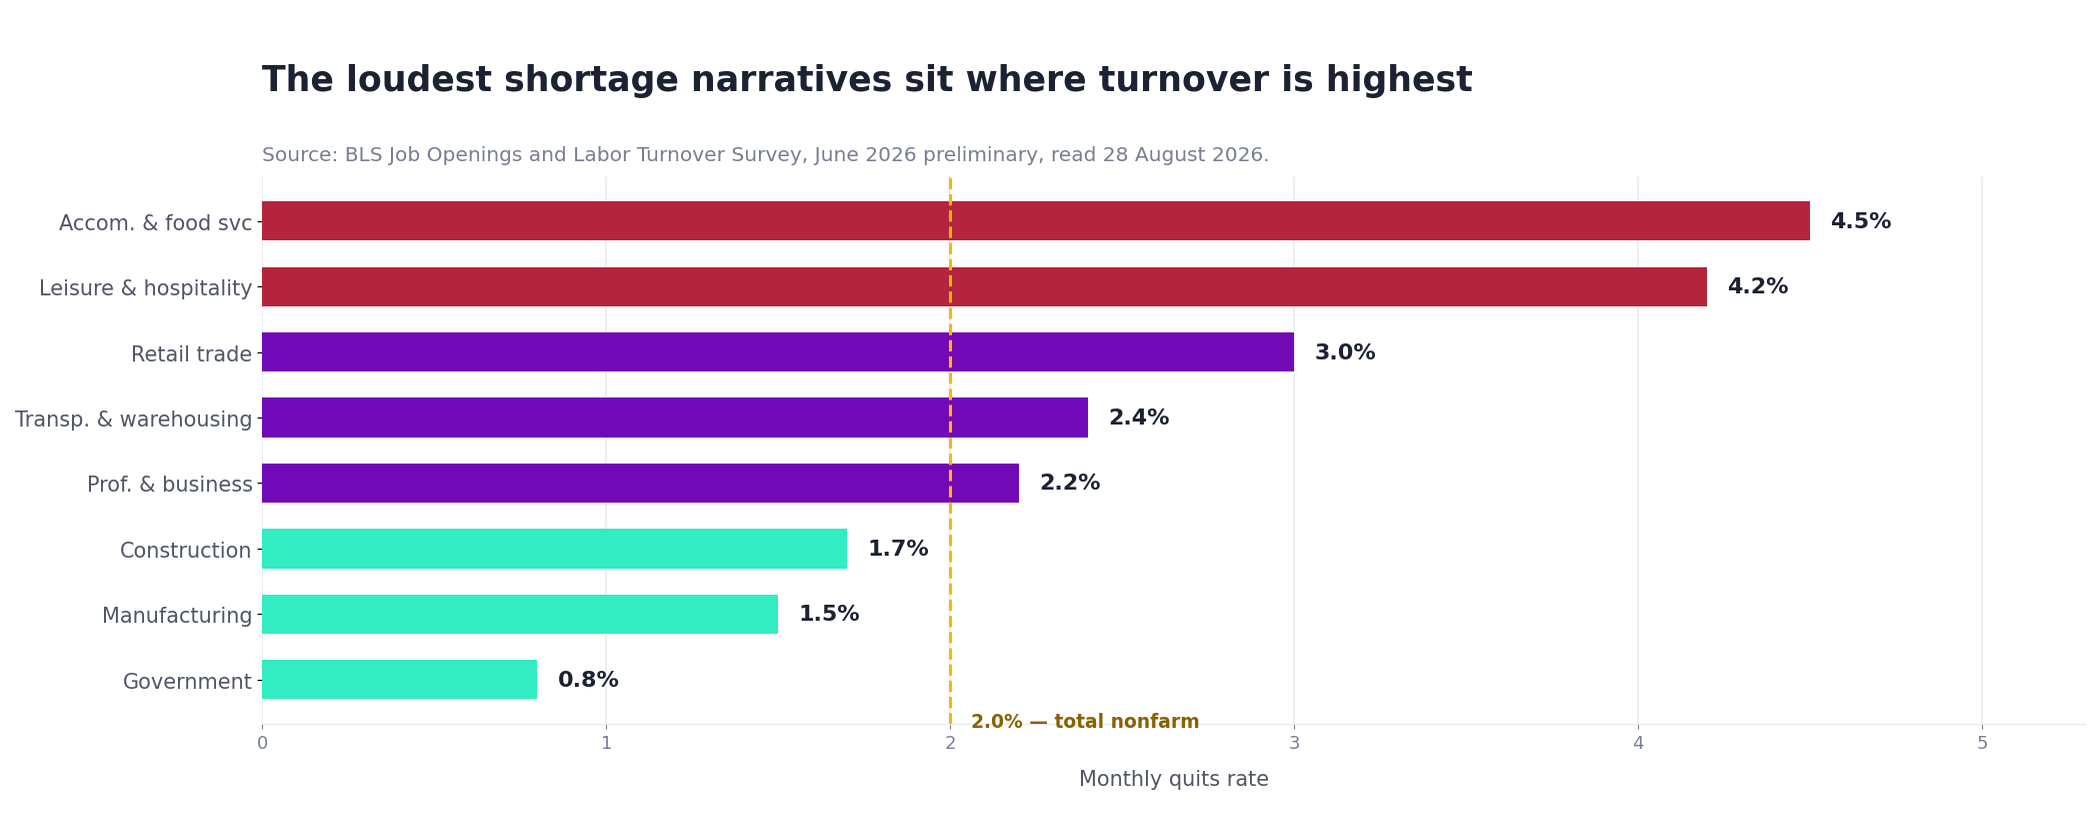
Accommodation and food services is the category most often held up as proof that nobody wants to work. In June 2026 it made 715,000 hires against 684,000 openings, and it also recorded 638,000 quits — a 4.5% monthly quits rate, the highest in the table. Almost nine in ten of the hires that month were replacing somebody who left.
That is a retention problem wearing a recruitment problem's clothes. At a 4.5% monthly quits rate, a hundred-person restaurant group is replacing roughly half its workforce a year before it grows at all. Leisure and hospitality overall runs at 4.2%, retail at 3.0%. Compare those with manufacturing at 1.5% and construction at 1.7% — categories with real hiring difficulty and far less churn. Our first 90 days page covers where those exits actually happen, and the turnover cost calculator puts a number on them.
If the phrase you actually hear in your business is the blunter one, we take it apart with the same figures on “no one wants to work anymore” — including a benchmarker that puts your own turnover on the BLS industry scale.
“Worker shortage”, “workforce shortage”, “labor shortage”: three names, one ratio
The three phrases get used interchangeably and they all resolve to the same question: are there enough people available for the jobs that are open? There is a published number for exactly that. Divide the count of unemployed people by the count of job openings and you get how many available workers exist for every open job.
Across January to July 2026 that ratio averaged 1.01 — almost exactly one unemployed person for every opening. In July it was 0.95. At the 2022 peak, the period in which most worker-shortage coverage was written, it was 0.54: roughly one available worker for every two openings. In 2019, before any of it, it was 0.84.
Read those in order: 0.84 in 2019, 0.54 in 2022, 1.01 so far in 2026. On the one ratio that measures worker availability directly, the national labor market in 2026 is looser than it was before the pandemic. Whatever is making a particular role hard to fill, a national shortage of people is not the cause.
The sector table is the part worth acting on. The openings rate is unfilled jobs as a share of all filled and unfilled jobs in that industry, so it is comparable across industries of very different sizes — and comparable to the same industry seven years ago.
| Industry | Openings rate 2026 | Openings rate 2019 | Change |
|---|---|---|---|
| Health care and social assistance | 5.6% | 5.5% | +0.1 pt |
| Manufacturing | 3.8% | 3.3% | +0.5 pt |
| Total nonfarm | 4.4% | 4.5% | −0.2 pt |
| Retail trade | 4.4% | 4.8% | −0.4 pt |
| Accommodation and food services | 5.1% | 5.8% | −0.7 pt |
| Construction | 3.1% | 4.1% | −1.0 pt |
Source: BLS Job Openings and Labor Turnover Survey, seasonally adjusted openings rate, monthly averages calculated by Boostpoint from the full series. 2026 covers January to July; 2019 covers all twelve months. JOLTS figures for the most recent months are preliminary and revise.
Two industries carry a larger share of unfilled jobs than they did in 2019, and only two: health care and social assistance, and manufacturing. Everything else is at or below its 2019 rate. Construction — which produced some of the loudest workforce-shortage coverage of the last five years — is a full percentage point below where it was, and accommodation and food services is 0.7 of a point below.
That is the practical use of the distinction. If you hire into health care or manufacturing, the tightness is real and structural, and the answer is a pipeline: apprenticeships, clinical placements, a training partnership, and pay that clears the local ladder. If you hire into construction, retail or food service, the openings rate says the people are there in at least the numbers they were in 2019, and the thing to examine is the job, the ad and the time it takes you to answer an application — not the size of the workforce.
The restaurant labor shortage, specifically
Restaurants sit at the sharp end of this: hires above openings, the highest quits rate published, and the loudest public narrative. The practical reading is that the market is not short of people willing to work in restaurants — it moves them between restaurants constantly, and the operator who wins is the one who stops the leak rather than the one who shouts loudest into the same pool. What that looks like in practice is on our cost per hire for restaurants and hospitality recruiting pages.
Warehouse, retail and security labor shortages
Warehouse labor shortage. JOLTS reports warehousing inside transportation, warehousing and utilities, which had 392,000 openings in June 2026, a 5.2 percent openings rate, against 316,000 hires — about 1.24 openings for every hire. Hiring is happening at volume; the constraint for most warehouse employers is how fast they can reach and process applicants, not a workforce that has disappeared. Our warehouse recruiting page has the role-level data.
Retail labor shortage and grocery store labor shortage. Retail trade, which includes grocery stores, had 774,000 openings (4.8 percent) and 652,000 hires in June 2026, with a 3.0 percent monthly quits rate. JOLTS does not publish grocery separately. A 3 percent monthly quits rate means a store is replacing a large share of its staff every year, which is a churn problem before it is a supply one; see retail recruitment strategies.
Security guard shortage. JOLTS does not break out security services, so the occupational projections are the better measure. BLS counts about 1,294,300 security guard jobs in 2025, projects growth of about 1 percent to 2035, and still projects about 156,000 openings a year — about 12 for every 100 jobs, nearly all of them replacements. The median wage was $18.28 an hour in May 2025. See how to hire security guards.
Which industries have labor shortages in 2026
On the most recent federal data, the industries with labor shortages in 2026 are health care and social assistance and manufacturing, where job openings stay high while the hires rate stays low. Construction and food service hire faster than they post, and retail hires close to its openings rate; their problem is mostly people leaving, not people missing. The July 2026 JOLTS release, published after the June table above, shows the same split.
Labor shortage by industry: the July 2026 figures
| Industry | Openings (thousands) | Openings rate | Hires rate | Quits rate |
|---|---|---|---|---|
| Health care and social assistance | 1,438 | 5.7% | 2.8% | 1.9% |
| Durable goods manufacturing | 429 | 5.2% | 2.2% | 1.4% |
| Professional and business services | 1,138 | 4.8% | 4.0% | 1.8% |
| Retail trade | 731 | 4.5% | 4.0% | 3.1% |
| Accommodation and food services | 673 | 4.5% | 5.2% | 3.5% |
| Manufacturing (all) | 580 | 4.4% | 2.3% | 1.4% |
| Transportation, warehousing and utilities | 316 | 4.2% | 3.9% | 2.2% |
| Construction | 326 | 3.8% | 4.4% | 1.9% |
| Government | 810 | 3.4% | 1.3% | 0.8% |
| Total nonfarm | 7,271 | 4.4% | 3.2% | 1.9% |
Source: BLS JOLTS news release tables 1, 2 and 4, July 2026 preliminary, seasonally adjusted, read September 24, 2026. Seasonally adjusted figures differ from the not seasonally adjusted June figures earlier on this page, so compare within a table, not across them. July figures will be revised.
How to read it for your own industry:
- A shortage looks like a high openings rate next to a low hires rate. Health care and social assistance had a 5.7% openings rate and a 2.8% hires rate in July, the highest openings rate of any industry in the release. Manufacturing ran 4.4% against 2.3%, and durable goods manufacturing 5.2% against 2.2%. Government also fits the pattern, at 3.4% against 1.3%. Our healthcare workforce shortage and manufacturing labor shortage pages go role by role.
- Churn looks like hires at or above openings, with a high quits rate. Accommodation and food services hired at 5.2% against a 4.5% openings rate with a 3.5% quits rate. Retail hired at 4.0% with a 3.1% quits rate. These employers are hiring constantly and losing people nearly as fast; see the restaurant labor shortage.
- Construction is hiring faster than it posts. A 4.4% hires rate against a 3.8% openings rate in July. Where a trade is hard to fill, look first at the credential and the season rather than the national pool; the skilled trades shortage page has the trade-level figures.
- Transportation and warehousing sits in between. 4.2% openings against 3.9% hires. Credentialed lanes such as CDL driving behave like a shortage; general warehouse work behaves like churn.
The openings rate is openings as a share of employment plus openings, and the hires and quits rates are shares of employment, as BLS publishes them. The comparison is directional, not a count of missing workers.
What actually moves the number
If your openings-per-hire ratio is under 1.25 and your quits rate is high, you are in a churn market and the levers are retention, schedule and the first ninety days. If your ratio is above 1.75 with a low hires rate, look at process time before supply — every week between application and offer loses candidates who took something else. And if the constraint is a credential, the honest answer is that advertising cannot manufacture license-holders; a paid training pathway can.
One more thing worth measuring before you conclude anything: the time between an application arriving and somebody speaking to that person. In categories with a 4% monthly quits rate, the people applying to you are usually applying to two or three other employers in the same week, and the one who calls first wins by default rather than by offer. That is a scheduling decision inside your own building, and it costs nothing.
Where advertising does move the number is the middle case, which is most frontline hiring: the qualified people exist, they are employed, and they are not reading job boards. That is a reach problem, and it is the one thing on this page we do sell. The channel logic is in the best way to recruit, and what the ad has to say is in job ad copywriting.
The shortage is real where a license gates the work. Everywhere else, the openings count is measuring your own turnover coming back around.
Frequently asked questions
Is there really a labor shortage in 2026?
It depends entirely on the industry. In June 2026 the U.S. had 7,359,000 job openings and made 5,348,000 hires in the same month. Construction, leisure and hospitality and accommodation and food services all hired more people during the month than they had openings at the end of it. Government, at 2.56 openings per hire, is the clearest genuine gap in the published table.
What is the difference between job openings and hires?
Job openings are counted on the last business day of the month — a snapshot of positions still being recruited for. Hires count every addition to a payroll across the whole month. One is a stock and the other is a flow, so a large openings number does not mean those jobs went unfilled; it means the position was still open on the day BLS counted.
Which industries have the biggest worker shortage?
By openings per hire in June 2026, government leads at 2.56, followed by manufacturing at 1.46 and transportation, warehousing and utilities at 1.24. The pattern in the high-ratio categories is a low hires rate alongside a moderate openings rate, which usually points to credential requirements and long approval processes rather than an absence of interested people.
Is the staffing shortage really a retention problem?
In several industries, yes. Accommodation and food services recorded 638,000 quits in June 2026 — a 4.5% monthly rate — against 715,000 hires. At that rate the sector replaces most of its workforce over a year before growing at all. Manufacturing, by contrast, quits at 1.5% a month and has a much wider openings gap, which is a genuinely different problem.
What is a normal quits rate?
Total nonfarm quits ran at 2.0% a month in June 2026, or 3,232,000 people. Anything at or below that is unremarkable; construction at 1.7% and manufacturing at 1.5% are low. Retail at 3.0%, leisure and hospitality at 4.2% and accommodation and food services at 4.5% are the outliers, and those are the industries where retention work pays back faster than recruitment work.
Why can't I find workers even though unemployment exists?
Usually because the people who can do the job already have one. Job boards reach people actively searching; in most frontline and licensed categories that is a minority of the qualified pool. Where the constraint is a credential, no channel reaches somebody who does not hold it. Where it is reach, paid social advertising puts the role in front of employed people who were not looking.
Does raising pay fix a labor shortage?
It moves people between employers, which fixes your shortage and not the market's. That is a legitimate strategy and often the fastest one, but it works best when the pay is stated in the advertisement rather than discovered at interview. Where a credential gates entry, higher pay competes for a fixed pool and does not enlarge it — a training pathway does.
Where does this data come from?
The U.S. Bureau of Labor Statistics Job Openings and Labor Turnover Survey for June 2026, released 4 August 2026, read from bls.gov on 28 August 2026. All figures are preliminary. Education and health services is excluded from the openings-per-hire comparison because the BLS openings and hires tables publish different aggregates for it.
Is there a worker shortage in 2026?
Not nationally. Across January to July 2026 there was an average of 1.01 unemployed people for every job opening, against 0.84 in 2019 and 0.54 at the 2022 peak. By the ratio that measures worker availability directly, the market is looser than it was before the pandemic. Specific industries are tight — health care and manufacturing both carry a higher openings rate than they did in 2019 — but the country as a whole does not have fewer available workers per opening than it used to.
What is the difference between a labor shortage and a workforce shortage?
In practice, nothing. Both phrases describe the same claim: that there are not enough people available for the work. The distinction that does matter is between a shortage of people and a shortage of applicants for one employer's specific job at its specific pay, schedule and requirements. The first is measured with the unemployed-per-opening ratio and the industry openings rate. The second is measured with your own apply rate and time to fill, and it is far more common.
Which industries actually have a workforce shortage?
On 2026 data against 2019, two: health care and social assistance, at a 5.6% openings rate against 5.5% in 2019, and manufacturing, at 3.8% against 3.3%. Total nonfarm is at 4.4% against 4.5%. Retail (4.4% against 4.8%), accommodation and food services (5.1% against 5.8%) and construction (3.1% against 4.1%) all carry a smaller share of unfilled jobs than they did in 2019.
Which industries have labor shortages?
The ones where openings are high relative to the employed base and the shortage survives a look at pay: healthcare and social assistance, skilled trades and field service, transportation and warehousing in specific lanes, and parts of manufacturing that need a credential. The table above gives the figures by industry. Several sectors commonly described as short — retail and food service among them — have very high turnover rather than a shortage of people, which is a different problem with a different fix.
Why is there a labor shortage?
Usually four things at once, and only one of them is a shortage of people: demographics shrinking the entry pool, a credential or license that limits who can legally do the work, pay that has not kept pace with the alternative job in the same town, and turnover recycling the same vacancy several times a year. The last two are the ones an individual employer controls, and they are the ones that explain why two businesses in the same market with the same “shortage” fill at completely different rates.
What are the solutions to a labor shortage?
In the order that actually moves the number: fix the leak before the pour — a role turning over three times a year needs retention work, not more advertising; state the pay and schedule in the posting so applicants self-select; widen the catchment radius rather than the requirements; reach people who are employed and not searching, because in a tight category the actively-looking pool is smaller than the unemployment rate suggests; and drop requirements that are preferences. Raising pay works and is the most expensive option, which is why it should be the one you reach for after the other five.
Is there a warehouse labor shortage?
Openings are high relative to hires. In June 2026, transportation, warehousing and utilities had 392,000 job openings, a 5.2 percent rate, and 316,000 hires, according to BLS JOLTS. For most warehouse employers the constraint is speed of hiring and reach rather than a shortage of people able to do the work.
Is there a security guard shortage?
Security employers face constant replacement hiring. BLS projects about 156,000 openings a year for security guards through 2035, against about 1.29 million jobs and growth of about 1 percent, so nearly all openings replace people who leave. The median wage was $18.28 an hour in May 2025.
For the trades specifically, rather than the whole economy, see the skilled trades shortage, measured, which separates the openings data from the replacement arithmetic.
Work out which problem you actually have
We will show you what your roles have cost other employers in your vertical and market, from 891 campaigns — and say plainly when advertising is not the lever.
Hiring in a tight market also means keeping the compliance side cheap and correct. Every required workplace notice is a free download — we link the official source for all 51 jurisdictions in labor law posters by state.
Methodology and sources. Labor-market figures: U.S. Bureau of Labor Statistics, Job Openings and Labor Turnover Survey, June 2026 (preliminary), released 4 August 2026 and read from bls.gov on 28 August 2026 — the summary release and tables 1 (openings), 2 (hires) and 4 (quits). Levels are in thousands; rates are computed by BLS as a share of employment plus openings for the openings rate and of employment for hires and quits. Openings are measured on the last business day of the month while hires and quits are measured across the month, so the openings-per-hire column is a directional comparison of a stock against a flow and not a rate; it is our arithmetic on the published levels, not a BLS statistic. Education and health services appears in the industry table only where BLS publishes matching aggregates and is excluded from the openings-per-hire comparison, because the openings table reports "education and health services" while the hires table reports "private education and health services". Boostpoint figures come from the Boostpoint 2026 Social Job Advertising Benchmark — 891 Boostpoint-managed campaigns on Meta across 1,334 campaign-months, advertising costs only: apply rates of 11% for registered nurse and 8% for CDL driver campaigns against 31% for caregiver and 25% for customer service, and median costs per applicant of $19.08, $26.86 and $3.76 respectively. Cost per applicant is not cost per hire; hires are recorded in your applicant tracking system, not in an ad platform. See the full benchmark report.
Before assuming the shortage is yours, check the local market: our unemployment rate by state table has all 51 jurisdictions for July 2026 with a plain reading of what each figure means for filling a role, and our analysis of the bus driver shortage shows what a genuine churn-driven shortage looks like in the data.