Employer guideRead at source, 8 September 2026
Truck Driver Shortage 2026: What the Numbers Say, and Why Empty Seats Are Usually a Reach Problem
The truck driver shortage is mostly seats reopening rather than drivers who do not exist, and reaching the drivers who could fill them has a measurable price: in Boostpoint’s 2026 Social Job Advertising Benchmark, CDL truck driver campaigns ran a median of $26.86 per applicant. The Bureau of Labor Statistics projects 367,200 truck driver openings a year over 2025 to 2035 — 214,500 for heavy and tractor-trailer drivers and 152,700 for delivery drivers and driver/sales workers. Employment across both occupations grows by 186,800 over the whole decade, which is about 18,680 a year. Do the subtraction and 95% of those annual openings are replacement: seats reopening rather than seats being created. The most quoted shortage figure, 80,000, comes from a trade association and describes one segment of the industry. Against 3.7 million people already doing the job, the seat you cannot fill is far more often a seat the right driver never saw.
What 367,200 openings a year is actually counting
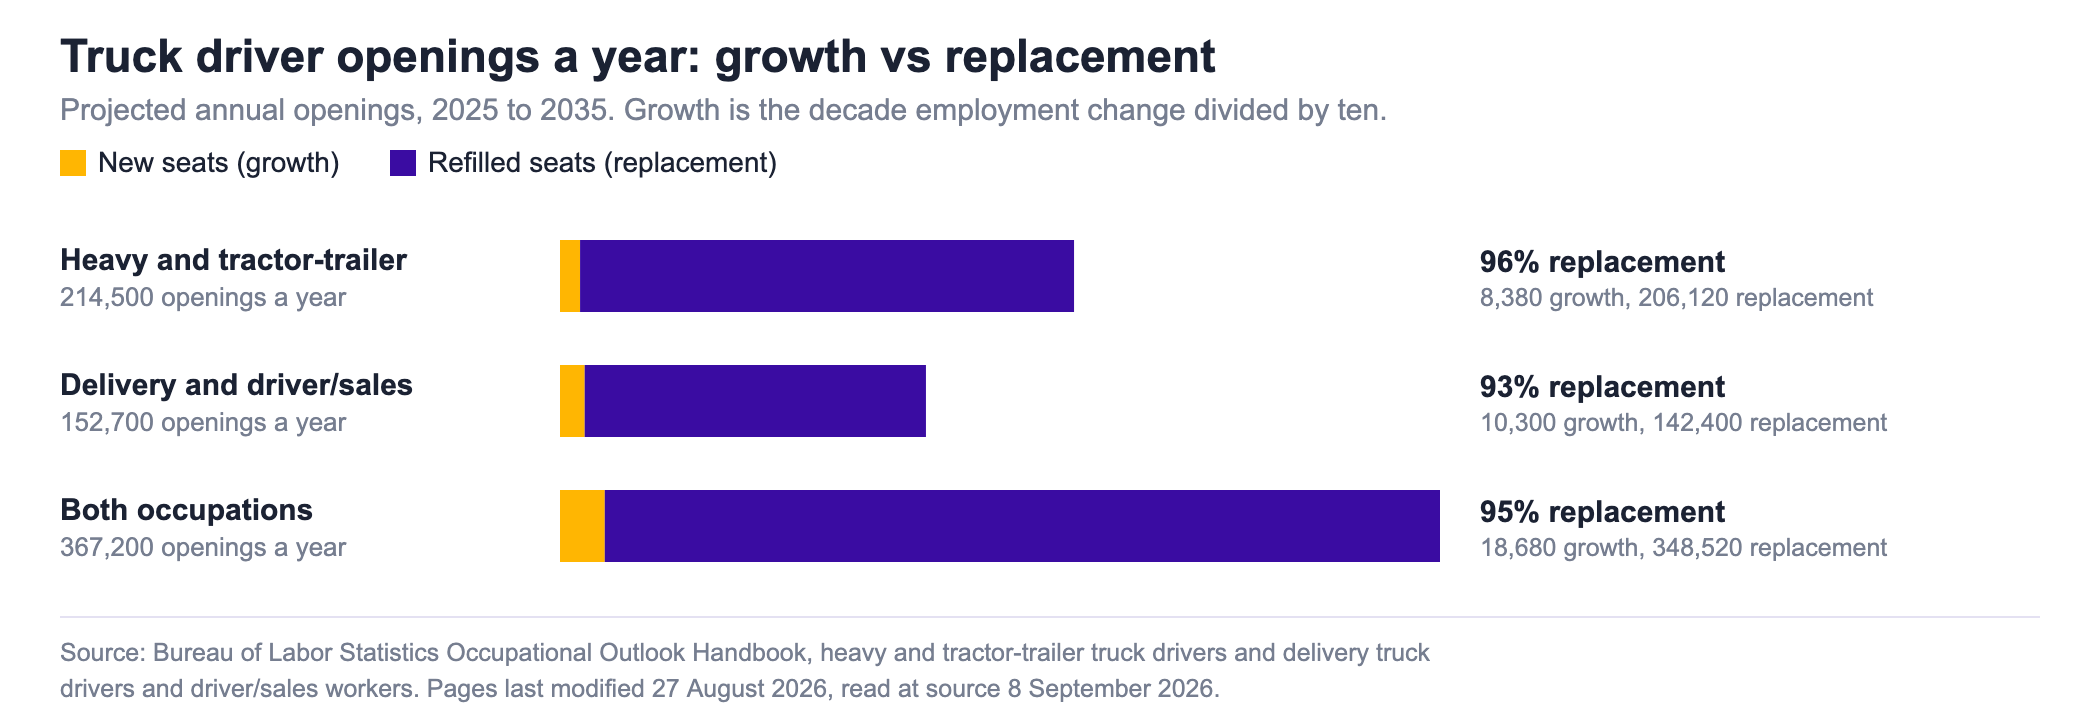
Two numbers sit on the same government page and are almost never printed together. The first gets quoted constantly: about 214,500 openings each year for heavy and tractor-trailer drivers. The second gets left out: employment in that occupation is projected to grow 4% across the decade, from 2,221,200 to roughly 2,305,000, a change of 83,800 people in ten years.
Divide that decade change by ten and you get about 8,380 new seats a year against 214,500 openings. Roughly 96% of the annual openings in the long-haul occupation are replacement — a person who used to hold the seat and does not any more, whether they moved to another carrier, moved to a local run, or left driving entirely. Delivery and driver/sales work is growing faster, at 7% over the decade, and even there replacement accounts for 93% of annual openings.
Why growth and replacement are different budget lines
If the problem is growth, a bigger pipeline is the answer and advertising is an investment. If the problem is replacement, a bigger pipeline refills a bucket with a hole in it, and what decides the return on the same money is how long the drivers you seat stay seated. The federal projection says replacement by roughly nineteen to one. That is not an argument for advertising less. It is an argument for treating the advertising budget as a running cost you size accurately, and for putting the improvement effort on the rate that sets it. We put a dollar figure on the churn side in truck driver turnover costs and retention.
| Measure | Heavy and tractor-trailer | Delivery and driver/sales |
|---|---|---|
| People employed, 2025 | 2,221,200 | 1,511,400 |
| Projected openings a year | 214,500 | 152,700 |
| Employment change, 2025 to 2035 | 83,800 (4%) | 103,000 (7%) |
| Growth openings a year | About 8,380 | About 10,300 |
| Replacement share of openings | 96% | 93% |
| Median pay, 2025 | $58,640 a year, $28.19 an hour | $43,950 a year, $21.13 an hour |
| Typical entry-level education | Postsecondary nondegree award | High school diploma or equivalent |
The 80,000 figure, and what sits under it
The number almost every article opens with comes from the American Trucking Associations. On 25 October 2021 its chief economist put the shortage at 80,000 drivers, an all-time high at the time, and said that on demographic and freight trends it could pass 160,000 by 2030. That is an industry estimate produced by a trade association, which does not make it wrong and does mean it should be read next to the federal data rather than instead of it.
The federal data disagrees, and it did so in public. In March 2019 the BLS Monthly Labor Review published an analysis by Stephen Burks and Kristen Monaco asking whether the market for truck drivers is broken. Their answer was that as a whole it works about as well as any other blue-collar labor market, that drivers respond to pay differences across occupations in the ordinary way, and that the problems the trade press describes are concentrated in long-distance truckload freight, which holds between one-sixth and one-fourth of all heavy and tractor-trailer drivers. ATA published a rebuttal on 19 March 2019.
What the two sides actually agree on
Read the rebuttal and the agreement is larger than the argument. ATA said in that statement that it has long emphasized the shortage is generally contained to one segment: the over-the-road, long-haul, for-hire truckload segment. The BLS authors said the same thing in different words and put a size on it. Both sides say the shortage is a segment problem, not an occupation-wide one. If you run local, regional, dedicated, private fleet or delivery operations, the number in the headline was never describing your hiring in the first place.
There is a third reading worth having, from the industry itself. The American Transportation Research Institute publishes an annual Top Industry Issues survey; the 21st edition, released 26 October 2025 with more than 4,200 participants, ranked the economy first, lawsuit abuse reform second, insurance cost and availability third, truck parking fourth and driver compensation fifth. Motor carriers led with the economy and insurance; drivers led with compensation and parking. A driver shortage does not appear in either list. When the industry ranks its own problems, the thing written about most is not the thing being voted for.
Who answers when the ad finds the driver
This is the part we can measure, because it is our own campaign data. In an earlier, smaller sample of 30 Boostpoint-managed CDL campaigns run between November 2025 and mid-2026, the blended cost was $13.57 per applicant, with the typical campaign between $8 and $24 and the median campaign at $12.94. The finding that matters here is not the price. It is who showed up.
| Age band | Share of impressions | Share of applicants | Conversion index | Cost per applicant |
|---|---|---|---|---|
| 18 to 24 | 2.7% | 0.6% | 0.22× | $27.26 |
| 25 to 34 | 10.3% | 4.9% | 0.48× | $14.54 |
| 35 to 44 | 17.4% | 9.1% | 0.52× | $15.50 |
| 45 to 54 | 23.5% | 20.9% | 0.89× | $13.60 |
| 55 to 64 | 29.7% | 38.2% | 1.29× | $12.95 |
| 65 and over | 16.3% | 26.4% | 1.62× | $13.29 |
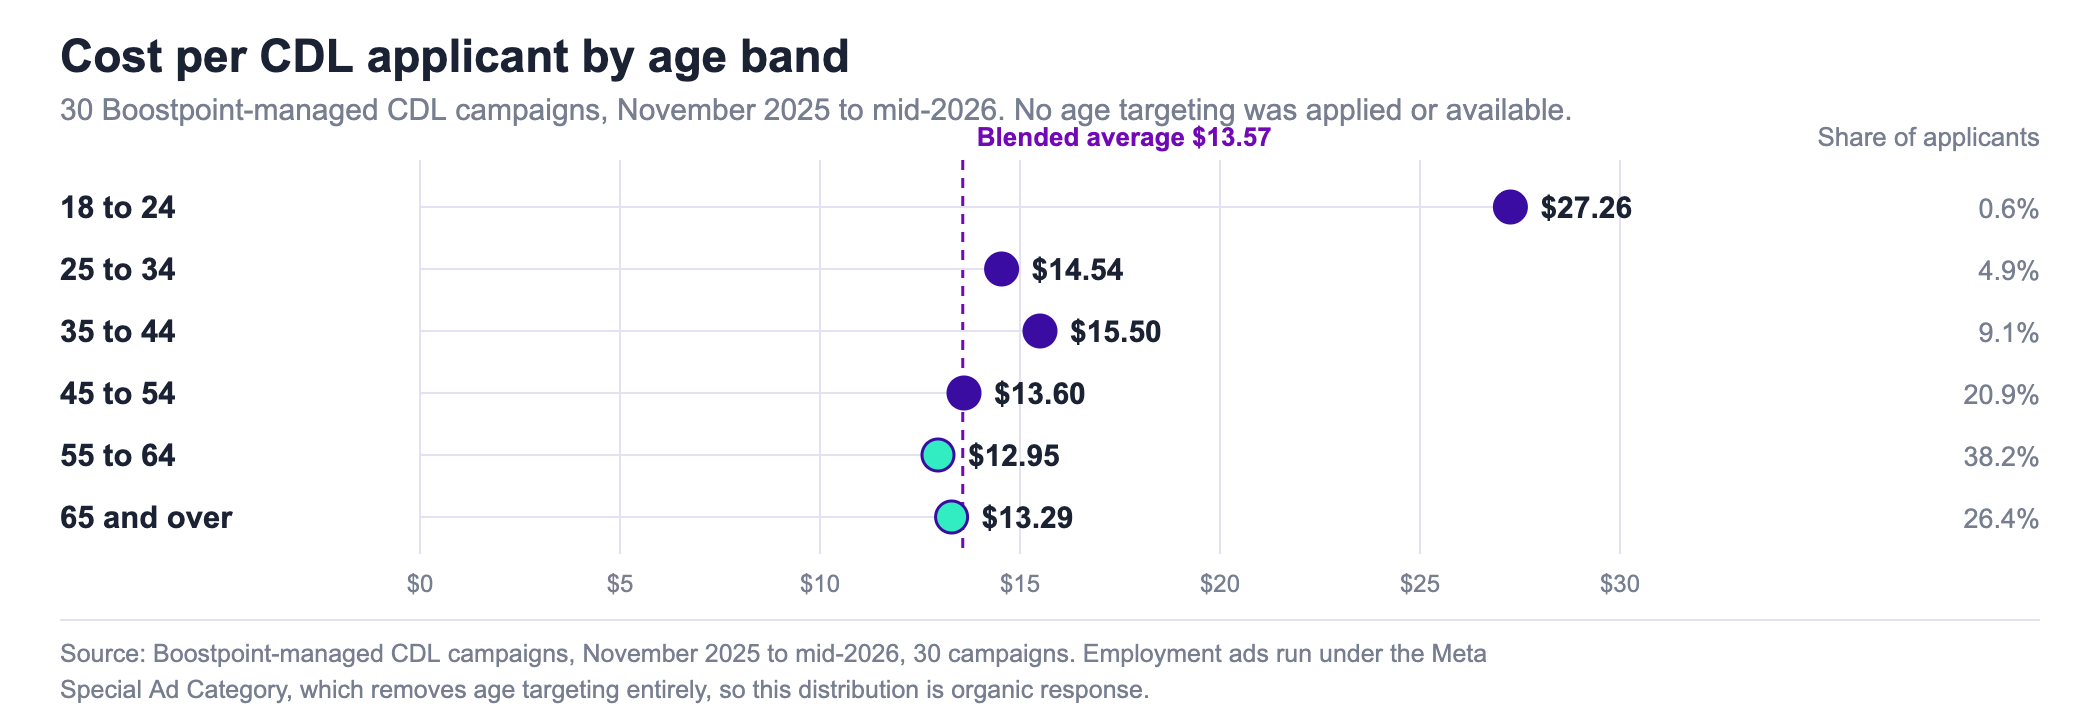
Drivers aged 55 and over produced 64.6% of the applicants and were the cheapest to acquire. The 65-plus band saw 16.3% of impressions and delivered 26.4% of applicants, converting at more than 1.6 times its exposure, at $13.29 an applicant. The 18 to 24 band converted at 0.22 times its exposure and cost more than twice as much.
Set that against the workforce as the federal household survey measures it. In the Current Population Survey annual averages for 2025, driver/sales workers and truck drivers had a median age of 46.4, and of the 3,583,000 people in that category, 1,104,000 — about 31% — were 55 or over. Our applicant pool is roughly twice as old, by share, as the workforce it is drawn from. That is not a targeting artefact, because targeting by age is not available for employment ads. It is a statement about who is reachable when an ad goes to people who were not looking.
The number we do not have
We can tell you what a CDL applicant costs and how old they are. We cannot tell you what share hold the endorsements you need, what share pass a background and MVR check, what share are still seated in week twelve, or whether a dollar spent on pay and home time returns more than a dollar spent on advertising. No one selling advertising can tell you that, because platform data stops at the form submission. That number lives in your own records, and on this occupation it decides more than anything on this page.
What one empty seat costs in advertising
Shortage arguments usually die because nobody puts a number on either side. The advertising side has a number and it is ours, so here it is with the arithmetic exposed rather than asserted. Enter your own cost per applicant if you have one; the default is our blended CDL figure, not a promise.
Price the refill
Want this for your own lanes? We show you live driver ads and what a CDL applicant costs in the markets you run.
Price my lanesWhy thin markets are cheaper to reach and dearer per applicant
The rural finding in our data looks like a weakness until you take it apart. Campaigns run for agricultural co-ops in North Dakota and South Dakota cost about three times the blended figure per applicant. The auction, though, was far cheaper: a CPM of $14.87 against $40.32 in denser markets. What changed was not the price of attention but how many different people there were to pay attention. Average frequency ran 5.4 against 2.3, which is the same drivers seeing the same ad twice as often.
That is the reach problem in media terms. A thin market is not expensive because nobody wants the job. It is expensive because the pool that can legally hold the seat is small, you saturate it quickly, and after that you are paying to show the same people the ad again. Widening the radius, changing the offer or accepting a longer fill time are the levers; spending more into a saturated market is not one. There is a channel-by-channel version of this in CDL driver recruiting costs by channel.
Check the reach your budget buys
Three things this changes about the ad itself
Advertise to people who are not looking. An occupation refilling itself 367,200 times a year is not short of people who have heard of it. Job boards charge for the small pool that is actively searching this week, and every carrier in the radius bids on the same pool, which is why board costs rise exactly when hiring gets urgent. The mechanics of running it the other way are in CDL recruiting.
Write for the driver who is 55, because that is who answers. Two-thirds of our applicants were 55 or over and they were the cheapest to acquire, in a workforce where about 31% are that age. Creative built for a 24-year-old career-changer is being shown, in practice, to an experienced driver deciding whether your home time beats the one they have. Lead with pay and home time, then equipment, then requirements.
Do not assume the technician shortage is the same shortage. Fleets that hire drivers usually hire diesel and maintenance technicians too, and the two markets behave differently: the technician pool is smaller, credentialed differently and priced differently, and a campaign built for drivers will underperform on it. We set that out separately in diesel mechanic recruiting.
And the point the arithmetic keeps returning to: on the federal projection, the seats reopen either way. What decides your cost is how often they reopen and how many of the people who could fill them ever hear that you are hiring. The wider version of this argument, across every frontline industry, is on the labor shortage, and the rest of our driver material sits on truck driver recruiting.
Truck driver job outlook: what the projections actually say
The employment outlook for truck drivers is stable, not shrinking. Heavy and tractor-trailer truck driver employment is projected to grow 4 percent between 2025 and 2035 — about as fast as the average across all occupations — from 2,221,200 jobs to roughly 2,305,000, a gain of 83,800 positions over the decade.
The career outlook figures worth knowing, all from the Occupational Outlook Handbook edition last modified 27 August 2026:
- Median pay: $58,640 a year, or $28.19 an hour, in May 2025. The lowest 10 percent earned under $40,140 and the highest 10 percent over $79,380.
- By industry: truck transportation pays a $60,320 median, wholesale trade $58,550, manufacturing $56,570 and construction $56,080.
- Entry: a postsecondary nondegree award — in practice a CDL — with no prior work experience required and short-term on-the-job training.
- Openings: about 214,500 a year over the decade for heavy and tractor-trailer drivers alone.
Read those two things together and the outlook is unusual: an occupation growing slowly, paying a median above the all-occupations median, and still opening more than two hundred thousand seats a year because people leave it. That is a retention profile, not a demand profile — which is the same conclusion the rest of this page reaches from the other direction.
How to find truck drivers
Drivers who are worth hiring are almost always currently driving. That single fact determines the method: job boards reach the small share between jobs, and reaching the rest means advertising where drivers spend time rather than where they search.
What works, in the order it pays off: advertise the things a driver screens on in the first line — home time, lane, equipment year, and actual average weekly pay rather than a best case; accept an application that takes under three minutes with no resume; and call back the same day, because a driver comparing three carriers takes the one that answers. The cost arithmetic for reaching them is in the section above, and every channel, from job boards and agencies to referrals and CDL schools, is compared on where to find truck drivers.
Truck driver shortage statistics for 2026
The trucker shortage in 2026, in the figures that are actually published. Each one is quoted from the source cited earlier on this page; none is a forecast of ours.
| Statistic | Figure | Source |
|---|---|---|
| Projected truck driver openings a year, 2025–2035, both driving occupations | 367,200 | BLS Occupational Outlook Handbook |
| Heavy and tractor-trailer driver openings a year | 214,500 | BLS Occupational Outlook Handbook |
| Delivery driver and driver/sales worker openings a year | 152,700 | BLS Occupational Outlook Handbook |
| Employment growth over the decade, both occupations | 186,800 (about 18,680 a year) | BLS Occupational Outlook Handbook |
| Share of annual openings that replace a driver who left | About 95% | Our arithmetic on the BLS figures above |
| Heavy and tractor-trailer drivers employed, 2025 | 2,221,200 | BLS Occupational Outlook Handbook |
| Median pay, heavy and tractor-trailer drivers, May 2025 | $58,640 a year ($28.19 an hour) | BLS Occupational Outlook Handbook |
| Median age, driver/sales workers and truck drivers, 2025 | 46.4 | BLS Current Population Survey |
| Share of that workforce aged 55 or over, 2025 | About 31% (1,104,000 of 3,583,000) | BLS Current Population Survey |
| Industry shortage estimate | 80,000 drivers (October 2021), possibly passing 160,000 by 2030 | American Trucking Associations |
| Share of heavy and tractor-trailer drivers in long-haul truckload, where the shortage is concentrated | One-sixth to one-fourth | BLS Monthly Labor Review, March 2019 |
Read together, these statistics describe churn more than a headcount gap: openings are dominated by replacement, and the segment the industry estimate describes is a minority of the occupation. For a fleet hiring in 2026, that puts the work on reach and retention, covered above.
The CDL driver shortage, by license class
Search for the CDL driver shortage and you will find the same national numbers used on this page, because nobody publishes openings by license class. The Bureau of Labor Statistics counts occupations, not licenses: Class A and Class B drivers of trucks sit together in one occupation, heavy and tractor-trailer truck drivers, whose example job titles include dump truck, fuel truck, garbage truck and tanker drivers. What you can do is line the federal license groups up against the occupations they feed, which shows where the license itself narrows your pool.
| CDL group | Federal definition, in short | Typical seats | BLS occupation, openings a year 2025-35 |
|---|---|---|---|
| Class A (combination vehicle) | Gross combination weight rating of 26,001 pounds or more, towing a unit rated over 10,000 pounds | Tractor-trailer, tanker combinations, dump truck pulling a trailer | Heavy and tractor-trailer truck drivers: 214,500 (Class A and B together) |
| Class B (heavy straight vehicle) | Single vehicle rated 26,001 pounds or more, towing no more than 10,000 pounds | Straight trucks, dump trucks, garbage trucks, many buses | Included in the 214,500 above; bus drivers, school: 56,500; bus drivers, transit and intercity: 21,100 |
| Class C (small vehicle) | Neither A nor B, but built for 16 or more passengers including the driver, or carrying placarded hazardous materials | Passenger vans and small buses, hazmat in lighter vehicles | Not separately counted |
Definitions from 49 CFR 383.91. Openings from BLS Employment Projections 2025-35. A Class A holder may drive Class B and C vehicles, and a Class B holder Class C vehicles, provided they hold the endorsements the vehicle needs.
Endorsements are where the pool gets small
The license class sets who can sit in the seat; the endorsement sets who can do the load. Under 49 CFR 383.93 a driver needs a separate endorsement for double or triple trailers (T), passenger vehicles (P), tank vehicles (N), hazardous materials (H) and school buses (S); the combined tank and hazmat endorsement is coded X. The hazmat endorsement carries the heaviest gate: under 49 CFR 383.141 a state may not issue or renew it until the Transportation Security Administration has cleared the driver in a security threat assessment (or the driver holds a valid TWIC), and it must be renewed at least every five years. BLS does not count drivers by endorsement, so the practical test is your own applicant flow: if most applicants hold the class you need but not the endorsement, you have found the constraint.
That changes the ad and the application. Put the class and the endorsement in the first line of the ad, ask for both as knockout questions on the form, and decide in advance whether you will pay for an endorsement test or sponsor the security threat assessment for a Class A driver who lacks the H, because that widens the pool more than a higher budget does. In the Boostpoint 2026 Social Job Advertising Benchmark, the CDL truck driver family ran a median of $26.86 per applicant at an 8% apply rate. Our CDL driver job description has the endorsement requirement lines, and the bus seats are covered on the bus driver shortage.
Frequently asked questions
Is there really a truck driver shortage?
It depends which part of the industry you mean. The most quoted figure, 80,000 drivers, is an American Trucking Associations estimate published on 25 October 2021, and the association itself has said the shortage is generally contained to the long-haul, for-hire truckload segment. A 2019 analysis in the BLS Monthly Labor Review found that segment holds between one-sixth and one-fourth of all heavy and tractor-trailer drivers, and that the wider market works about as well as any other blue-collar labor market. So there is a real supply problem in one segment, and something closer to a churn problem everywhere else.
How many truck drivers are needed?
The Bureau of Labor Statistics projects about 214,500 openings a year for heavy and tractor-trailer drivers and about 152,700 a year for delivery drivers and driver/sales workers over 2025 to 2035, or 367,200 in total. That is not the same as needing 367,200 more people. Employment across both occupations grows by 186,800 over the whole decade, about 18,680 a year, so roughly 95 percent of those openings are replacing someone who left the seat rather than adding a new one.
Why do fleets struggle to hire drivers?
Usually because of reach rather than supply. There are about 3.7 million people already doing the two truck driving jobs, and most of them are not searching a job board this week. A posting waits for someone to look for it, which limits you to the small pool that is actively searching in your radius at that moment, and every carrier nearby is bidding on that same pool. The second reason is qualification: applicants arrive without the endorsements or experience the seat needs, and recruiters spend hours disqualifying them by phone.
What does a CDL applicant cost?
In Boostpoint's 2026 Social Job Advertising Benchmark, CDL truck driver campaigns ran a median of 26.86 US dollars per applicant, with the middle half of campaigns between 17.00 and 42.31. In an earlier, smaller sample of 30 Boostpoint-managed CDL campaigns run between November 2025 and mid-2026, the blended cost was 13.57 US dollars per applicant, with the typical campaign between 8 and 24 dollars and the median campaign at 12.94. That is per applicant and not per hire, so multiply by however many applicants your process needs to produce one seated driver. It covers advertising and excludes recruiter time, orientation and everything downstream of the application.
Does the driver shortage affect local routes?
Far less than the headline suggests. Both the trade association and the federal analysis place the shortage in the over-the-road, long-haul, for-hire truckload segment. Local, regional, dedicated, private fleet and delivery operations sit outside that description. Delivery driver and driver/sales employment is in fact projected to grow faster than long-haul, at 7 percent over the decade against 4 percent, so a local fleet that cannot fill seats is usually looking at a reach or an offer problem rather than a national supply one.
How old are the drivers who apply?
Older than the workforce, in our data. Across our CDL campaigns 64.6 percent of applicants were 55 or over, and that group was the cheapest to acquire at about 13 dollars an applicant, while the 18 to 24 band produced 0.6 percent of applicants at more than 27 dollars each. For comparison, the BLS Current Population Survey put 31 percent of driver/sales workers and truck drivers at 55 or over in 2025. None of this was targeted: employment ads in the United States run under the Meta Special Ad Category, which removes age targeting entirely.
Do job boards work for truck drivers?
They work for the drivers who are searching, which is the smallest and most contested part of the pool. A board sells intent, so your posting competes with every other carrier hiring in that radius and your cost rises when freight demand pushes everyone to hire at once. The drivers who are not searching, including most of the experienced ones already seated somewhere, never see it. Boards are worth running; the mistake is treating them as the whole channel mix rather than the part that captures people already in motion.
How fast can a fleet refill a seat?
We do not publish a time to fill for CDL roles, because our data stops at the application and a fill depends on your screening, your background and MVR checks and your orientation schedule. What our campaign data does say is that the constraint is usually pool size rather than interest. In thin rural lanes we measured an average frequency of 5.4 against 2.3 in dense markets, meaning the same drivers saw the same ad twice as often, which is what saturation looks like before it shows up as a rising cost per applicant.
What is the employment outlook for truck drivers?
Stable. Heavy and tractor-trailer truck driver employment is projected to grow 4 percent from 2025 to 2035, from 2,221,200 to about 2,305,000 jobs, a gain of 83,800 positions. Roughly 214,500 openings a year are projected over the decade for that occupation, the overwhelming majority of them replacing drivers who leave rather than filling new seats.
What is the job outlook and pay for truck drivers in 2026?
Heavy and tractor-trailer drivers had a median wage of $58,640 a year, about $28.19 an hour, in May 2025, with the lowest tenth under $40,140 and the highest tenth over $79,380. Truck transportation pays the highest median at $60,320. Employment is projected to grow 4 percent through 2035.
How do you find truck drivers to hire?
Assume the drivers you want are already driving for someone else, which rules out relying on job boards alone. Lead with what a driver screens on — home time, lane, equipment year and real average weekly pay rather than a best case — keep the application under three minutes with no resume, and call back the same day.
What causes the truck driver shortage?
Mostly drivers leaving, not a lack of new seats. BLS projects 367,200 truck driver openings a year over 2025 to 2035 while employment grows by only about 18,680 a year, so roughly 95% of openings replace drivers who retired or left the occupation. The workforce is also older than most: about 31% of driver/sales workers and truck drivers were 55 or over in 2025. The American Trucking Associations’ 80,000-driver estimate (October 2021) applies mainly to the long-haul, for-hire truckload segment.
Is there a trucker shortage in 2026?
In one segment, yes; across the occupation it is mostly churn. The most quoted estimate, 80,000 drivers, is an American Trucking Associations figure from October 2021 for the long-haul, for-hire truckload segment. The BLS projects 367,200 truck driver openings a year over 2025 to 2035, but employment grows by only about 18,680 a year, so roughly 95% of openings replace drivers who left rather than adding new seats.
Is there a hazmat driver shortage?
Not one that federal data measures directly. BLS does not count drivers by endorsement; hazmat drivers are inside the heavy and tractor-trailer truck driver occupation, with about 214,500 openings a year projected for 2025 to 2035. What narrows the pool is the endorsement itself: under 49 CFR 383.141 a state cannot issue or renew the H endorsement until the TSA clears the driver in a security threat assessment (or the driver holds a valid TWIC), and it must be renewed at least every five years. Ask for the endorsement as a knockout question, and consider sponsoring it for otherwise qualified Class A drivers.
Is there a fuel truck driver shortage?
There is no separate count. BLS lists fuel truck driver as an example title inside heavy and tractor-trailer truck drivers, projected at about 214,500 openings a year from 2025 to 2035 with a median wage of $58,640 in May 2025. The constraint is the endorsement: a fuel tanker usually meets the federal tank vehicle definition (a tank over 119 gallons and 1,000 gallons or more in total), which needs the tank (N) endorsement, and a load that must be placarded as hazardous material, gasoline for example, also needs the hazmat (H) endorsement. The two together are coded X on the license, and the hazmat part requires a TSA security threat assessment.
Is there a garbage truck driver shortage?
BLS does not count garbage truck drivers separately: garbage truck driver is an example title in the heavy and tractor-trailer truck driver occupation. The crews that work alongside them are counted as refuse and recyclable material collectors, 156,400 jobs in 2025, projected to grow 2.1% to 2035, with about 15,500 openings a year and a median wage of $49,690 in May 2025 (BLS Employment Projections 2025-35). A garbage truck rated 26,001 pounds or more is a Class B vehicle under 49 CFR 383.91. Our guide on how to recruit sanitation workers covers the hiring.
Is there a dump truck driver shortage?
Not one anyone measures separately. Dump truck driver is an example title in the BLS heavy and tractor-trailer truck driver occupation (about 214,500 openings a year, 2025 to 2035). A dump truck rated 26,001 pounds or more is a Class B vehicle; pull a trailer rated over 10,000 pounds and the combination needs a Class A license (49 CFR 383.91). That makes the Class B straight-truck driver the realistic hire for most dump truck seats, and construction hiring seasons set when you compete for them.
The seats reopen either way. Let us show you what refilling them costs.
Bring your driver headcount, your turnover rate and the lanes you run. We will show you what applicant flow actually costs there, and what the refill is costing you now.
Book a Demo