
Truck Driver Turnover: What It Actually Costs and How to Reduce It
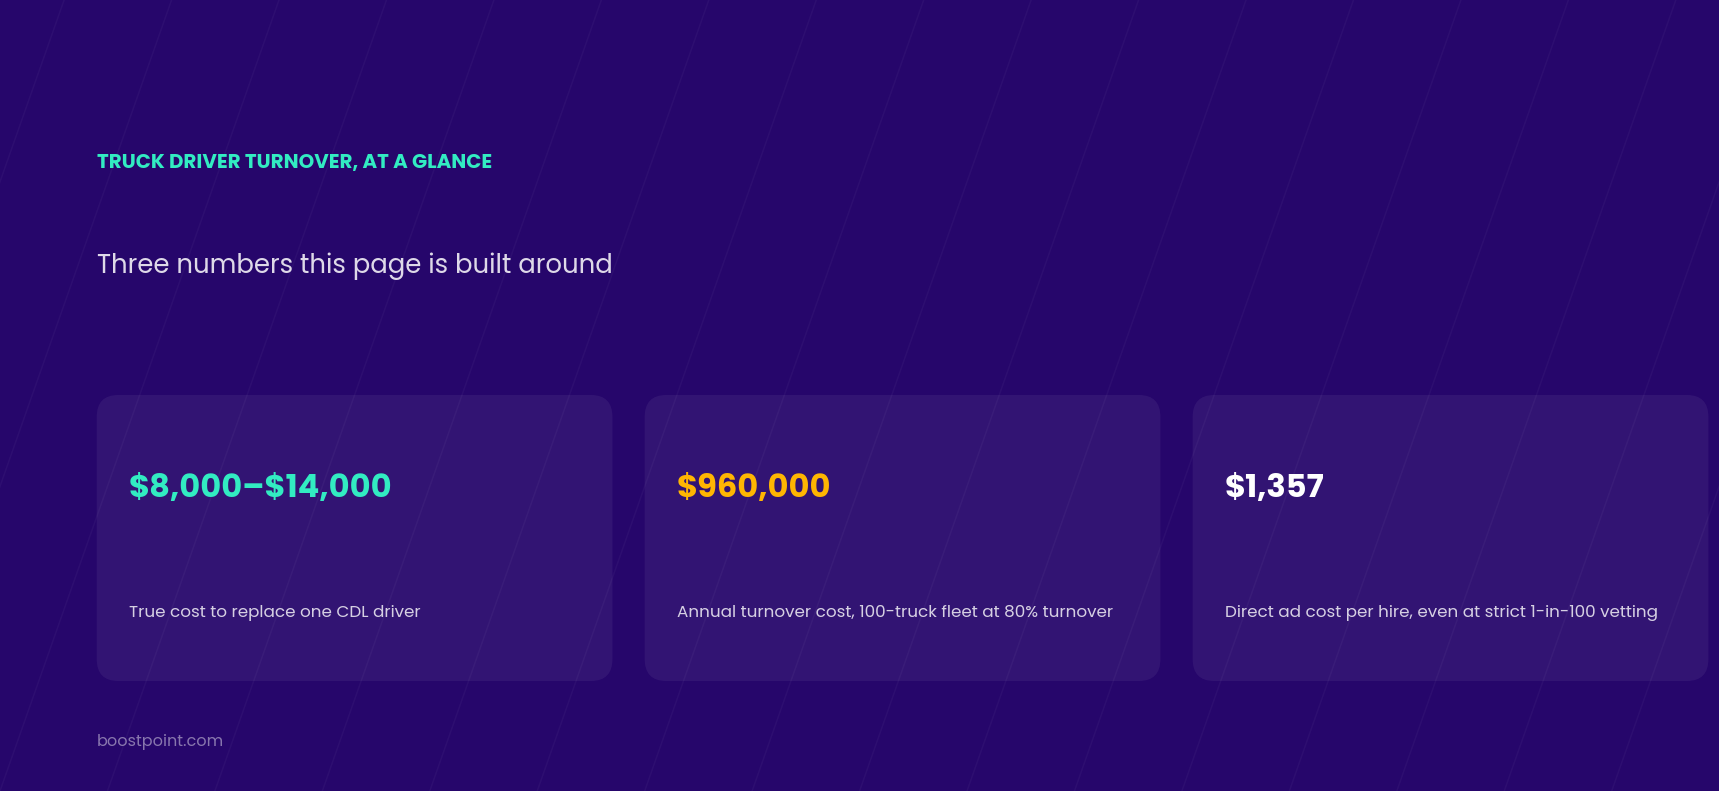
How much does truck driver turnover actually cost a fleet? Industry benchmarks from the American Trucking Associations (ATA) show that replacing a single Class A CDL driver costs between $8,000 and $14,000 in direct recruiting, orientation pay, drug screening, and lost truck revenue. For a 100-truck OTR fleet experiencing an 80% turnover rate, driver turnover costs over $640,000 to $1.1 million annually. Building a direct recruitment pipeline reduces acquisition costs to under $1,400 per hired driver even under strict vetting standards.
A note on who's writing this
Most guides on truck driver turnover are written by driver recruiting agencies or traditional job boards. Their business model thrives on high turnover — every time a driver quits, you have to buy another job posting or pay another $4,500 agency placement fee. They benefit when you repurchase the exact same truck seat every 90 days.
Boostpoint is not a recruiting agency or a job board. We build recruitment advertising software that helps motor carriers, private fleets, and logistics operators build their own direct driver pipelines through targeted social media campaigns.
We aren't here to give you vague advice about "company culture." We are providing the hard financial breakdown of what driver turnover actually costs your fleet per unseated truck, and how direct, transparent recruitment advertising lowers both acquisition costs and early driver drop-off.
The true cost of losing a CDL driver
When a driver turns in their keys, fleet managers often only account for the immediate ad cost to post the job opening. That is a dangerous accounting mistake.
The true financial impact of losing a CDL driver spans four distinct categories:
| Cost category | Expense breakdown | Average cost per driver exit |
|---|---|---|
| 1. Direct Recruiting & Sourcing | Job board ads, recruiter time, background checks, MVRs, Clearinghouse queries | $1,200 – $2,500 |
| 2. Onboarding & Orientation | Orientation pay, travel, hotel accommodations, simulator/road testing, drug screening | $1,500 – $2,800 |
| 3. Idle Equipment & Lost Revenue | Unseated truck fixed costs (lease/loan, insurance) + lost freight margin ($500–$1,000/day) | $3,500 – $7,000 |
| 4. Early Productivity Downtime | Slower initial route times, ramp-up fuel inefficiency, administrative onboarding overhead | $1,800 – $2,500 |
| Total Cost Per Lost Driver | All hard & soft cost categories combined | $8,000 – $14,000+ |
When a tractor sits parked at a terminal for just 10 days waiting for a driver, that idle equipment alone costs $5,000+ in missed revenue and fixed overhead.
The compounding math of OTR fleet turnover
In long-haul and Over-the-Road (OTR) trucking, annual driver turnover routinely averages 60% to 90%, while local and dedicated fleets average 25% to 40%.
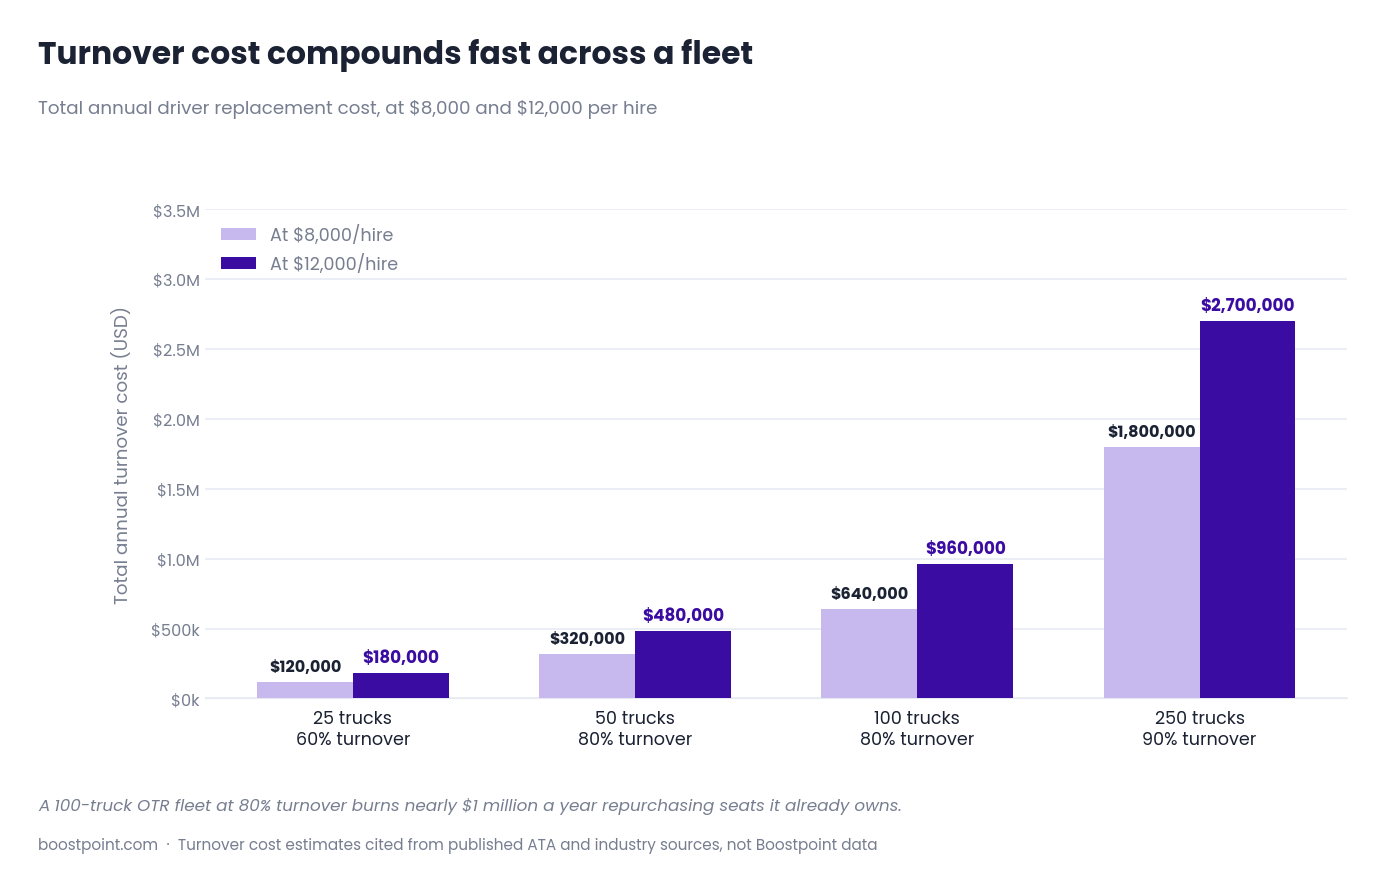
When turnover compounds across total fleet size, driver replacement costs become one of the largest operating expenses on your balance sheet:
| Fleet size | Turnover rate | Drivers lost per year | Total annual cost ($8,000/hire) | Total annual cost ($12,000/hire) |
|---|---|---|---|---|
| 25 Trucks | 60% (Regional) | 15 drivers | $120,000 | $180,000 |
| 50 Trucks | 80% (OTR) | 40 drivers | $320,000 | $480,000 |
| 100 Trucks | 80% (OTR) | 80 drivers | $640,000 | $960,000 |
| 250 Trucks | 90% (Long-Haul) | 225 drivers | $1,800,000 | $2,700,000 |
A 100-truck OTR fleet suffering 80% turnover effectively burns nearly $1 million a year simply repurchasing seats it already owned.
Why 90-day driver turnover happens (and how sourcing causes it)
More than 35% of driver turnover occurs within the first 90 days of employment. Why do drivers leave so quickly?
- Expectation mismatch (the "agency spin"). When carriers rely on third-party recruiting agencies or generic job boards, recruiters often over-promise home time, pay guarantees, or equipment quality just to make a placement. When reality hits on week three, the driver quits.
- Generic job board spam. Drivers hired off saturated job boards are actively shopping around. They accepted your job because it was available, but they are still receiving daily calls from competing carriers.
- Application friction and slow onboarding. Drivers who wait days for phone calls or suffer through confusing ATS portals start their relationship with your fleet feeling frustrated.
The fix: direct recruitment advertising on social media (Facebook, Instagram). By controlling your ad creative, showing real photos of your fleet, and stating exact home-time expectations upfront, you attract drivers who fit your specific lanes — dramatically improving 90-day retention rates.
Direct acquisition benchmarks: lowering cost per driver hire
To break the cycle of expensive turnover, fleets must reduce their cost per applicant (CPA) and build an automated candidate pipeline.
Across Boostpoint-managed transportation and trucking campaigns in 2026 — the full breakdown across every lane we track is in our published 2026 Transportation Benchmark Report:
| Trucking role / lane setting | Median cost per applicant (CPA) |
|---|---|
| General Carrier Company Driver | $13.57 |
| Regional / Dedicated Fleet Driver | $15.20 |
| Transportation & Logistics (Blended) | $21.99 |
| Agricultural / Rural CDL Driver | $21.13 |
| Owner-Operator Leasing | $28.50 |
Source: Boostpoint campaign data — managed transportation and CDL recruitment campaigns conducted in 2025–2026 across motor carriers, private fleets, and logistics operations nationwide.
Data based on the 2026 Boostpoint Transportation Benchmark Report.
Calculating direct ad cost per hire across screening ratios
Advertising budget generates driver applicants, not seated drivers. Because carriers must clear MVRs, Drug & Alcohol Clearinghouse records, and physicals, candidate drop-off is expected.
The supply side of that equation is on the truck driver shortage, where the federal projections put 95 percent of driver openings down to replacement rather than growth.
Here is what direct ad cost per hire looks like across three candidate screening scenarios (based on the $13.57 company driver benchmark):
| Driver sourcing setting | Cost per applicant (CPA) | 1 in 10 hire rate (10% — high touch) | 1 in 50 hire rate (2% — realistic standard) | 1 in 100 hire rate (1% — strict vetting) |
|---|---|---|---|---|
| Company Driver (General) | $13.57 | $135.70 | $678.50 | $1,357.00 |
| Regional / Dedicated | $15.20 | $152.00 | $760.00 | $1,520.00 |
| Owner-Operator | $28.50 | $285.00 | $1,425.00 | $2,850.00 |
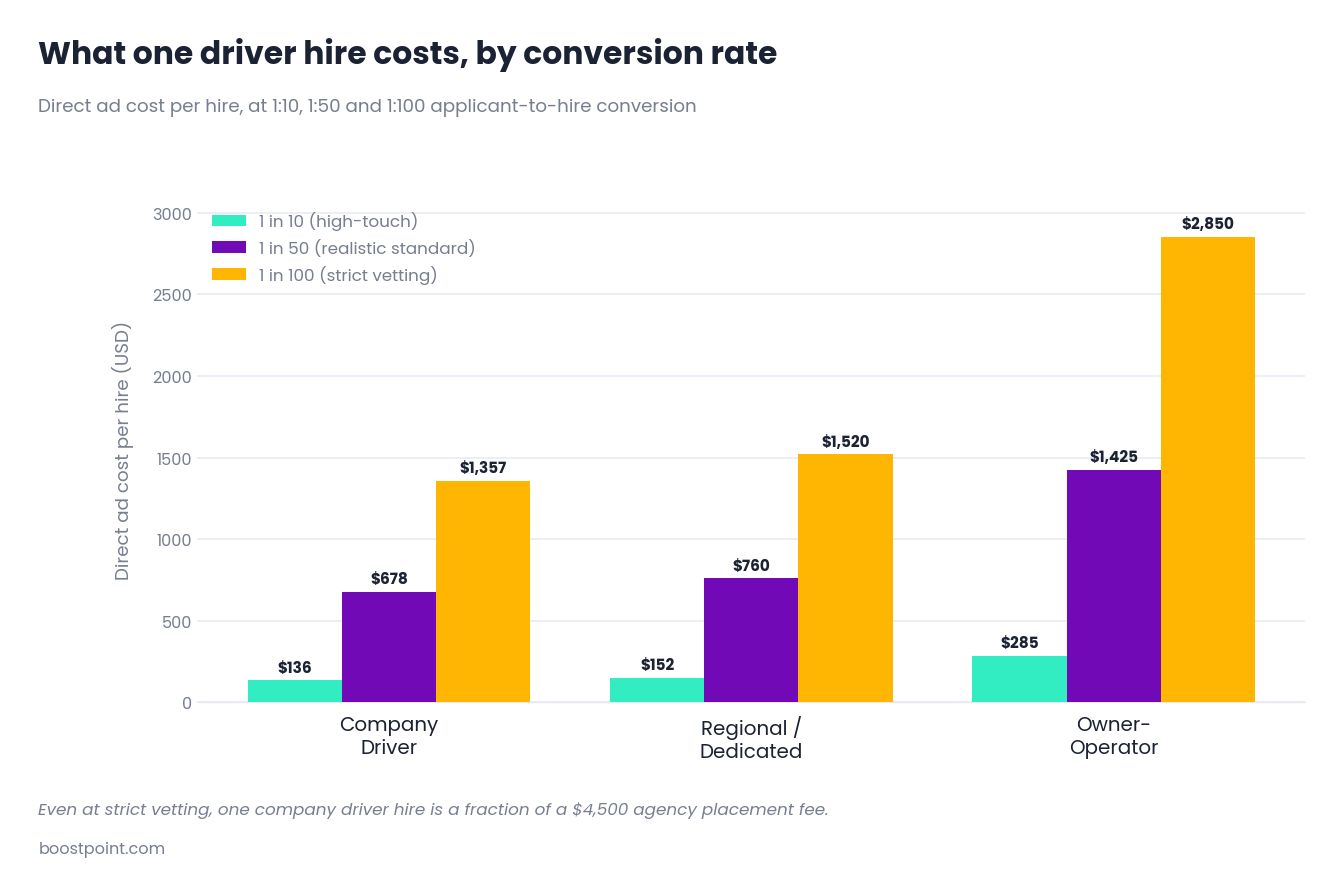
Even under a highly strict 1 out of 100 hire rate, generating a company driver for $1,357 in direct advertising is drastically cheaper than paying a truck driver recruiting agency a $4,500 placement fee, or letting a truck sit idle for two weeks.
4 actionable strategies to reduce driver turnover
- Advertise exact lanes and home time upfront. Don't advertise "great home time" if the lane requires 12 days OTR. State the exact schedule in the ad. Filtering out mismatched drivers before they apply protects your 90-day retention rate.
- Automate SMS engagement within 5 minutes. Drivers apply from truck stop parking lots. If your recruiter calls 24 hours later, the driver has already moved on. Automated SMS engagement boosts conversion by over 200%.
- Show real fleet equipment in ad creative. Run short 15-second smartphone videos showing your actual tractors, APU units, and terminal amenities. Authenticity builds candidate trust before the first phone call.
- Build a re-hire alumni pipeline. Stay in touch with former drivers who left on good terms. Running simple SMS re-engagement campaigns to your database can fill 10% to 15% of open seats annually at zero ad cost.
The arithmetic above is a fleet's. If you need the same calculation for the rest of the operation — technicians, dispatch, warehouse — at whatever headcount and replacement cost you carry, it is on the turnover cost calculator.
The honest summary
Driver turnover is an operational disease. Direct recruitment advertising is the cure.
If your fleet is burning $8,000 to $12,000 per lost driver, trying to solve turnover by buying more expensive job board posts or paying agency placement fees is an unsustainable cycle.
By taking control of your recruitment marketing, showcasing your real fleet culture on social media, and lowering your direct ad cost per hire to under $1,400, you reduce empty truck days, improve early driver retention, and protect your fleet's profitability.
The calculation worth running this quarter
Fleet Managers and Recruiting Directors should evaluate these four metrics together:
- Calculate your fleet's true turnover cost. Take your total driver exits over the last 12 months and multiply by $9,500 (industry median replacement cost).
- Audit 90-day retention by sourcing channel. Compare 90-day drop-off rates for drivers hired via job boards versus those hired via direct social recruitment.
- Calculate idle truck revenue loss. Multiply your average unseated truck days by your daily gross revenue per truck ($700–$1,000/day).
- Compare direct acquisition against agency placement fees. Contrast a $1,357 direct ad cost per hire against $4,500 agency fees.
Frequently asked questions
What is the average truck driver turnover rate?
According to the American Trucking Associations (ATA), annual driver turnover for large Over-the-Road (OTR) fleets averages between 60% and 90%. Regional and dedicated fleets average 25% to 40%, while local daily fleets see the lowest turnover at 15% to 25%.
How much does it cost to replace a truck driver?
Replacing a Class A CDL driver costs between $8,000 and $14,000+ per driver. This includes direct recruiting costs, orientation pay, travel, drug screening, MVR checks, and the lost revenue of an unseated truck (averaging $500 to $1,000 per day).
Why is truck driver turnover so high?
The leading causes of driver turnover are extended time away from home, compensation expectation mismatches, poor communication with dispatchers, aging equipment, and recruiter over-promising during the hiring phase.
How does direct recruitment advertising improve driver retention?
Direct social media advertising allows carriers to control their messaging. By showing real fleet equipment, exact home-time guarantees, and transparent pay scales in ad creative, carriers attract drivers who specifically fit their operational lanes, drastically reducing early 90-day turnover.
What is the average cost to generate a CDL driver applicant on social media?
Based on Boostpoint 2026 benchmark data, company driver applicants cost a median of $13.57 each, dedicated fleet drivers average $15.20, and owner-operator leads average $28.50 per applicant.
How much does it actually cost to hire one OTR truck driver?
Start from cost per applicant, not cost per hire. In Boostpoint's 2026 Social Job Advertising Benchmark, CDL driver campaigns had a median of $26.86 per applicant. Divide by your hire rate: if one in 50 applicants clears the MVR, Clearinghouse query, physical and road test and gets seated, advertising alone is $1,343 per hire at that median. Then add orientation pay, travel, screening costs and the days the truck sits empty, itemized in the cost table above.
Stop burning budget on driver turnover
Book a 30-minute strategy call with our transportation recruiting team. We'll analyze your fleet turnover, review CDL cost-per-applicant data in your operating lanes, and show you how to build a direct driver pipeline that lasts.
Book a Demo →Turnover is decided partly at interview, and the questions that predict who stays are not the ones most carriers ask. We set them out in truck driver interview questions, along with the equivalents for delivery drivers and bus drivers.
Boostpoint figures are derived from managed transportation and CDL recruitment campaigns conducted in 2025–2026 across motor carriers, private fleets, and logistics operations nationwide. Cost-per-applicant metrics reflect what advertisers paid for advertising. Turnover cost metrics and replacement averages are compiled from published ATA reports, fleet financial audits, and transportation industry benchmark studies.
The same arithmetic applies to buses. Our analysis of the bus driver shortage covers the 14% annual replacement rate, the pay gap against transit driving, and the training pipeline.