
"No One Wants to Work Anymore" — Except That 5.3 Million People Did Last Month
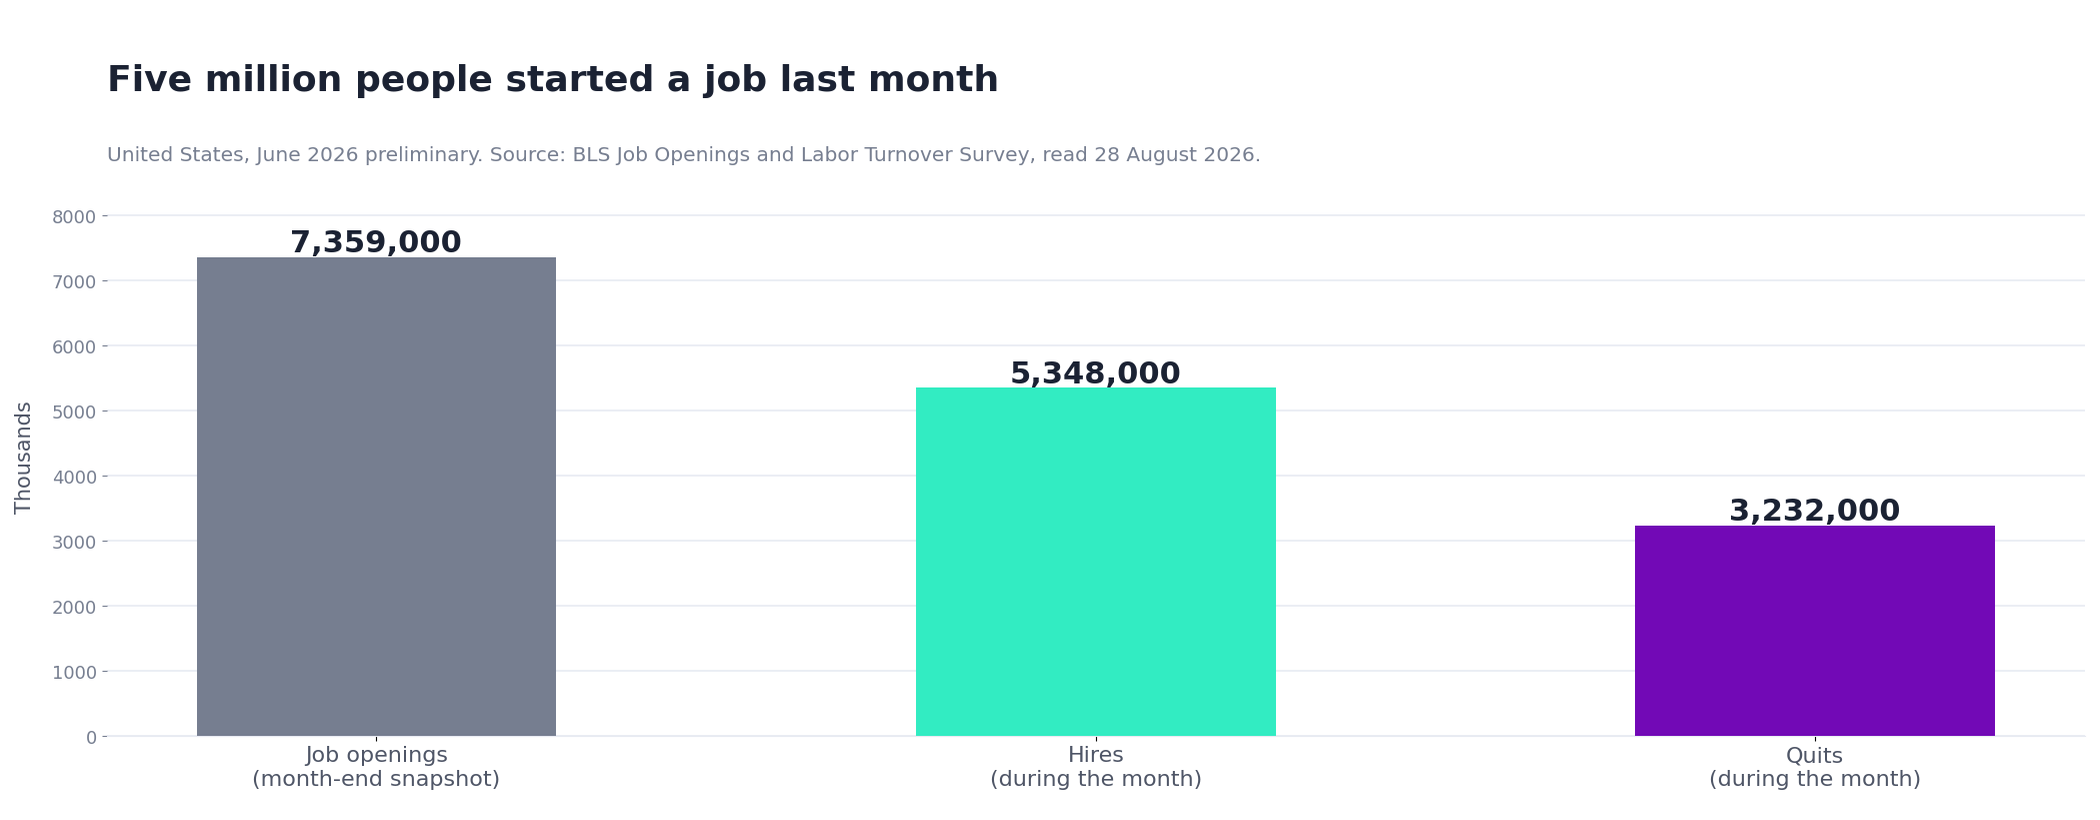
In June 2026, American employers made 5,348,000 hires. In the same month, 3,232,000 people quit — voluntarily, which is what people do when they are confident of finding something else. The phrase is not describing an absence of willing workers. It is describing a market where the willing worker has options, and where the employer who states the pay and calls back first gets them.
A note on who's writing this
Boostpoint sells recruitment advertising, so "the market is fine, you just need better ads" is a conveniently self-serving conclusion for us and you should read this page knowing that. Two things keep it honest. Every labor-market figure below comes from the U.S. Bureau of Labor Statistics, which we do not control, with the release date and the read date stated. And the page says plainly, twice, where advertising is not the answer — because in credential-gated work it genuinely is not, and pretending otherwise would sell you something that cannot work. Our own campaign figures come from the published 2026 benchmark and are labeled as ours throughout.
Where the phrase comes from, and why it feels true
It feels true because of a real experience: you post a job, you get fewer applications than you used to, and the ones you get do not turn up. That experience is genuine and this page is not going to tell you it is imaginary. What it is going to do is separate the experience from the explanation, because "nobody wants to work" is an explanation, and the data does not support it.
Three numbers, all from the U.S. Bureau of Labor Statistics Job Openings and Labor Turnover Survey for June 2026. There were 7,359,000 job openings on the last business day of the month. There were 5,348,000 hires across the month. There were 3,232,000 quits. Millions of people took jobs. Millions more left jobs they already had, which is not a behavior associated with people who do not want to work — it is a behavior associated with people who believe another job is available.
What is actually different
Three things changed, and none of them is willingness.
The applicant now compares before applying. The pay, the shift and the location are visible on a phone in ten seconds. A posting that withholds them is not neutral; it is losing to the one next to it that does not. In our own campaign data the pattern is stark — across 891 campaigns, what happens after somebody taps an ad explains about 70% of the variation in cost per applicant, against about 18% for what the ad auction charges. The decision is made after the click, on the information you chose to give.
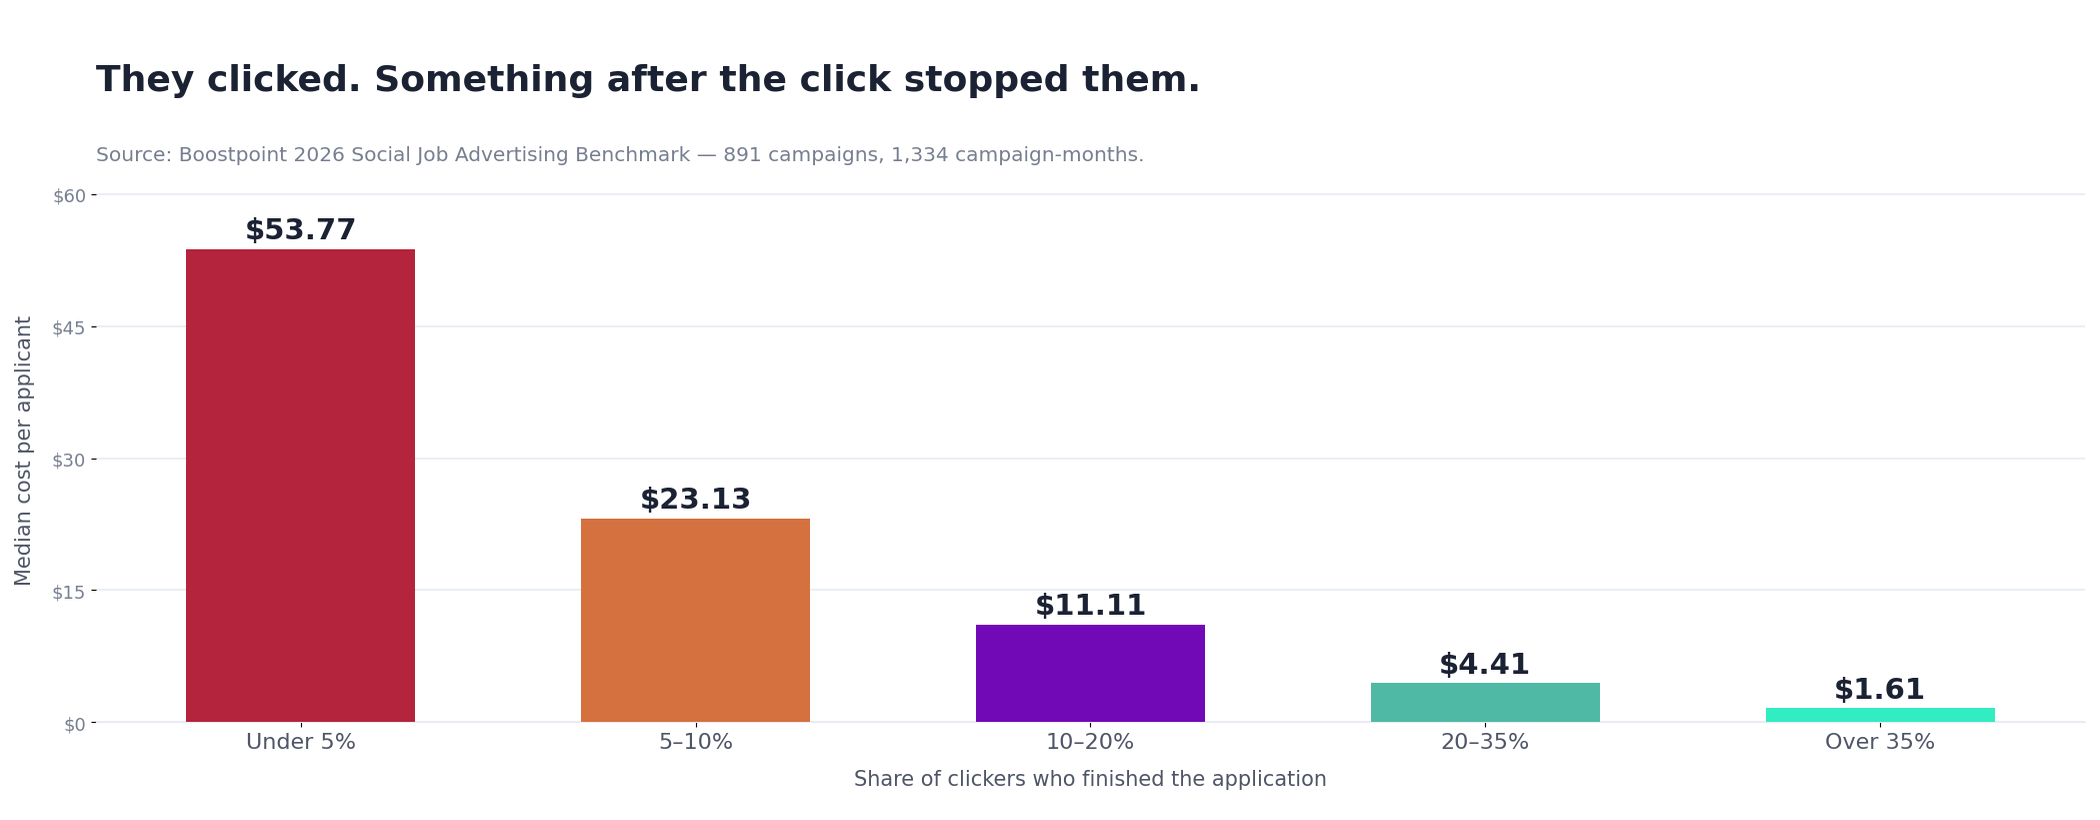
Applications are now abandoned rather than refused. Campaigns where fewer than 5% of clickers finished the form produced applicants at $53.77 each; campaigns above 35% produced them at $1.61. Same platform, same period. The people in the first group were interested enough to click. They stopped because of what happened next — a login, a résumé upload, a fourteen-question form.
None of those three is a statement about character. They are statements about a market where information travels faster than it used to and where the alternative job is one tap away. An employer who has not changed the posting since 2019 is competing in that market with 2019 equipment, and losing to competitors who did change it — which feels, from the inside, exactly like nobody wanting to work.
The window closed. In categories where the monthly quits rate runs above 4%, the person applying to you is applying to two or three employers the same week, and whoever calls first usually wins — the channel arithmetic is on the best way to recruit. That and that is a scheduling decision inside your own building rather than a market condition.
The industries that say it loudest
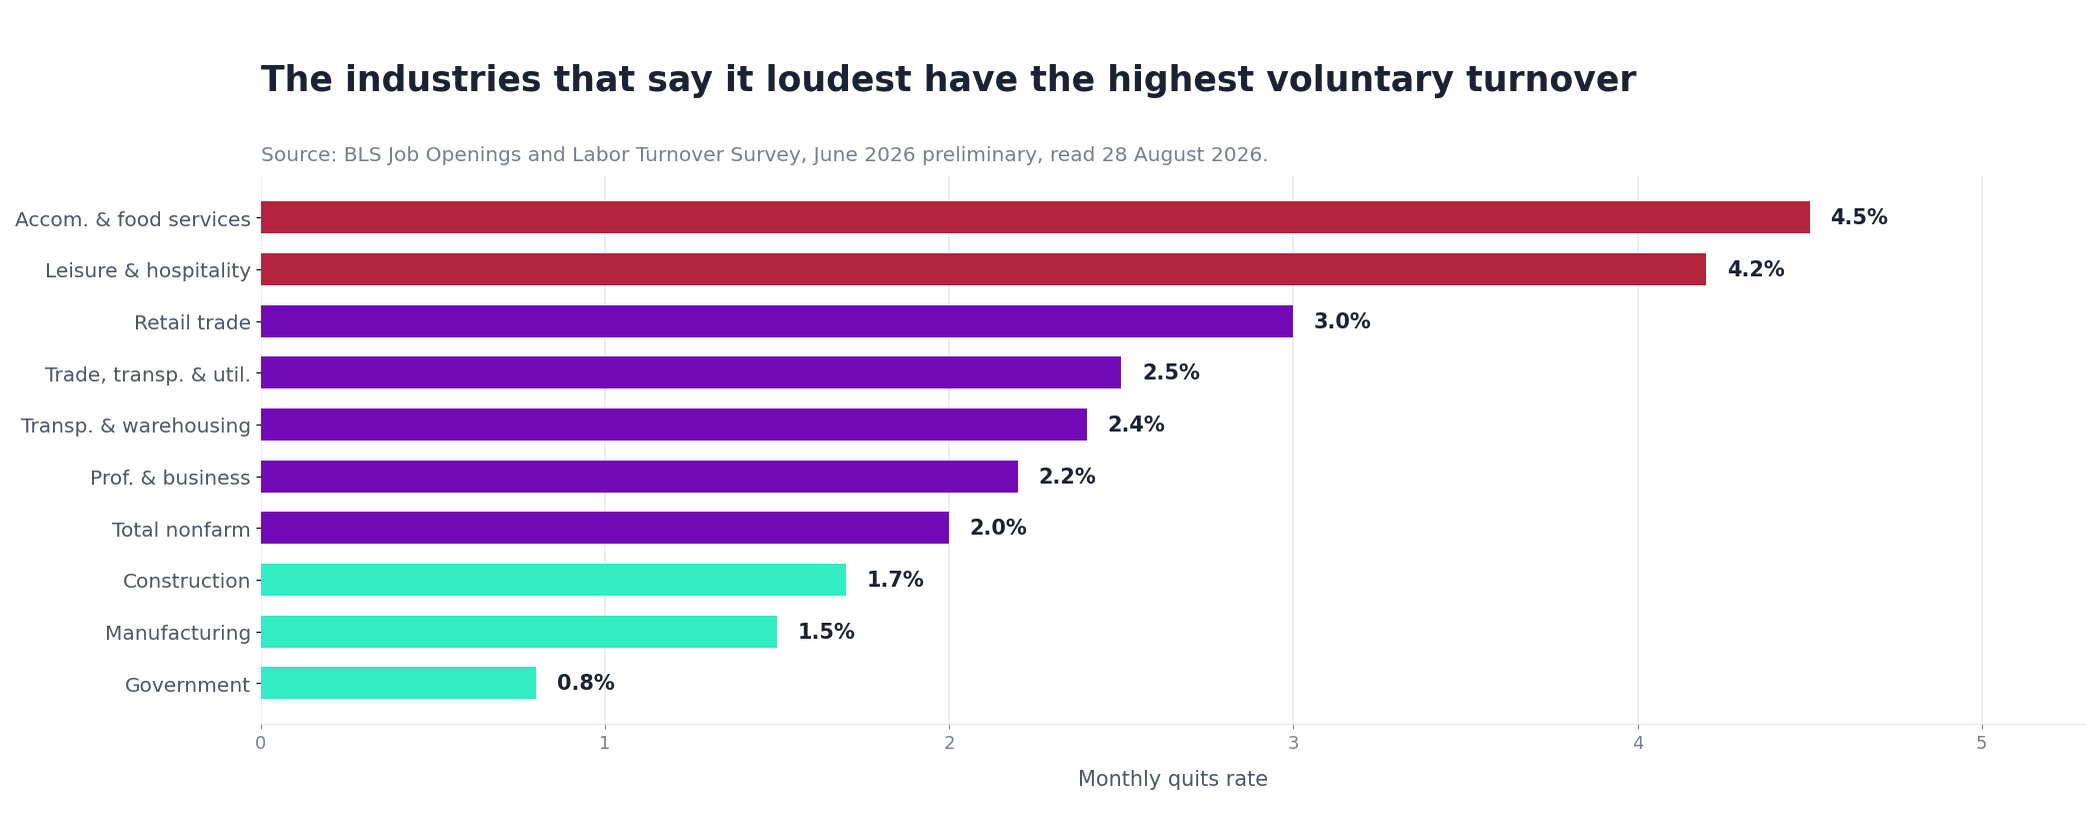
Accommodation and food services made 715,000 hires in June 2026 against 684,000 openings at the end of it — more people hired during the month than there were positions left to fill. It also recorded 638,000 quits, a 4.5% monthly rate, the highest BLS publishes. Leisure and hospitality as a whole ran at 4.2%; retail at 3.0%.
Set those against manufacturing at a 1.5% monthly quits rate and construction at 1.7% — two industries with real, well-documented hiring difficulty and a third of the churn. The sectors most associated with the phrase are not the ones struggling to find people. They are the ones losing the people they find. The full industry breakdown is on our labor shortage page.
What believing it costs you
The practical problem with "nobody wants to work" is not that it is rude. It is that it is a conclusion, and conclusions stop investigations. Once an employer accepts it, a specific set of questions never get asked: how many people saw the posting, how many started an application, how many finished, how long until somebody called them back, and how many of last year's leavers went in the first ninety days. Every one of those is measurable, and every one of them is inside your control.
We see the consequence in the shape of campaign data. The employers who conclude the market is empty tend to respond by spending more on reach, which is the smallest lever available — what the ad auction charges explains about 18% of the variation in cost per applicant. The employers who get cheaper applicants tend to have made a different change: they shortened the form, they put the wage in the first line, or they moved the application onto the platform the candidate was already using instead of routing them to a careers site — the mechanics are in social media job advertising.
There is a version of this that is worth saying out loud to a hiring manager. If a hundred people tapped the ad and four finished the application, ninety-six people wanted the job enough to click. Whatever stopped them, it was not unwillingness to work.
Put your own number on the scale
The argument is easier to settle with your own figures than with anyone's opinion. Enter your headcount and how many people left voluntarily last year; the panel converts it to the monthly rate BLS publishes and shows where you land among the industries.
People on payroll across the year
Voluntary leavers only — not layoffs or terminations
What to do instead of saying it
- Put the number in the ad. "Competitive pay" is read by experienced hourly workers as a warning. A range with a differential is the single highest-value line you can write — see our help wanted ad examples.
- Count the screens. If there is more than one page between your advertisement and a submitted application, that is where your applicants went. The arithmetic is on our candidate conversion rate page.
- Call the same day. In a 4%-quits category, a two-day delay is a lost hire, and it costs nothing to fix.
- Ask why people leave before asking why they don't apply. If your quits rate is above 3% a month, retention will move your headcount faster than any budget increase. Our first 90 days page covers where the exits actually happen.
- Reach people who are not looking. Where the qualified people are employed and not reading job boards, that is a reach problem — and the one thing on this list we sell.
The honest caveats
Some shortages are real. Where a license gates the work — a CDL, an RN license, a state trade card — the pool is fixed in the short run, and no advertisement reaches somebody who does not hold the credential. Our own data shows the cost of that gate from the other side: registered nurse campaigns saw 11% of clickers complete an application and CDL driver campaigns 8%, against 31% for caregivers. In those categories the honest answer is a training pathway, not a louder ad; the job description templates spell out which requirements are legally required and which are simply habit.
And the figures above are national. Your county is not the national average, your industry is not the whole economy, and a single quarter is not a trend. What the data does rule out is the strong form of the claim — that people in general have stopped being willing to work. Five million of them started a job last month.
Nobody stopped wanting to work. They started comparing before applying — and a posting that hides the pay loses that comparison every time.
Frequently asked questions
Is it true that no one wants to work anymore?
The data says no. In June 2026 American employers made 5,348,000 hires in a single month, and 3,232,000 people voluntarily quit jobs they already had — behavior associated with confidence about finding other work, not with unwillingness to work. What has changed is that applicants compare pay, shift and location before applying, and abandon applications that are slow.
Why is it so hard to find workers then?
Usually one of three things. The qualified people already have jobs and are not reading job boards, so they never see the posting. Or a license gates the role and the pool is genuinely fixed. Or the applicants arrive and abandon — in our benchmark, what happens after the click explains about 70% of the variation in cost per applicant.
Do people quit because of pay or because of management?
This page will not pretend to answer that from advertising data — we measure applications, not exit interviews. What the published figures do show is that quits vary enormously by industry, from 0.8% a month in government to 4.5% in accommodation and food services, which suggests conditions of work matter more than any general change in attitude.
What is a normal amount of turnover?
Total nonfarm quits ran at 2.0% a month in June 2026. Construction at 1.7% and manufacturing at 1.5% are below it; retail at 3.0%, leisure and hospitality at 4.2% and accommodation and food services at 4.5% are well above. If your own rate converts to more than 3% a month, retention will move your headcount faster than more advertising will.
Does paying more actually fix it?
It reliably moves people between employers, which solves your problem rather than the market's. It works best when the number is in the advertisement instead of being discovered at interview, because the comparison happens before the application. Where a credential gates entry, higher pay competes for a fixed pool and does not enlarge it.
Are people just living on benefits instead of working?
Whatever the merits of that argument, it does not explain the June 2026 figures: 5,348,000 people started jobs in a single month and 3,232,000 left jobs voluntarily. Both numbers describe people moving through work, not away from it. We are an advertising company, not a policy shop, and this is as far as our data can honestly take the question.
Why do I get applicants who never respond?
Usually speed. In categories quitting at 4% a month, an applicant is typically applying to several employers the same week and taking the first credible offer. The fix is a same-day call and a short screening conversation rather than a longer application form — the form filters people out before you ever get to talk to them.
Where do these numbers come from?
Hiring, quits and openings figures come from the U.S. Bureau of Labor Statistics Job Openings and Labor Turnover Survey for June 2026, released 4 August 2026 and read on 28 August 2026; all are preliminary. Cost and completion figures come from Boostpoint's published 2026 benchmark of 891 campaigns, which is our own data and labeled as such throughout.
Find out which problem you actually have
We will show you what your roles have cost other employers in your vertical and market — and tell you plainly when the answer is retention rather than advertising.
Methodology and sources. Labor-market figures: U.S. Bureau of Labor Statistics, Job Openings and Labor Turnover Survey, June 2026 (preliminary), released 4 August 2026 and read from bls.gov on 28 August 2026 — 7,359,000 job openings, 5,348,000 hires and 3,232,000 quits nationally; accommodation and food services 684,000 openings, 715,000 hires and 638,000 quits at a 4.5% monthly quits rate; leisure and hospitality 4.2%; retail trade 3.0%; total nonfarm 2.0%; construction 1.7%; manufacturing 1.5%; government 0.8%. The benchmarker converts an annual figure to a monthly rate by dividing by twelve, which approximates the BLS method for a stable headcount and is not identical to it; it is our arithmetic on the reader's own inputs. Boostpoint figures come from the Boostpoint 2026 Social Job Advertising Benchmark — 891 Boostpoint-managed campaigns on Meta across 1,334 campaign-months, advertising costs only: $53.77 per applicant below 5% completion, $23.13 at 5–10%, $11.11 at 10–20%, $4.41 at 20–35% and $1.61 above 35%; post-click conversion explaining about 70% of cost variation and CPM about 18%, each measured separately; apply rates of 11% for registered nurse and 8% for CDL driver campaigns against 31% for caregivers. Cost per applicant is not cost per hire; hires are recorded in your applicant tracking system, not in an ad platform. See the full benchmark report and the industry breakdown on labor shortage.