
Employer guideUpdated September 2026
The Manufacturing Labor Shortage Is a Filling Problem, Not a Quitting Problem
In July 2026 manufacturing was carrying a job openings rate of 4.4% against a hires rate of 2.3%. Posts are opening roughly twice as fast as they are being filled. But the quits rate was 1.4%, well below the national figure of 1.9% that month, and layoffs and discharges ran at just 0.7%. Meanwhile the sector employed 12,611,000 people, down about 264,000 from January 2024. So the shortage is not people walking out and it is not a sector expanding faster than it can staff. It is a matching problem: fewer people doing the work, more posts open than get filled, and a workforce that stays once it arrives. Construction, in the same month, shows the exact inverse: see the construction labor shortage page.
Four numbers that do not fit the usual story
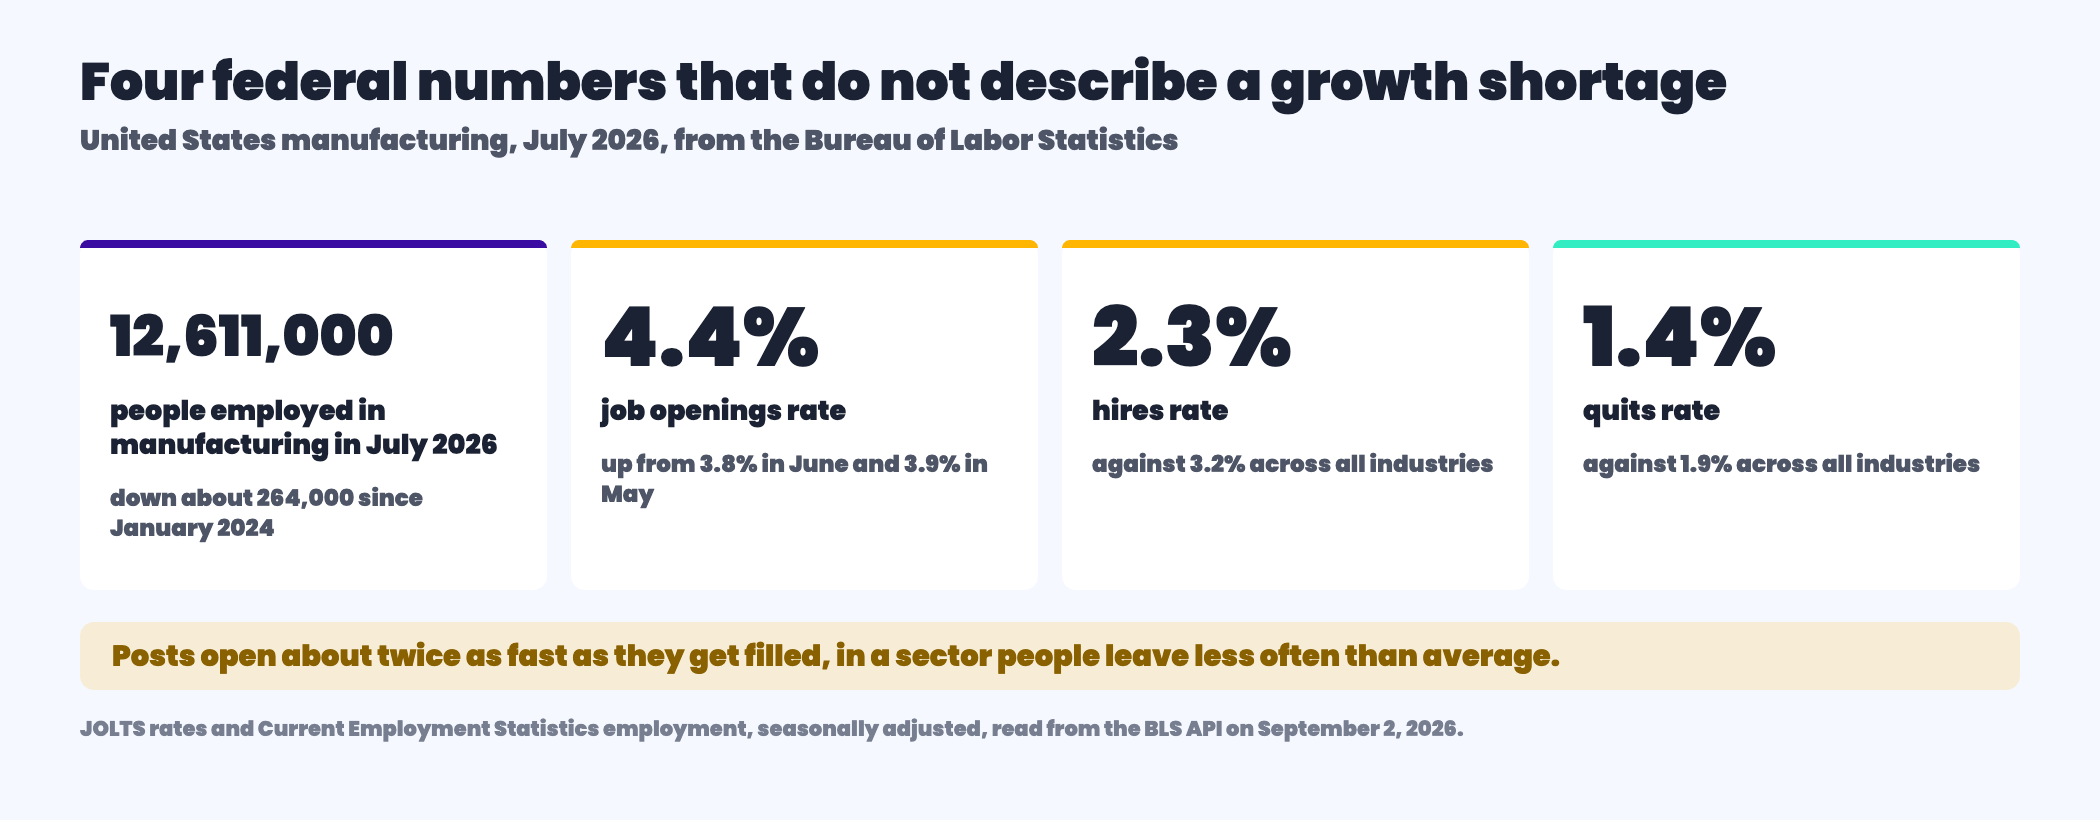
Read those together and the usual framing falls apart. A sector in the middle of a growth-driven labor shortage would show rising employment and a hires rate keeping pace with openings. Manufacturing shows the opposite: employment down about a quarter of a million people since the start of 2024, an openings rate roughly double the hires rate, and a quits rate that sits below the national average.
Why this matters more than it sounds
If your problem were turnover, the answer would be retention. If it were growth, the answer would be volume. Manufacturing has neither of those problems in the federal data. What it has is posts that stay open. The lever there is not a bigger audience or a better handbook; it is everything that happens between someone seeing the job and someone starting it. That is a narrower and much cheaper problem than the one the sector usually describes.
Manufacturing against the whole economy
| Measure, July 2026 | Manufacturing | All industries | What it says |
|---|---|---|---|
| Job openings rate | 4.4% | Not compared here | Up from 3.8% in June and 3.9% in May, so the gap widened rather than closed. |
| Hires rate | 2.3% | 3.2% | Manufacturing hires more slowly than the economy as a whole. |
| Quits rate | 1.4% | 1.9% | People leave manufacturing less often than they leave the average job. |
| Layoffs and discharges rate | 0.7% | Not compared here | Involuntary separations are not what is emptying the posts. |
| Employment | 12,611,000 | — | Down roughly 264,000 from 12,875,000 in January 2024. |
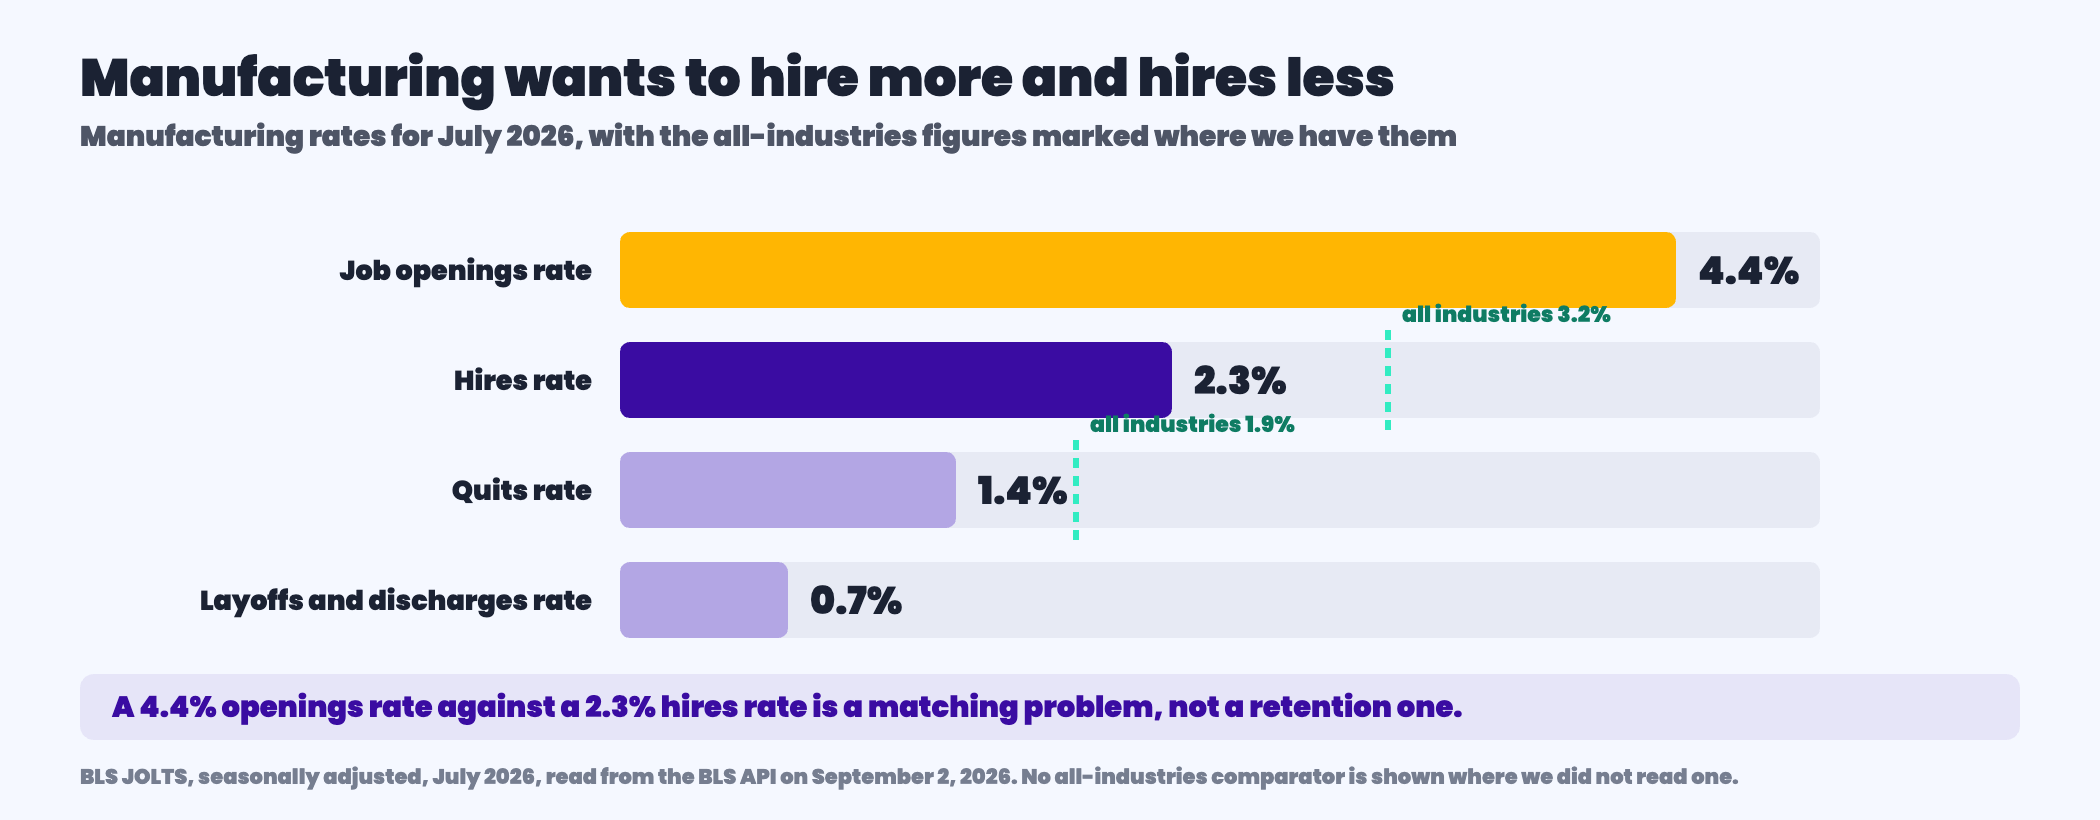
The bar worth staring at is the first one against the second. An openings rate of 4.4% with a hires rate of 2.3% is a sector that is not converting its own demand into people on the floor. In a labor market where the national hires rate is 3.2%, manufacturing is hiring more slowly than average while wanting to hire more than average. Where the constraint is training rather than sourcing, our workforce development grants page sets out what a workforce board will part-fund.
What we can tell you about the top of that funnel
Here our own data starts, and it stops at the application. Across the 891 campaigns in our 2026 social job advertising benchmark, warehouse and production campaigns delivered an applicant at a median of $9.83, with 20% of clickers completing the form. Technician and mechanic roles ran $13.41 at a 16% apply rate, and skilled trades $14.14 at 15%. Technician and mechanic was the largest single role family in the study at 145 campaign-months, which is worth saying because sample size is usually the first thing missing from a benchmark.
The spread inside one role is the finding
Warehouse and production campaigns ran from $3.15 at the lower quartile to $18.72 at the upper — a sixfold difference inside a single role family, in the same period, on the same platform. That gap is not role difficulty and it is not luck. In our data, application completion rate explains 70% of the variation between campaigns and the ad auction explains 18%. For a sector whose problem is filling rather than keeping, that is where the leverage is.
How long does your own gap take to close?
What closing it costs, and what leaving it open costs
Both halves of that sentence have numbers. One of them is ours and one of them is yours, and the second is almost always larger.
Price both sides
Three things that follow for the job ad
Shorten the application before widening the audience. A sixfold cost spread inside warehouse and production, and a hires rate below the national average, both point at the same place: what happens between the click and the completed form. Every screening question you keep is bought with volume, and the campaigns that convert best keep the application on the platform rather than routing to a career site with a login and a resume upload.
Say the shift pattern, because it is the cost you are competing on. A four-by-ten is forty hours and generates no federal overtime, but eight premium hours a week in California and Alaska; a four-by-twelve is eight federally and sixteen in California. We set that out on overtime laws by state. The pattern is also the thing an applicant weighs against the plant down the road, and it is frequently left out of the ad entirely.
Put the range in the posting. Thirteen states and the District of Columbia require it inside the ad already, and Connecticut joins on October 1, 2026, which matters for any manufacturer with plants in more than one state. That is on pay transparency laws by state.
And the honest limit: our data stops at the completed application. Whether an applicant passes a screen, shows up for a shift, or is still there in month three is measured in your systems, not ours. What we would say from the federal numbers is that manufacturing has the rarest of the frontline problems — people stay once they arrive — and that makes the work of getting them there worth more than it would be almost anywhere else. The comparison worth drawing is with the CNA shortage, where the arithmetic runs the opposite way entirely.
CNC machinist and maintenance technician shortages
The sector-wide numbers above describe a filling problem. Two roles are where plants say they feel it most, and the federal projections show they are short for opposite reasons: machining is a shrinking or flat occupation that keeps reopening seats, while maintenance is one of the faster-growing jobs on a plant floor.
The CNC machinist shortage
BLS files "CNC machinist" in two occupations, which is why shortage figures for it rarely agree. Machinists held 288,300 jobs in 2025, projected to grow 1.0% by 2035, with about 26,100 openings a year and a median wage of $58,750 in May 2025; BLS lists long-term on-the-job training. Computer numerically controlled tool operators, where BLS also lists the CNC machinist title, held 170,000 jobs and are projected to shrink 9.4% to 154,100, yet still show about 12,500 openings a year at a median of $50,690, with moderate-term training. The programmers who write the code are a small, growing group: 28,600 jobs, 5.9% growth, about 2,700 openings a year, a $68,120 median (BLS Employment Projections 2025-35).
Read together, those figures say the CNC shortage is not a lack of seats. Employment is flat to falling, so nearly every opening is a machinist who retired, moved to another shop or left the trade. The scarce person is the setup machinist who can read a print, write or edit a program and hold tolerance, and the plentiful one is the operator who loads parts. Advertise them separately, hire operators for aptitude and train them toward setup, and put the machines and controls you run in the ad's first line. The myths and the data are on hiring CNC operators and machinists, and the posting is on our machinist job description.
The maintenance technician shortage
Industrial machinery mechanics, the occupation that covers plant maintenance mechanics who repair production equipment, held 446,900 jobs in 2025 and are projected to reach 526,600 by 2035, growth of 17.8%, with about 44,400 openings a year and a median wage of $64,520 in May 2025 (BLS Employment Projections 2025-35, SOC 49-9041 on its own; the skilled trades pages on this site quote the Occupational Outlook Handbook group that also includes machinery maintenance workers and millwrights, so their figures differ). BLS lists a high school diploma and long-term on-the-job training. Many plants also post "plant maintenance technician", a title BLS files under general maintenance and repair workers: 1,621,800 jobs, 4.2% growth, about 148,700 openings a year and a $49,590 median, an occupation that also covers building and facilities maintenance, so a plant competes with employers in every industry for the same people.
Here, unlike machining, growth is a real part of the problem. The recruiting answer is the same one that works for every scarce trade: reach the technicians already employed at nearby plants, lead with pay, shift and the equipment they will work on, and build an internal path from operator to maintenance. In the Boostpoint 2026 Social Job Advertising Benchmark, the Technician / mechanic family ran a median of $13.41 per applicant, with the middle half between $7.40 and $23.58 and a 16% apply rate. The full playbook is on maintenance technician recruiting.
Frequently asked questions
Is there really a manufacturing labor shortage?
There is a gap between posts open and posts filled, which is real and measurable. In July 2026 the manufacturing job openings rate was 4.4% and the hires rate was 2.3%. What the federal data does not show is a sector losing people quickly or expanding fast: the quits rate was 1.4%, below the national 1.9%, and employment was about 264,000 lower than in January 2024.
Are manufacturing workers quitting more than other workers?
No, and this is the most commonly assumed thing that the data does not support. Manufacturing ran a quits rate of 1.4% in July 2026 against a national quits rate of 1.9% in the same month. Layoffs and discharges ran at 0.7%. On both measures manufacturing is a more stable sector than the economy as a whole, which is why the shortage is better described as a filling problem than a retention one.
Is manufacturing employment growing?
Not currently. The Current Employment Statistics survey put manufacturing employment at 12,611,000 in July 2026, against 12,875,000 in January 2024. That is a fall of roughly 264,000 over two and a half years. A sector can have a genuine hiring gap and shrinking headcount at the same time, and manufacturing does; the two facts are usually reported separately, which is how the confusion starts.
What about the 2.1 million unfilled jobs figure?
We have not used it, because we could not check it. It comes from an industry-commissioned projection rather than a federal measurement, and a projection to 2030 is a model output rather than an observation. The monthly JOLTS and employment series are published by the Bureau of Labor Statistics, are free to pull, and describe what is actually happening rather than what a model expects. Where the two disagree, we would use the measurement.
How much does it cost to recruit a production worker?
In our own data, a median of $9.83 per applicant for warehouse and production campaigns, with 20% of clickers completing the form. Technician and mechanic roles ran $13.41 at a 16% apply rate and skilled trades $14.14 at 15%. Those are advertising costs per applicant, not per hire, and they exclude recruiter time, screening and everything downstream of the completed application.
Why do identical production roles cost so differently to advertise?
Because of what happens after the click. Warehouse and production campaigns ran from $3.15 at the lower quartile to $18.72 at the upper, a sixfold spread inside one role family in the same period. In our data, application completion rate explains 70% of the variation in cost between campaigns and the ad auction explains 18%. The employers at the cheap end had usually removed friction the others had not looked at.
Should we raise pay or advertise more?
We sell advertising, so weigh this accordingly: the federal numbers say manufacturing keeps people better than average, which means pay is doing more work than the sector is usually given credit for. The gap is between an open post and a filled one. If you have not measured how many applicants your process needs to produce one hire, that ratio is worth knowing before either decision, because it converts every other number on this page into money.
What should a production job ad include?
The shift pattern in full, because it is what an applicant compares against the plant down the road and it is frequently omitted. The pay range, which fourteen jurisdictions now require inside the posting anyway. And an application that stays where the ad is, because in our data completion rate is the largest single driver of what a campaign costs and the difference between bands is worth more than anything the auction charges.
Is there a tool and die maker shortage?
Yes, but it is a replacement shortage, not a growth one. BLS projects tool and die maker jobs to fall 9 percent, from 56,700 in 2025 to 51,500 in 2035, yet machinists and tool and die makers together still need about 30,400 openings a year, all from replacing workers who retire or leave. The median tool and die maker wage was $64,050 in May 2025, and most are trained on the job or through apprenticeships.
Is there an assembler shortage?
Not in the federal projections. Miscellaneous assemblers and fabricators, the largest assembly occupation, held 1,403,500 jobs in 2025 and are projected to grow just 1.1% by 2035, yet BLS still projects about 138,700 openings a year, almost all of them replacements, at a median wage of $44,650 in May 2025. Electrical, electronic and electromechanical assemblers are projected to grow 5.0%, with about 25,900 openings a year (BLS Employment Projections 2025-35). The pool is large; the competition is every warehouse and plant nearby, so assembly hiring is won on the stated rate, the shift and a fast reply. See assembly and packaging line recruiting.
The people you hire will stay. Let us help you get them there.
Bring your open positions and the markets your plants sit in. We will show you what applicant flow actually costs there, and where your own funnel is losing people between the click and the form.
Book a Demo




A related point for plant employers: the required workplace notices are free from the agencies that issue them, and we link every official source in labor law posters by state.