
Employer guideRead at source, 3 September 2026
Construction Labor Shortage 2026: Openings vs Hires, Where the Gap Actually Is, and What It Costs to Fill a Crew
In July 2026 construction had 326,000 job openings and made 366,000 hires. That is not a typo, and it is not a one-month fluke: hires exceeded openings in twelve of the last thirteen months. Construction hires at 4.4 percent of employment a month against 3.2 percent across the whole economy, and its opening rate, 3.8 percent, is below the national 4.4 percent. Whatever is wrong in construction hiring, it is not that the industry cannot find people to hire. It is that it separates from them at 1.9 percent a month in layoffs and discharges, nearly double the 1.0 percent economy-wide rate, and unemployment inside the trade swings from 3.7 percent in July to 7.1 percent in January. Every figure here was pulled from the BLS API on 3 September 2026.
Job openings against actual hires, thirteen months of JOLTS
The shortage story is almost always told with one number: job openings. Openings on their own say nothing about whether the openings get filled. Put hires next to them and construction stops looking like an industry that cannot recruit.
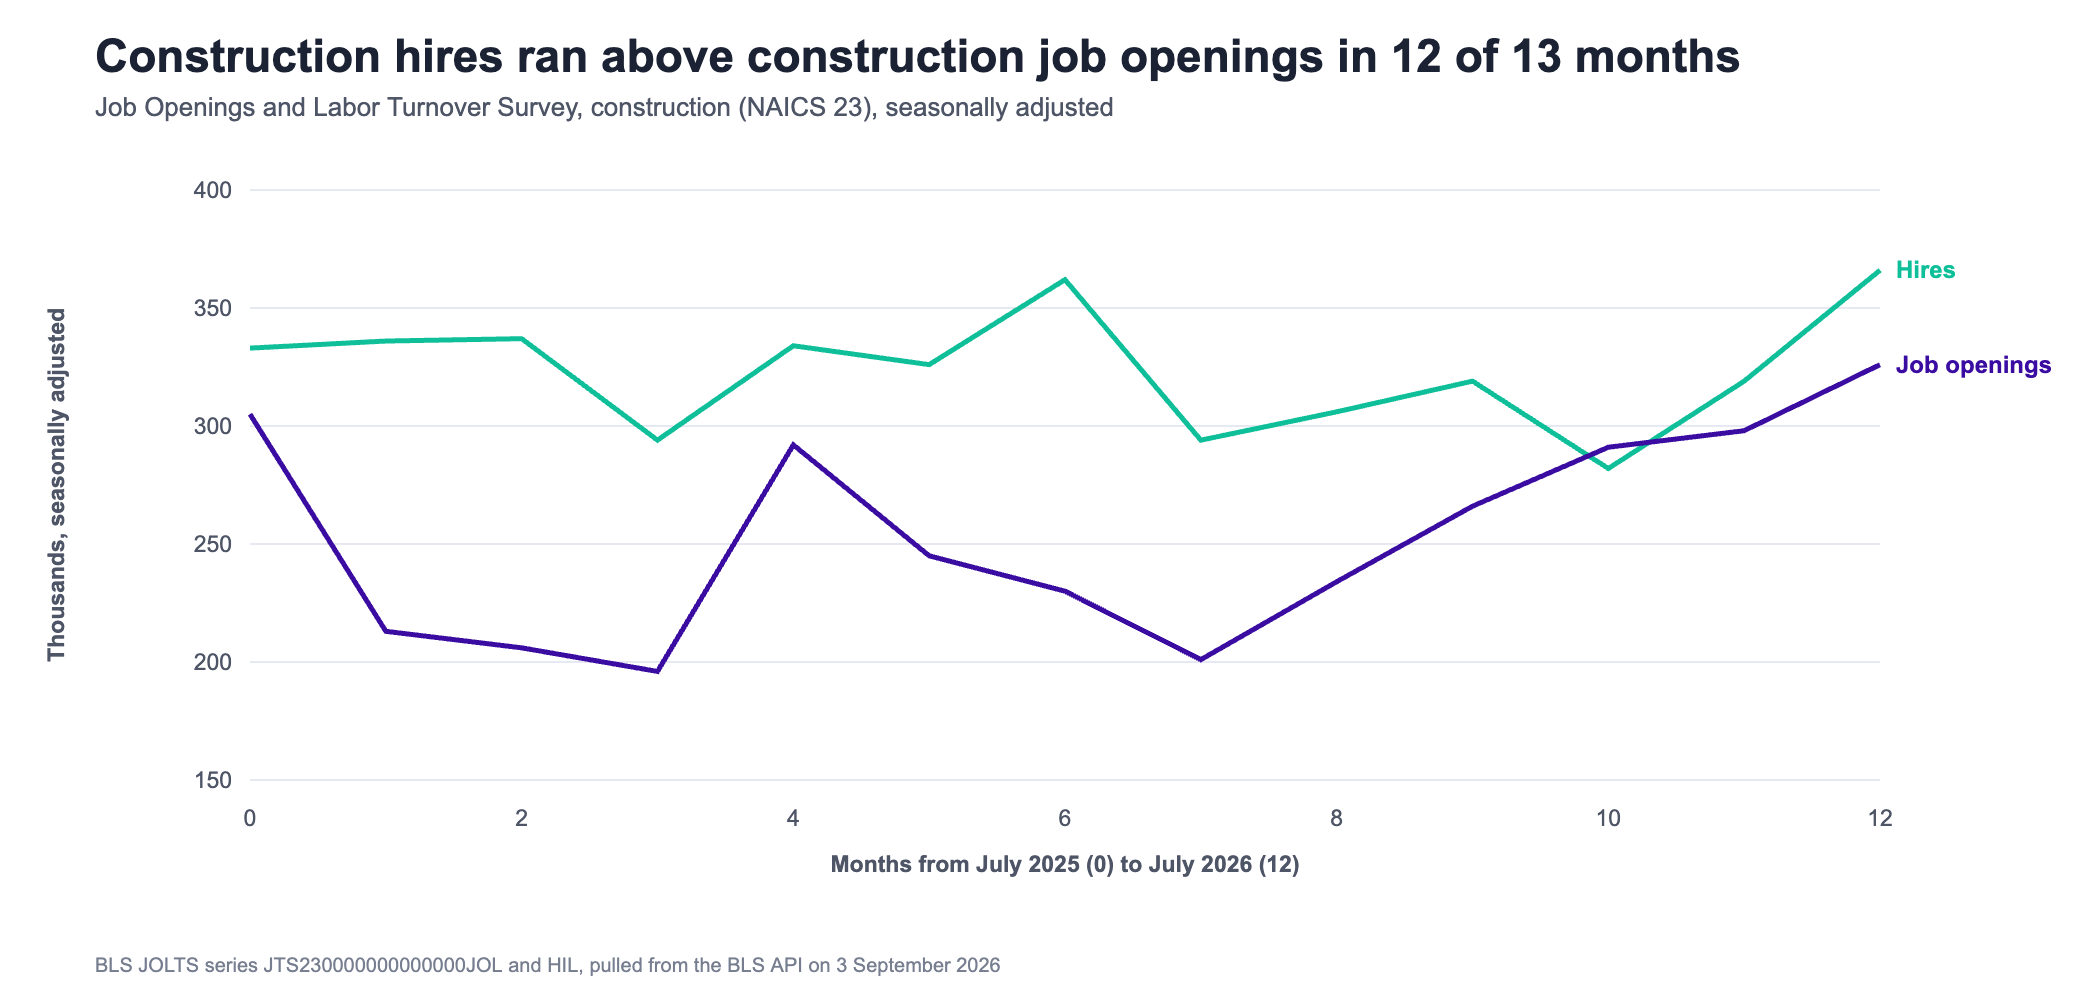
Read the two lines together. Openings fell through late 2025, bottoming at 196,000 in October, and have climbed back to 326,000. Hires barely moved: they sat between 282,000 and 366,000 every single month, indifferent to what openings were doing. An industry that struggles to hire does not hire at a flat rate while its openings halve and double around it. It is placing roughly 4.2 million hires a year into a workforce of 8.3 million.
| JOLTS, July 2026 | Construction | All industries | What the difference means |
|---|---|---|---|
| Job openings | 326,000 (3.8%) | 7,271,000 (4.4%) | Construction runs a lower opening rate than the economy |
| Hires | 366,000 (4.4%) | 5,054,000 (3.2%) | And a hire rate a third higher |
| Quits | 157,000 (1.9%) | 3,056,000 (1.9%) | People leave construction jobs at the national rate, not faster |
| Layoffs and discharges | 158,000 (1.9%) | 1,666,000 (1.0%) | Employers end construction jobs at nearly twice the national rate |
| Total separations | 324,000 | 5,072,000 | Construction loses almost as many in a month as it has open |
| Employer-initiated share | 49% | 33% | Half of construction separations are ended by the employer |
The gap is on the way out, not the way in
Quits are the number people usually reach for when they want to talk about retention, and in construction quits are unremarkable: 1.9 percent a month, exactly the national rate. Construction workers do not walk out more than anyone else. What is different is the other side of the separations ledger. Layoffs and discharges run at 1.9 percent against 1.0 percent nationally, so 49 percent of every separation in construction is the employer ending it, against 33 percent across the economy.
The seasonality shows up in the unemployment data with no ambiguity at all. Unemployment among people whose last job was in construction, not seasonally adjusted, ran at 3.7 percent in July 2026 and 7.1 percent in January, with February at 6.9 and March at 6.7. That is the same workforce, five months apart, with the rate nearly doubled. Nobody left the industry in January. The industry stopped paying them, and a share of them found something else before spring.
Construction hires 4.2 million people a year into a workforce of 8.3 million, and lays off 1.9 million. The pipeline is not the problem. The turnstile is.
This is worth being precise about, because it changes what a contractor should do in the next quarter. If the constraint were supply, the answer would be apprenticeships, schools outreach and a decade of patience. If the constraint is that the industry sheds half its separations by its own hand every winter and then advertises for the same skills every spring, the answer is much nearer to hand: a shorter gap between layoff and recall, a reason to come back to you rather than to the contractor across town, and a list of the people you let go that you can actually reach in March. Our page on how to recruit construction workers covers the channel side of that, and apprenticeship recruiting covers the pipeline you should still be building in parallel.
The recall list is the cheapest hire you will make this year
Put two of the numbers on this page next to each other. A trades applicant costs $9.28 in our campaigns, and roughly 8 percent of applicants become hires, so an outside hire carries about $116 of advertising before anyone has screened a resume or paid for a drug test. A worker you laid off in November and recall in March costs nothing to reach, arrives knowing your sites and your foremen, and needs no orientation. The industry spends the first figure every spring on people it already had.
The reason it does is unglamorous: the list does not exist in a usable form. By March the phone number in payroll is stale, nobody logged which crew the person was on or what they were good at, and the foreman who would have called them has moved to another job. Three things fix most of it, and none of them is a system purchase. Capture a personal mobile number and a text opt-in at onboarding rather than at exit, because nobody fills in a form on their last day. Record trade, level and one line on what the person actually did well, in whatever you already use for scheduling. And name someone who owns the list, because a list nobody owns is a spreadsheet nobody opens.
The number that decides whether they come back
It is not pay. It is how long the gap was and whether anyone told them what to expect. A worker laid off with a date to call back, and a text in February confirming it, is a worker who turns down the contractor across town in March. A worker laid off with nothing said has taken another job by the second week, and you will pay to acquire a stranger in his place. The gap is the variable you control, and it is free.
Trade by trade: how much of a decade of openings is growth
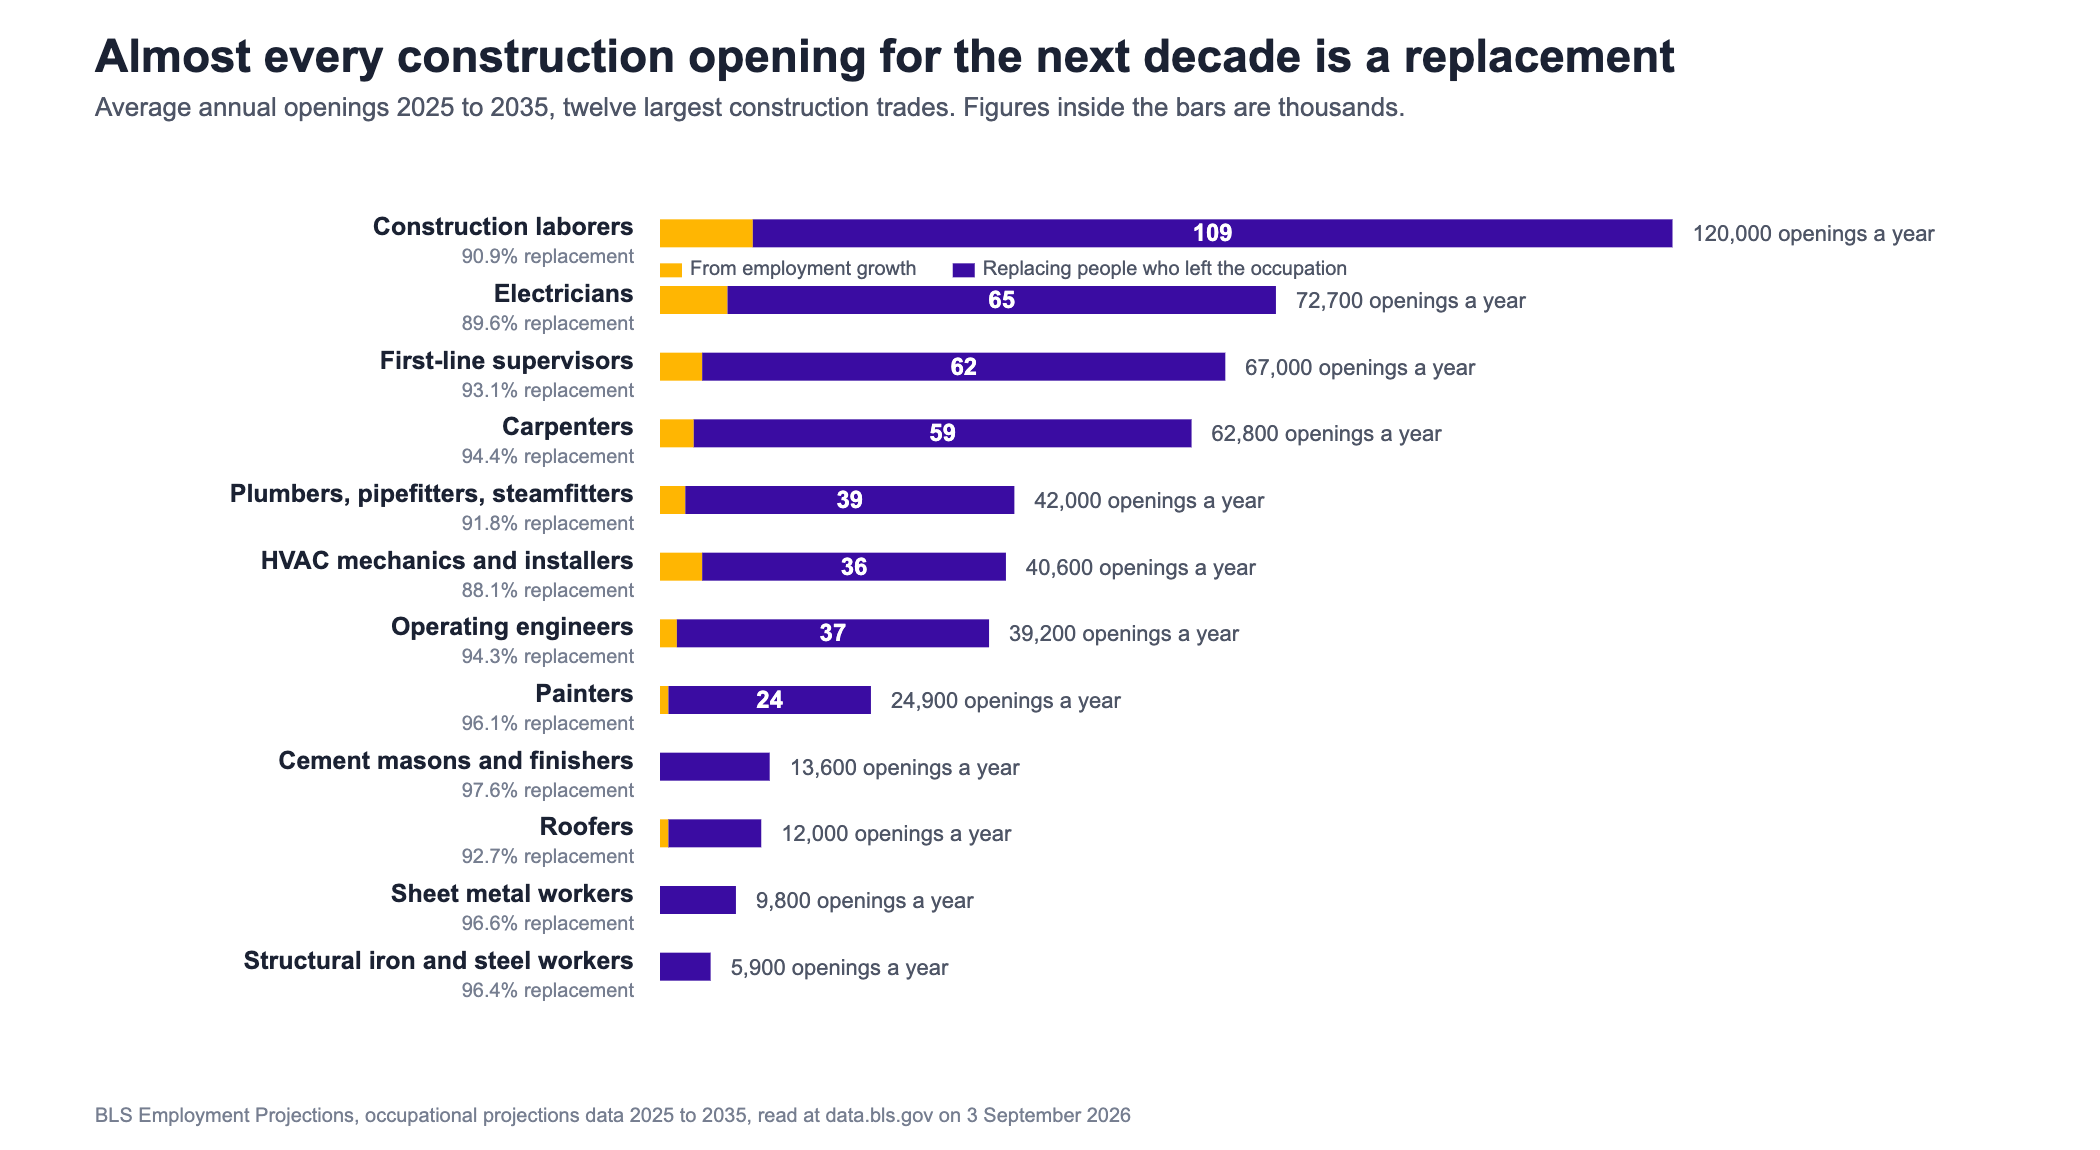
The Employment Projections tables give annual average openings for 2025 to 2035 alongside the projected change in employment. Divide the change by ten and you have the growth component; everything else is replacement, meaning someone left the occupation and has to be replaced. Across the twelve largest construction trades, 92 percent of the 510,500 annual openings are replacements. Only about 39,900 a year exist because the industry is getting bigger.
| Trade | Employed 2025 | Openings a year | From growth | Replacement share | Median wage |
|---|---|---|---|---|---|
| Construction laborers | 1,489,300 | 120,000 | 10,930 | 90.9% | $47,120 |
| Electricians | 821,000 | 72,700 | 7,590 | 89.6% | $63,190 |
| First-line supervisors | 913,300 | 67,000 | 4,610 | 93.1% | $79,920 |
| Carpenters | 889,700 | 62,800 | 3,500 | 94.4% | $60,580 |
| Plumbers, pipefitters, steamfitters | 510,600 | 42,000 | 3,450 | 91.8% | $63,800 |
| HVAC mechanics and installers | 440,900 | 40,600 | 4,820 | 88.1% | $61,010 |
| Operating engineers | 489,500 | 39,200 | 2,230 | 94.3% | $59,850 |
| Painters | 326,900 | 24,900 | 980 | 96.1% | $49,400 |
| Cement masons and concrete finishers | 204,800 | 13,600 | 330 | 97.6% | $57,020 |
| Roofers | 166,900 | 12,000 | 880 | 92.7% | $55,440 |
| Sheet metal workers | 131,100 | 9,800 | 330 | 96.6% | $61,800 |
| Structural iron and steel workers | 68,300 | 5,900 | 210 | 96.4% | $62,780 |
Growth against replacement, by trade
What it costs to fill a crew, and where the money leaks
Here is our own data, labeled as ours. Across Boostpoint trades campaigns in 2025 and 2026, reaching construction workers on social costs $0.84 a click, the lowest cost per click of any industry we advertise for — below healthcare, manufacturing and trucking. Cost per thousand impressions is $13.27. Attention is cheap here, because fewer employers compete for it than the difficulty of hiring would lead you to expect.
The applicant is not cheap, though: $9.28 blended, $10.18 for the median campaign, across an observed range of $1.74 to $62.88. A second cut of the same year, the skilled-trades role family inside our 2026 benchmark, runs a median of $14.14 across 35 campaigns at a 15 percent apply rate; that set leans toward credentialed journeyman roles, which is why it prices higher. Both numbers are ours and neither is a cost per hire. The whole distance between the cheap click and the expensive applicant is one number. Only 9.1 percent of people who click a trades ad finish the application. In manufacturing that figure is 17.2 percent, and manufacturing applicants cost roughly half as much as a direct consequence. If you fixed nothing else about your hiring this year but the application form, you would halve your cost per applicant without touching the budget. The training that follows the hire is a different budget line and a partly fundable one: see workforce development grants.
What is actually on the form
The trades applications we see ask for a resume upload, a license or certification number, an employment history with dates, and three references, on a phone, before anyone has spoken to the candidate. A journeyman electrician standing in a parking lot on his lunch break will not do that. Ask what disqualifies: trade and level, whether they can get to the yard, whether they have their own tools and transport, and when they can start. Everything else waits for the call.
Price a year of crew refill
The projection everyone quotes, and what it is
Every article on this subject cites a figure for how many additional construction workers the industry needs this year. It is a real piece of analysis and it is also commissioned by the contractor associations whose members want the number to be large. It is built on a model of construction spending, not on a count of unfilled jobs, and it is not comparable with anything in the JOLTS series above. The same is true of the annual member survey that reports what share of firms are having difficulty hiring: it measures how hard hiring feels to the people answering, which is a real thing to know and is not a labor supply measurement.
Neither figure is wrong. Both are the wrong instrument for the question a contractor is actually asking, which is whether the people exist within driving distance and what it will cost to get them onto the crew. On that question, the government series says the people exist and are being hired in large numbers every month, and our campaign data says reaching them costs less than reaching any other workforce we buy media for. The bottleneck sits between the click and the completed application, and after that between the layoff and the recall.
Two adjacent pages carry the parts this one deliberately does not repeat. If the work is public, the rate you have to advertise is fixed before you hire anybody: see prevailing wage by state. And the same arithmetic inverts one industry over: in the same month manufacturing carried a 4.4 percent opening rate against a 2.3 percent hire rate, the mirror image of construction, which is the subject of the manufacturing labor shortage page.
Construction worker shortage or construction labor shortage?
The two phrases describe the same JOLTS data and point at different problems. A construction labor shortage is a market statement: more openings than hires, month after month, across the industry. A construction worker shortage is what a single contractor experiences, and it is usually narrower than the market figure suggests — a shortage of one trade, at one skill level, inside one commute radius, at the wage being offered.
The distinction matters because the two have different remedies. The market-level gap is a pipeline problem that takes years of apprenticeship capacity to close, and nothing a single employer does will move it. The employer-level shortage responds to things you control within a week: the radius you advertise in, whether the ad states the wage, how fast you call back, and whether the requirement list is describing the job or describing your last hire. Before concluding you cannot find construction workers, check how many of the applications you already received went unanswered for more than a day.
Construction labor shortage solutions, ranked by how fast they pay back
If the gap is on the way out rather than the way in, the solutions change order. Everything below comes from the figures already on this page: the JOLTS series and our own trades campaign data. The first three cost almost nothing and work within a season. The last one takes years and still needs doing.
| Solution | What it fixes | The number behind it |
|---|---|---|
| Keep a working recall list | Paying to re-acquire people you already trained | About $116 of advertising per outside hire, at $9.28 an applicant and 8 percent of applicants hired |
| Give every laid-off worker a callback date | Winter layoffs turning into permanent losses | 49 percent of construction separations are employer-initiated, against 33 percent economy-wide |
| Cut the application to what disqualifies | Cheap clicks that never become applicants | 9.1 percent of trades clicks finish the application; 17.2 percent in manufacturing |
| Post the wage and call back within a day | Applicants lost between the form and the phone call | Hires ran between 282,000 and 366,000 every month: the people are being hired by someone |
| Advertise where attention is cheap | Paying job-board prices for an audience that is not on job boards | $0.84 a click and $13.27 per thousand impressions, the lowest click cost of any industry we advertise for |
| Build the apprenticeship pipeline in parallel | The replacement load that never ends | 92 percent of the 510,500 annual openings across the twelve largest trades are replacements |
Read the table from the top. A contractor who does only the first row stops buying back its own crew every spring. One who does the first four has changed nearly every number on this page that is under its control, without adding a dollar of budget. The fifth decides what the remaining outside hires cost: in our 2026 benchmark the skilled trades role family ran a $14.14 median cost per applicant at a 15 percent apply rate across 35 campaigns, and the form is the biggest single lever on that figure. The sixth is the only answer to the replacement arithmetic, and it is also the slowest, which is why it belongs alongside the others rather than instead of them.
What does not appear in the table is the solution most often proposed: waiting for the national pipeline to catch up. The government series says the people are there and being hired every month. The constraint that is left is the one between the layoff and the recall, and that one belongs to the employer.
Frequently asked questions
Is there really a construction labor shortage in 2026?
Not in the sense of jobs going unfilled for want of applicants. In July 2026 construction had 326,000 job openings and made 366,000 hires, and hires exceeded openings in twelve of the previous thirteen months. Construction also hires at 4.4 percent of employment a month against 3.2 percent economy wide. What construction has is a separations problem: employers end jobs at nearly twice the national rate.
How many construction job openings are there right now?
326,000 in July 2026, seasonally adjusted, which is a job opening rate of 3.8 percent. That is below the all industry opening rate of 4.4 percent. Openings in construction bottomed at 196,000 in October 2025 and have climbed steadily since. The figures come from the Job Openings and Labor Turnover Survey and are revised in later releases.
Why does construction lay off so many workers?
Layoffs and discharges run at 1.9 percent of construction employment a month against 1.0 percent across all industries, so about 49 percent of every separation is the employer ending the job rather than the worker leaving. Most of it is project and weather driven. Unemployment among people whose last job was in construction ran 3.7 percent in July 2026 and 7.1 percent in January.
Which construction trades are hardest to hire?
By volume of annual openings, construction laborers at 120,000 a year, electricians at 72,700, first line supervisors at 67,000 and carpenters at 62,800. By how little of that demand comes from growth, cement masons are the extreme case at 97.6 percent replacement, followed by sheet metal workers at 96.6 and structural iron and steel workers at 96.4.
How much of construction hiring demand is growth?
Across the twelve largest construction trades, about 8 percent. Those trades average 510,500 openings a year between 2025 and 2035, of which roughly 39,900 exist because the industry is getting bigger. The other 470,600 are replacements for people leaving the occupation. Hiring in construction is therefore a permanent function rather than a project you finish.
What does it cost to recruit a construction worker?
In our 2025 and 2026 trades campaigns, 84 cents a click and 9 dollars 28 an applicant blended, with the median campaign at 10 dollars 18 and an observed range from 1 dollar 74 to 62 dollars 88. At a typical 8 percent applicant to hire rate that is roughly 116 dollars of advertising per hire. Advertising cost only, and it buys an applicant rather than a hire.
Why is cost per applicant so high when clicks are cheap?
Because only 9.1 percent of people who click a trades ad finish the application. The same click in manufacturing converts at 17.2 percent, which is why manufacturing applicants cost about half as much. Cost per applicant is cost per click divided by completion rate, so shortening the form moves the number directly and immediately, with no change in budget.
Is the shortage figure the industry publishes reliable?
It is a genuine model, commissioned by the contractor associations, of how many additional workers the industry would need to support forecast construction spending. It is not a count of unfilled jobs and it is not comparable with the JOLTS openings series. Treat it as an argument about capacity rather than as a measurement of labor supply, and read it alongside the government series rather than instead of it.
The posting itself is the cheapest thing to fix while the pool stays tight. Our construction laborer job description template covers the requirement lines that quietly remove applicants from a general-labor ad.
Is there a carpenter shortage?
Yes, mostly as a replacement shortage. BLS counts 889,700 carpenter jobs in 2025, projects 4 percent growth to 2035, and expects about 62,800 openings a year, many of them from replacing carpenters who retire or change occupations. The median wage was $60,580 in May 2025. Carpenters typically learn on the job and through apprenticeships, so a contractor that trains helpers is building part of its own supply.
Is there a crane operator shortage?
It is a small, credential-gated market rather than a large shortage. BLS counts 42,900 crane and tower operator jobs in 2025, projected to reach 44,500 by 2035, a 4 percent rise, with a median wage of $68,080 in May 2025. In construction, OSHA's 29 CFR 1926.1427 requires each operator to be trained, certified or licensed, and evaluated before operating covered equipment, so the qualified pool is fixed in the short run.
Is there a laborer shortage?
Construction laborers are the biggest single source of openings in the trade table above, but not because the jobs are scarce to create. BLS projects 1,489,300 construction laborer jobs in 2025 growing 7.3% by 2035, with about 120,000 openings a year and a median wage of $47,120 in May 2025; about 91% of those openings replace laborers who leave the occupation. BLS lists no formal educational credential and short-term on-the-job training, so the pool is large and the competition for it (from warehouses, landscapers and other contractors) is what makes a laborer hard to hire. The fixes are the ones on this page: the recall list first, then pay, start date and jobsite in the ad's first line, a short form and a same-day call. The posting is on our construction laborer job description.
Hiring trades right now?
The people are within thirty miles of your yard, they are employed, and they are not on a job board. We put the ad in front of them, keep the form short enough to finish on a phone, and tell you what each applicant cost.
Book a DemoOne small saving while you are competing for trades: nobody has to buy workplace posters. The official free source for every state is in labor law posters by state.