
Cost Per Hire in Restaurants and Food Service: What the Benchmarks Say, Why Turnover Multiplies It, Where a Restaurant's Hiring Cost Actually Goes, and Two Calculators That Use Your Numbers
No restaurant-specific cost-per-hire benchmark with a primary source exists that we could verify. The nearest published figure is SHRM's cross-industry average for nonexecutive hires, $5,475 (2025 Benchmarking Reports, October 15, 2025), and it's the wrong shape for a restaurant, where each hire is cheap and there are so many of them: the BLS quits rate for accommodation and food services was 4.5% a month in June 2026 — more than double the 2.0% for all employment — and Black Box Intelligence puts hourly turnover at 110% in limited service and about 92% in full service. Boostpoint publishes no restaurant cost figure of any kind; our benchmark has no restaurant row, and cost per applicant is not cost per hire. What a restaurant can do is count its own six lines — the no-shows, the trail shift, the training hours, the card, the uniform, the ad — and the two calculators below do that on your numbers.
A note on who's writing this
Boostpoint runs recruitment ads on social platforms, and our published benchmark of 891 campaigns has no restaurant, hospitality or kitchen row in it, so this page asserts no Boostpoint cost of any kind for restaurant hiring — not per applicant, and never per hire. Where our data appears it's the adjacent customer service row, labeled adjacent, or the campaign structures, which are about how to run a campaign rather than what a cook costs. Every cost-per-hire figure is a third party's, named and dated; every turnover and volume figure is the BLS's, the National Restaurant Association's or Black Box Intelligence's. We hold a hard rule against publishing a cost per hire computed from ad data, and this page follows it to the letter: the calculators take your interviews, your no-show rate, your wages and your hires, and the number they produce is yours. Nothing here is financial or legal advice.
The case for a restaurant cost-per-hire number, made first
An operator running at 100% turnover is refilling the whole roster every year, and the money that costs is invisible on the P&L because it's spread across line items that have other names: the manager's Tuesday afternoon spent waiting for interviews that don't show, the trail shift paid to someone who won't come back, the food handler card and the two shirts, the week a new line cook runs the station at half speed. A cost per hire that totals those and divides by hires is the only way to see the number, to compare a referral bonus against a job board on the same basis, and to put a value on turnover that a general manager will act on. The standard definition is all internal and external recruiting costs in a period divided by hires — the glossary entry has the formula — and a restaurant's version has to include the lines a corporate benchmark leaves out, because in a restaurant they're most of the cost. The case is right; what it needs is the operator's own six lines, which is what the ledger below is for.
What the third-party benchmarks say, and why they're the wrong shape
SHRM's 2025 Benchmarking Reports, announced October 15, 2025, put the average cost per hire at $5,475 for nonexecutive positions and $35,879 for executives ("nearly 7x"), up from "nearly $4,700" in April 2022. That's a cross-industry figure cut by position level, dominated by salaried seats with recruiters, screens and relocation, and it's the only benchmark with a primary source we'd print. A restaurant's number is nothing like it, and not because restaurants hire cheaply so much as because they hire constantly: a per-hire figure that's a tenth of SHRM's, paid a hundred times a year, is the larger bill. We looked for a restaurant-specific benchmark we could trace to a survey with a method and didn't find one; the figures in circulation are vendor estimates or repeat each other, and we'd rather show the gap than fill it with a number nobody measured.
| Figure | Scope | Source | Date |
|---|---|---|---|
| $5,475 average cost per hire | Nonexecutive positions, cross-industry, SHRM respondents | SHRM, "SHRM Releases 2025 Benchmarking Reports" | October 15, 2025 |
| $35,879 average cost per hire | Executive positions, "nearly 7x" nonexecutive | SHRM, same release | October 15, 2025 |
| "Nearly $4,700" average cost per hire | Cross-industry, SHRM respondents | SHRM | April 11, 2022 |
| No verified figure | Restaurants, food service or hospitality specifically | None with a primary source we could confirm | Checked August 27, 2026 |
Which turnover number you multiply by matters as much as the cost itself: the published figures for this sector range from 66% to over 110% depending on who is counted. Employee turnover in hospitality sets out which figure belongs against which population.
Why turnover multiplies it: the BLS and NRA figures
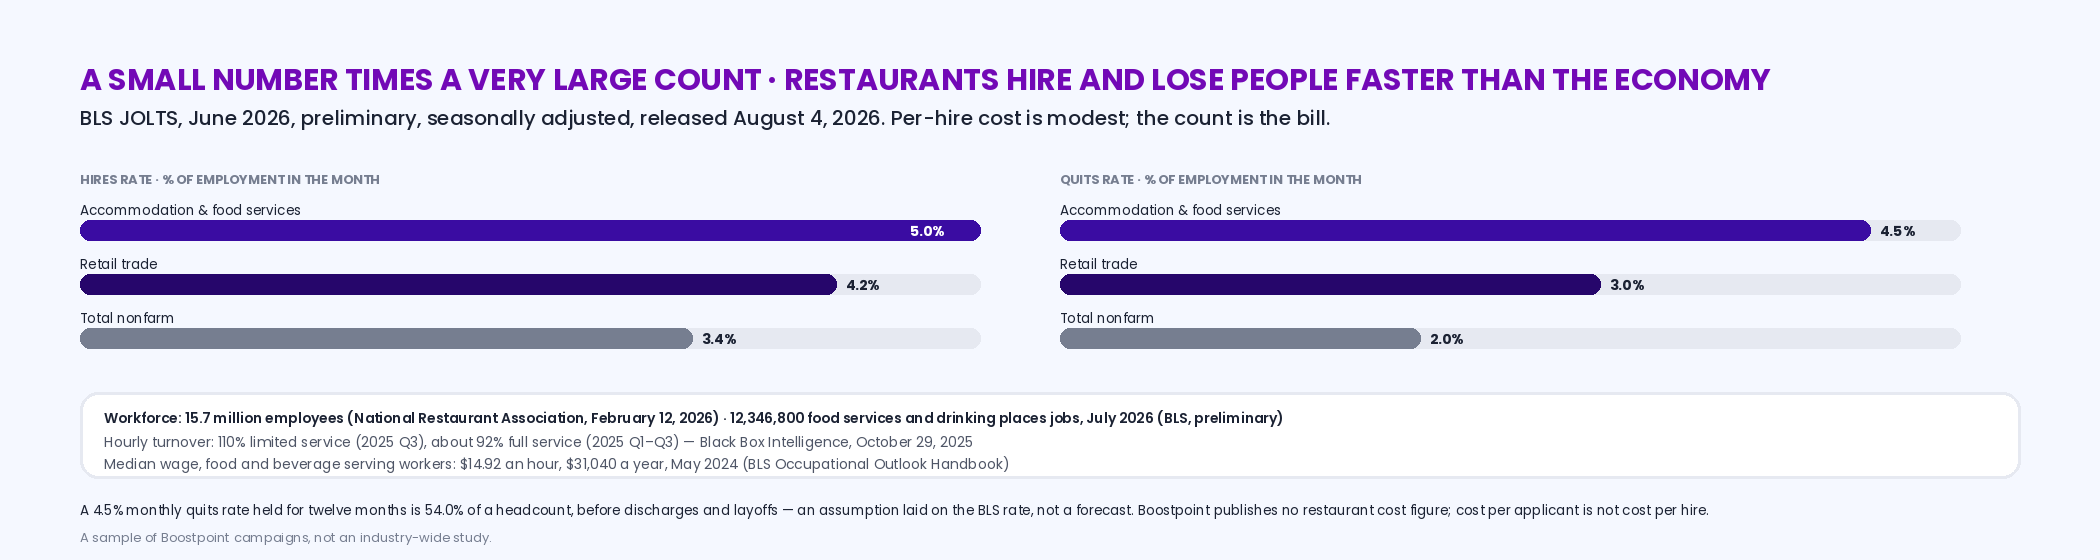
The restaurant workforce is large and it moves. The National Restaurant Association's 2026 State of the Restaurant Industry report (February 12, 2026) describes "a workforce of 15.7 million employees," projected to reach 15.8 million jobs in 2026 as operators add more than 100,000, and notes that "nearly three quarters of operators plan to hire but expect difficulties finding experienced managers and chefs." The BLS counts food services and drinking places at 12,346,800 jobs in July 2026 (seasonally adjusted, preliminary), inside 14,266,200 for accommodation and food services and 16,931,000 for leisure and hospitality. The churn is the striking part. In the BLS Job Openings and Labor Turnover Survey for June 2026 (released August 4, 2026), accommodation and food services ran a hires rate of 5.0% of employment in a single month against 3.4% for all nonfarm employment, and a quits rate of 4.5% against 2.0% — 638,000 people quit restaurant and hotel jobs in one month. Retail trade, the sector it's most often compared with, ran 4.2% and 3.0%. Held flat for twelve months, a 4.5% monthly quits rate is 54.0% of a headcount walking out before any discharge or layoff; Black Box Intelligence's rolling twelve-month hourly turnover, which counts every separation, ran 110% in limited service (2025 Q3) and about 92% in full service (2025 Q1–Q3). And the pool is paid modestly: the BLS puts the median wage for food and beverage serving and related workers at $14.92 an hour ($31,040 a year) in May 2024 across 5,030,600 jobs, adding that "most get their earnings from hourly wages alone." Put those together and a restaurant's cost per hire is not one number to admire; it's a small number times a very large count.
| Sector | Job openings | Openings rate | Hires | Hires rate | Quits | Quits rate |
|---|---|---|---|---|---|---|
| Accommodation and food services | 684 | 4.6% | 715 | 5.0% | 638 | 4.5% |
| Retail trade | 774 | 4.8% | 652 | 4.2% | 471 | 3.0% |
| Total nonfarm | 7,359 | 4.4% | 5,348 | 3.4% | 3,232 | 2.0% |
Where a restaurant's cost per hire actually goes
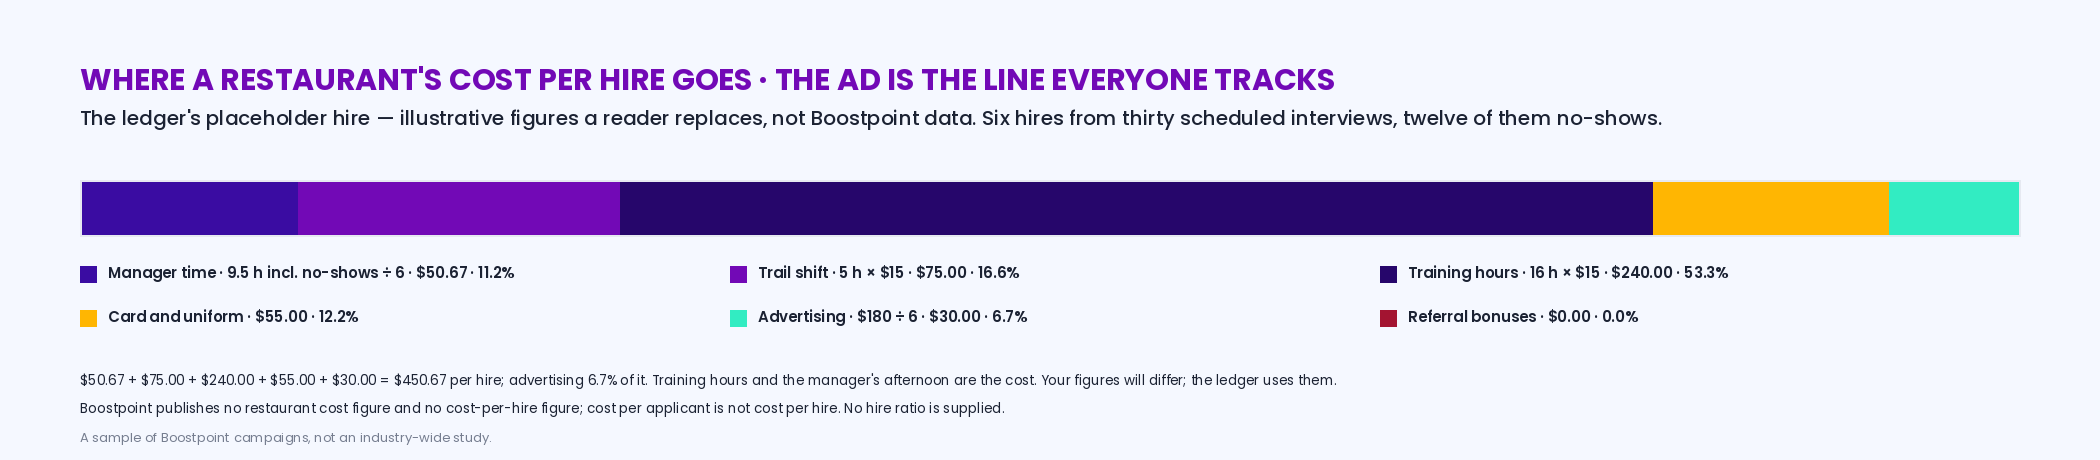
A corporate benchmark counts recruiter salaries, agency fees and relocation. A restaurant's cost per hire is made of different lines, and the largest ones are the ones nobody totals. The no-shows. Interviews in hourly hiring are scheduled in blocks and a share of them don't show; the manager's time is spent either way, and the cost of every held interview has to carry the empty slots around it. The trail shift. A server trails, a cook stages: paid hours for someone who may not take the job, and who hasn't produced anything yet if they do. The training hours. The first week or two at reduced speed on a station or a section, with someone else covering. The card and the uniform. A food handler card or a manager certification, the shirts, the non-slip shoes if you provide them. The advertising — the posting, the sponsored listing, the social campaign — which in most restaurants is the smallest line and the only one anybody tracks. And the referral bonus, when one is paid, which is often the best-spent line on the list. A cost per hire that only counts the last two is a cost per applicant with a hire ratio attached; the ledger below asks for all of them, starts with the no-show arithmetic because that's where the manager's hours go, and shows what share the ad line is on your figures.
Interactive
Restaurant cost-per-hire ledger — your interviews and no-show rate, your wages and hours, your cards and shirts, your ad spend and hires; get the manager time per hire, the six-line ledger, your cost per hire and the ad line's share
Nothing is stored or sent — this runs in your browser. Every input is yours; the defaults are illustrative placeholders, not Boostpoint data, and the result is your cost per hire, not ours. We supply no hire ratio and no restaurant figure.
—
held interviews and no-shows, ÷ hires
—
six lines, per hire
—
of your cost per hire
What Boostpoint's data says about restaurants, which is almost nothing
Honesty first: our 2026 benchmark has no restaurant, hospitality or kitchen row, and we don't imply one. The nearest row is customer service and administrative work, which ran a median $2.71 per applicant ($2.98 blended, 25% apply rate, 24 campaigns); it is adjacent evidence that high-turnover hourly roles with no credential gate produce applicants cheaply on a social feed, and it is not a restaurant figure. What our data does say about restaurants is structural. Across 1,334 campaign-months, an event-driven campaign built around a dated hiring day cost a median $8.02 per applicant at a 21% apply rate (78 campaigns); a multi-role always-on campaign $9.83 at 12% (46); a single-role posting $14.45 at 18% (1,210). A restaurant that hires every month should run like the first two and not the third, and the hospitality recruiting page builds the month around that; servers and line cooks have their own pages. Whatever the applicant costs, it's one line of the ledger above, and on most restaurant ledgers a small one; the manager's afternoon and the training hours are where the money is, and the lever that moves the total is the turnover rate. What that rate actually is, in the two forms it gets published in, is set out on restaurant turnover rate.
What ten points of turnover are worth
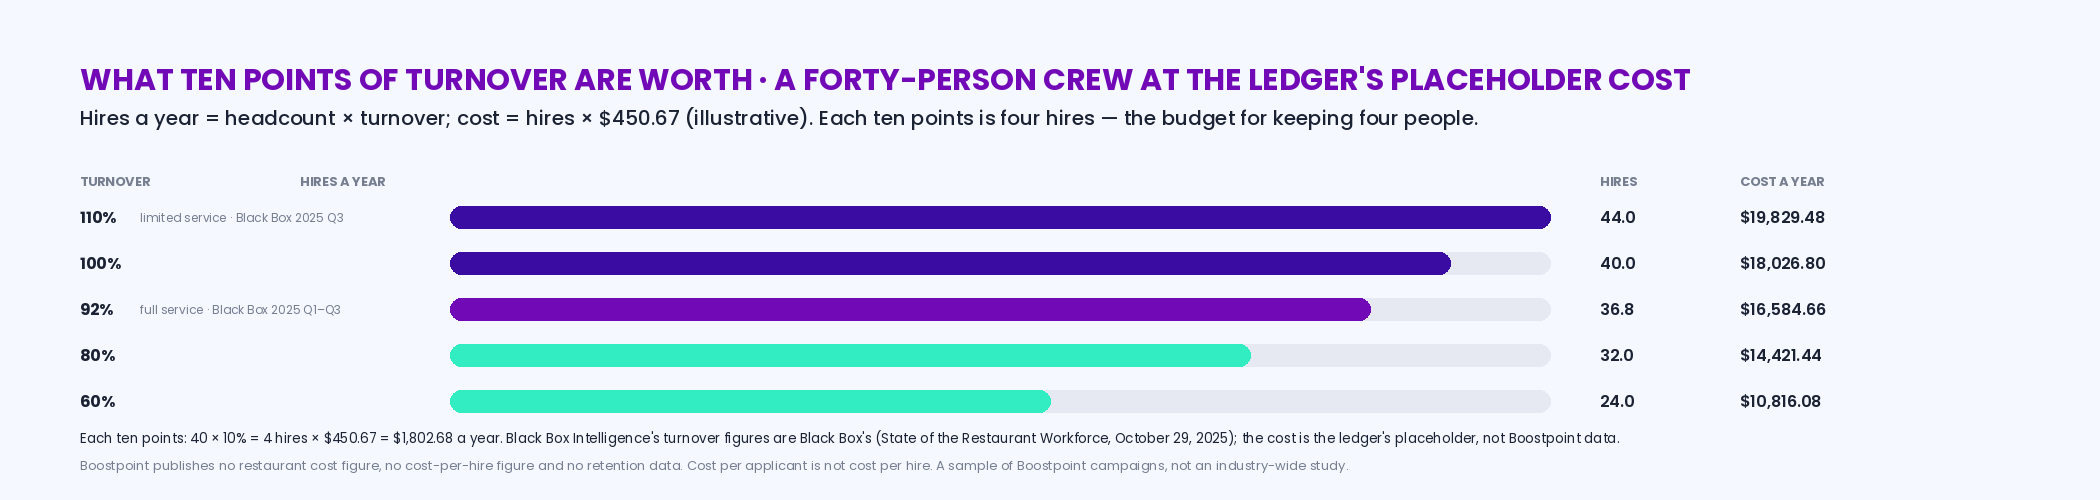
Because the count is the cost, the most useful number for an operator isn't the cost per hire; it's what each ten points of turnover are worth at that cost. Forty hourly employees at 110% turnover is 44 hires a year; at 100% it's 40; the four hires between them, at whatever your ledger says a hire costs, is the budget for whatever would keep four people — a completion bonus, a schedule posted two weeks out, a manager who calls the same day, a first 90 days with a plan. The calculator takes your hourly headcount, your turnover (Black Box's 110% and 92% are there as quick settings if you don't track yours), and the cost per hire from the ledger, and lays out the year at each turnover level so the value of every ten points is a number you can put against the thing that would earn it.
Interactive
Turnover points calculator — hourly headcount, annual turnover and your cost per hire; get hires a year, the year's replacement cost, what each ten points is worth, and the ladder from where you are to where you'd like to be
Nothing is stored or sent — this runs in your browser. Turnover defaults to Black Box Intelligence's chain figures; yours from payroll is better. The cost per hire is yours, from the ledger above or your own books.
—
headcount × turnover
—
hires × your cost per hire
—
headcount × 10% × cost per hire
The general version of this problem — one hire, three defensible definitions, three different answers — is on the cost per hire calculator, which also carries the median from the same SHRM survey the mean comes from, and it is a long way from the mean.
When the cost per hire is the wrong question
Three cases. A new opening, where forty hires in six weeks are a project with a budget, not a rate, and the question is the hiring event and the trail schedule rather than a per-hire average. A single manager or chef seat — the one the NRA's operators say they'll struggle to fill — where one hire a year makes any average meaningless and the cost that matters is the months the GM covers the line. And a unit whose turnover is far above the chain's: there the cost per hire is a symptom, the number worth computing is what ten points would be worth, and the fix is usually a schedule, a manager or the first two weeks, none of which the ledger prices. The cost per hire is the right question for a unit that hires steadily and wants to know what a referral bonus, a hiring day or an agency is worth against what it already spends; for that unit, build the ledger from your own lines and revisit it each quarter.
For the other half of the picture — what the whole industry spends on wages as a share of sales, and why that share has fallen for six years while the hourly rate rose 56 percent — see restaurant labor costs.
Frequently asked questions
What is the average cost per hire for a restaurant?
No restaurant-specific benchmark with a primary source exists that we could verify. The nearest published figure is SHRM's cross-industry average for nonexecutive positions, $5,475, from its 2025 Benchmarking Reports (October 15, 2025), and it's the wrong shape for a restaurant, where each hire is cheap and there are many of them. A restaurant's own number comes from six lines — manager time including no-shows, the trail shift, training hours, card and uniform, advertising, referral bonuses — divided by hires, which the ledger on this page computes on your figures.
How do you calculate cost per hire in food service?
Total the manager's interview hours (held interviews plus the time lost to no-shows) at a loaded rate, the paid trail or stage hours, the training hours at reduced speed, the food handler card and uniform, the advertising and any referral bonuses for a period, and divide by the hires that started. Count starts, not offers. The no-show line is the one most restaurants leave out and it's often the largest after training.
Why is restaurant cost per hire so high in total?
Volume. The BLS quits rate for accommodation and food services was 4.5% a month in June 2026 against 2.0% for all employment, with a 5.0% hires rate against 3.4%; Black Box Intelligence puts hourly turnover at 110% in limited service and about 92% in full service. A modest per-hire cost paid on the whole roster every year is the bill, which is why each ten points of turnover is worth more than any saving on the advertising line.
What does a restaurant applicant cost to advertise for?
We don't publish a restaurant figure: our 2026 benchmark has no restaurant, hospitality or kitchen row. The adjacent customer service and administrative row ran a median $2.71 per applicant ($2.98 blended, 25% apply rate, 24 campaigns), which is evidence that high-turnover hourly roles without a credential gate produce applicants cheaply on a social feed, and not a restaurant number. Cost per applicant is not cost per hire in any case.
Can you turn cost per applicant into a restaurant cost per hire?
Only you can, by dividing your own applicants by your own hires and multiplying; any vendor doing it for you is assuming the ratio. We publish no cost per hire from our data, supply no ratio, and the calculators on this page use only your interviews, wages, hours and hires.
How much does restaurant turnover cost a year?
Hourly headcount times annual turnover gives hires a year; times your cost per hire gives the year. Forty hourly employees at Black Box's 110% is 44 hires; on the ledger's illustrative $450.67 per hire that's $19,829.48, and each ten points of turnover is four hires or $1,802.68 — your figures will differ, and the calculator uses them. The lever is the turnover rate, and most exits happen early.
Is a staffing agency cheaper than hiring restaurant staff directly?
For a banquet or a surge, often; for the regular schedule, rarely, because the markup is paid on every hour worked against a turnover rate near 100%, while a cost per hire is paid once per refill. The hospitality staffing agency cost page has the markup math; the comparison only works if agency spend is inside your cost-per-hire total for the seats it filled.
How is this page different from the hospitality recruiting page?
That page is about recruiting for the month — replacement math in applicants, campaign structures, the ad. This page is about the cost-per-hire question: the benchmarks that exist and why they're the wrong shape, the BLS and NRA volume figures, the six lines a restaurant's cost per hire is actually made of, and two calculators — a no-show-adjusted ledger and a turnover-points calculator — that compute on your numbers rather than ours.
Count the ledger; run the month
Bring your roster, last month's interviews and no-shows, and your turnover. We'll build the campaign structure a restaurant that hires every month should run — a hiring day or a standing multi-role campaign, one ad per shift, a three-question form — and report what it costs, and we'll leave the cost per hire where it belongs: in your ledger, computed by you.
Book a DemoBoostpoint figures come from the 2026 Social Job Advertising Benchmark — 891 campaigns and 1,334 campaign-months: campaign structures event-driven $8.02 median cost per applicant, 21% apply rate, 78 campaigns; multi-role $9.83, 12%, 46; single-role $14.45, 18%, 1,210; customer service and administrative $2.71 median, $2.98 blended, 25%, 24 campaigns, used here only as adjacent evidence. The benchmark contains no restaurant, hospitality or kitchen row and none is implied. Third-party, verified August 27, 2026 unless noted: SHRM, "SHRM Releases 2025 Benchmarking Reports," October 15, 2025 — nonexecutive average cost per hire $5,475, executive $35,879, "nearly 7x"; SHRM, April 11, 2022 — "nearly $4,700"; BLS JOLTS, June 2026, preliminary, seasonally adjusted, released August 4, 2026 — accommodation and food services openings 684,000 (4.6%), hires 715,000 (5.0%), quits 638,000 (4.5%); retail trade 774,000 (4.8%), 652,000 (4.2%), 471,000 (3.0%); total nonfarm 7,359,000 (4.4%), 5,348,000 (3.4%), 3,232,000 (2.0%); BLS Current Employment Statistics, July 2026, preliminary, seasonally adjusted — food services and drinking places 12,346,800; accommodation and food services 14,266,200; leisure and hospitality 16,931,000; BLS Occupational Outlook Handbook, "Food and Beverage Serving and Related Workers," modified August 28, 2025 — median $14.92 an hour, $31,040 a year, May 2024; 5,030,600 jobs, 2024; National Restaurant Association, 2026 State of the Restaurant Industry, press release February 12, 2026 — "a workforce of 15.7 million employees," 15.8 million jobs projected for 2026, more than 100,000 jobs added, "nearly three quarters of operators plan to hire but expect difficulties finding experienced managers and chefs"; Black Box Intelligence, State of the Restaurant Workforce, October 29, 2025 — rolling twelve-month hourly turnover 110% limited service (2025 Q3), about 92% full service (2025 Q1–Q3). No restaurant-specific cost-per-hire benchmark with a primary source could be verified. Arithmetic: 4.5% × 12 = 54.0%; ledger placeholders 30 interviews scheduled, 18 held and 12 missed, 18 × 25 + 12 × 10 = 570 minutes = 9.5 hours × $32 = $304.00 ÷ 6 = $50.67; 5 × $15 = $75.00; 16 × $15 = $240.00; $55; $180 ÷ 6 = $30.00; total $450.67, advertising 6.7%; 40 × 110% = 44 × $450.67 = $19,829.48; ten points = 4 × $450.67 = $1,802.68. Boostpoint is priced as a product subscription plus ad spend: the subscription is priced on job volume and quoted on a call, ad spend is separate and recommended at a minimum of $750 a month per job category, there is one bill, through Boostpoint, and every cost-per-applicant figure we publish includes campaign management. Boostpoint publishes no restaurant cost figure, no cost-per-hire figure and no retention data; cost per applicant is not cost per hire, and no hire ratio is supplied or assumed on this page. A sample of Boostpoint campaigns, not an industry-wide study.