
Cost per hire calculator: one hire, three defensible answers
Cost per hire is a definition before it is a measurement. SHRM's 2025 benchmarking survey returns a mean of $5,475 and a median of $1,200 for the same nonexecutive roles, from the same 2,371 respondents — $4,275 apart. The calculator below takes one set of your numbers and returns three cost-per-hire figures, so you can see what your definition is worth before you defend it.
A note on who's writing this
Boostpoint sells managed recruitment advertising. We measure what an applicant costs; we cannot see your hires, because those happen in your applicant tracking system. So this page will not give you a cost per hire from our data, and no vendor whose evidence is ad-platform data can honestly give you one. What we can do is show why the number is so slippery, and hand you a calculator that makes that visible rather than hiding it behind one confident figure.
The case for a cost-per-hire number, made first
The metric earns its place. It is the only figure that puts advertising, agency fees, recruiter time and onboarding in one unit, so it is the only way to compare a staffing agency's invoice with an in-house process on like terms. It travels: a finance director who will not read an apply-rate chart will read a cost per hire. And tracked against your own baseline it catches a process getting more expensive before anyone feels it.
The problem is not the metric. It is that two competent people can compute it from identical facts and land far apart, because nothing settles what belongs inside it. Cost per hire is also only the one-time part of the bill; what the person costs to employ each year afterward, taxes and benefits included, is what our employee cost calculator works out.
Why the same survey reports $5,475 and $1,200
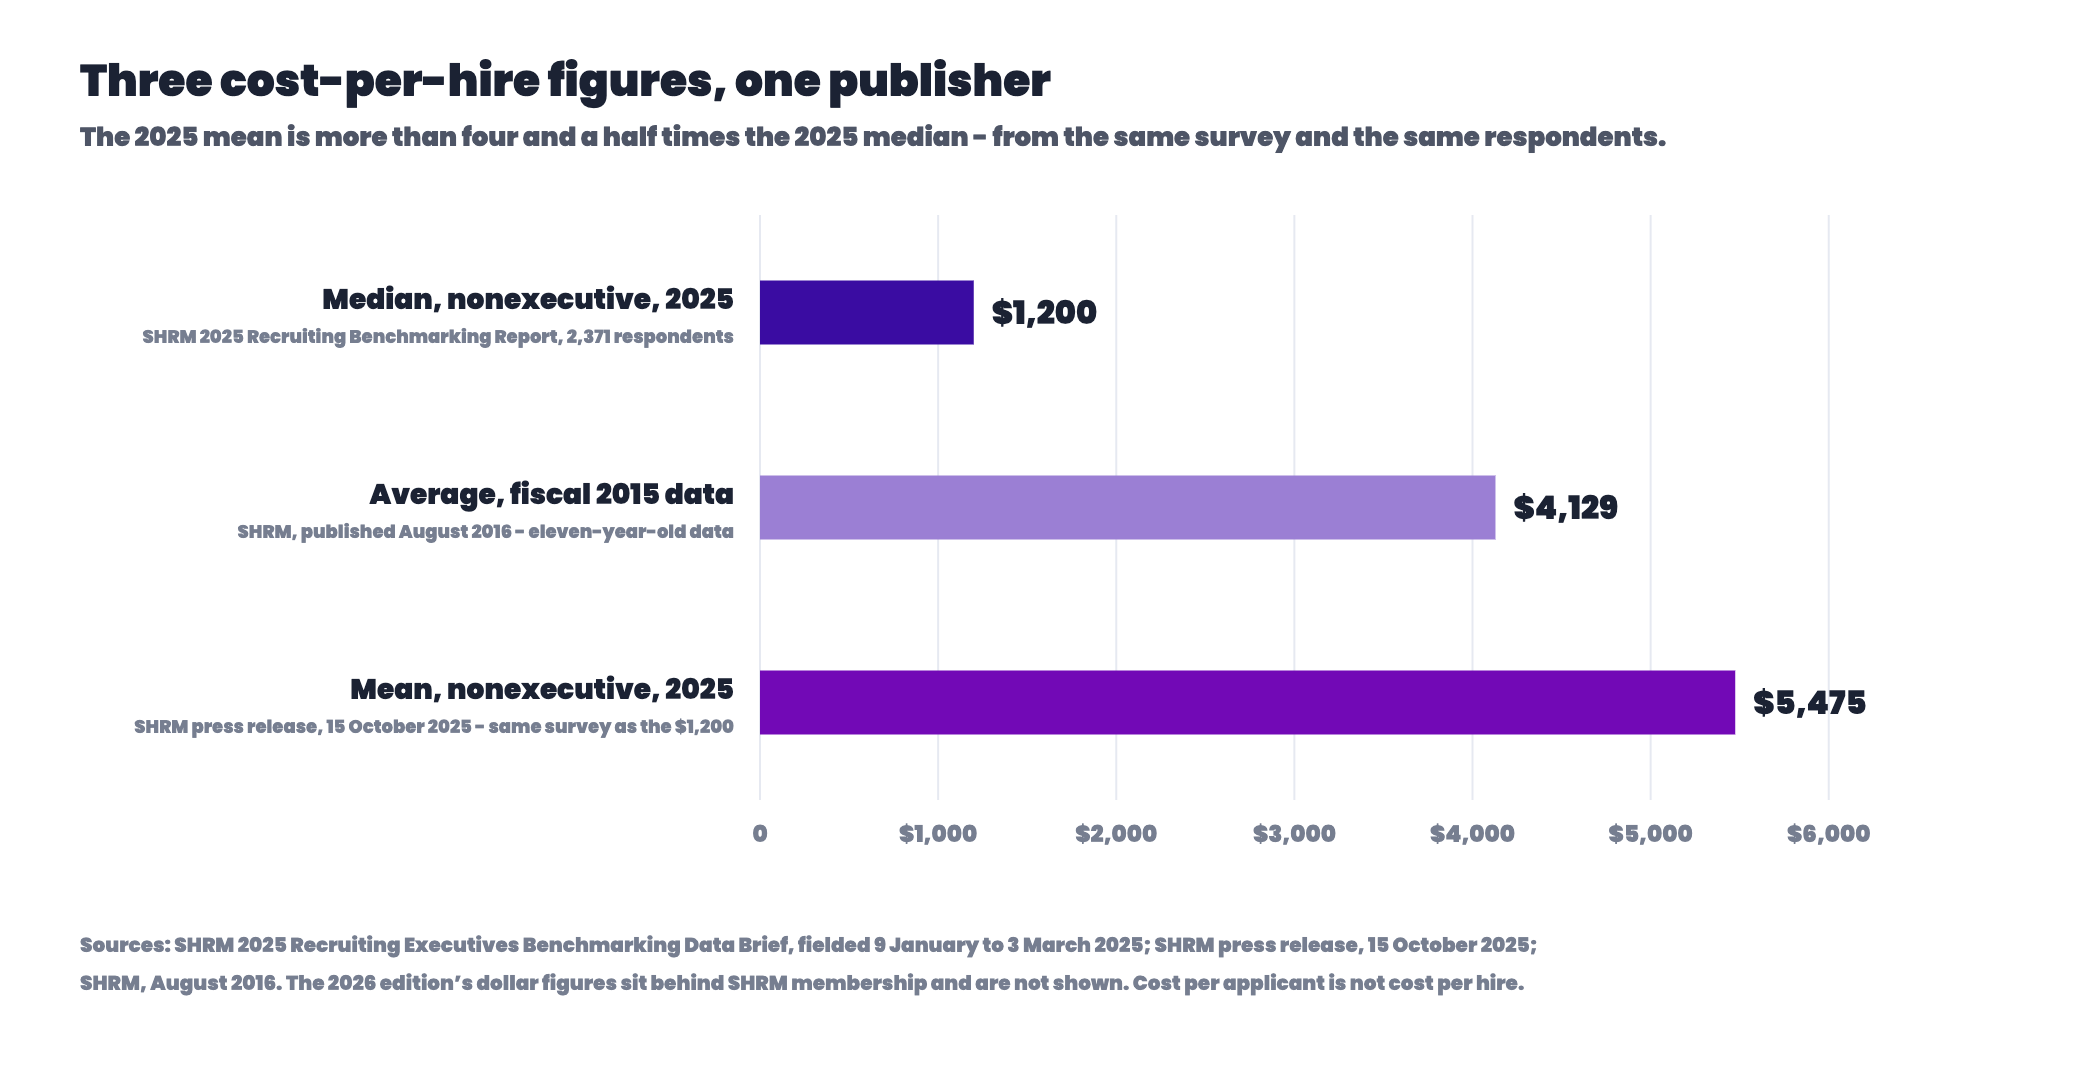
SHRM's 2025 survey ran from January to March 2025 across 2,371 member organizations. Its press release reports an average nonexecutive cost per hire of $5,475; its own report gives a median of $1,200. Both are correct. The mean is more than four and a half times the median, which tells you the distribution is violently skewed — a few expensive, complex hires drag the average far above what a typical hire costs.
| Figure | What it actually is | Source |
|---|---|---|
| $1,200 | Median, nonexecutive, 2025 — a typical hire | SHRM 2025 Recruiting Benchmarking Report (2,371 respondents) |
| $4,129 | Average, fiscal 2015 data, published 2016 — still quoted as current | SHRM, August 2016 |
| $5,475 | Mean, nonexecutive, 2025 — the same survey as the $1,200 | SHRM press release, October 15, 2025 |
| $35,879 | Mean, executive, 2025 — about six and a half times nonexecutive | SHRM press release, October 15, 2025 |
Source: SHRM 2025 Recruiting Executives Benchmarking Data Brief, fielded January 9 to March 3, 2025, and its press release of October 15, 2025. The 2026 edition's dollar figures sit behind SHRM membership, so none are quoted here. If a page quotes a single "SHRM average cost per hire" without saying whether it is a mean or a median, it has skipped the most important word in the sentence. The published figures, including the by-industry table and the mean-and-median pair, are collected with their sources on average cost per hire by industry.
One hire, three definitions
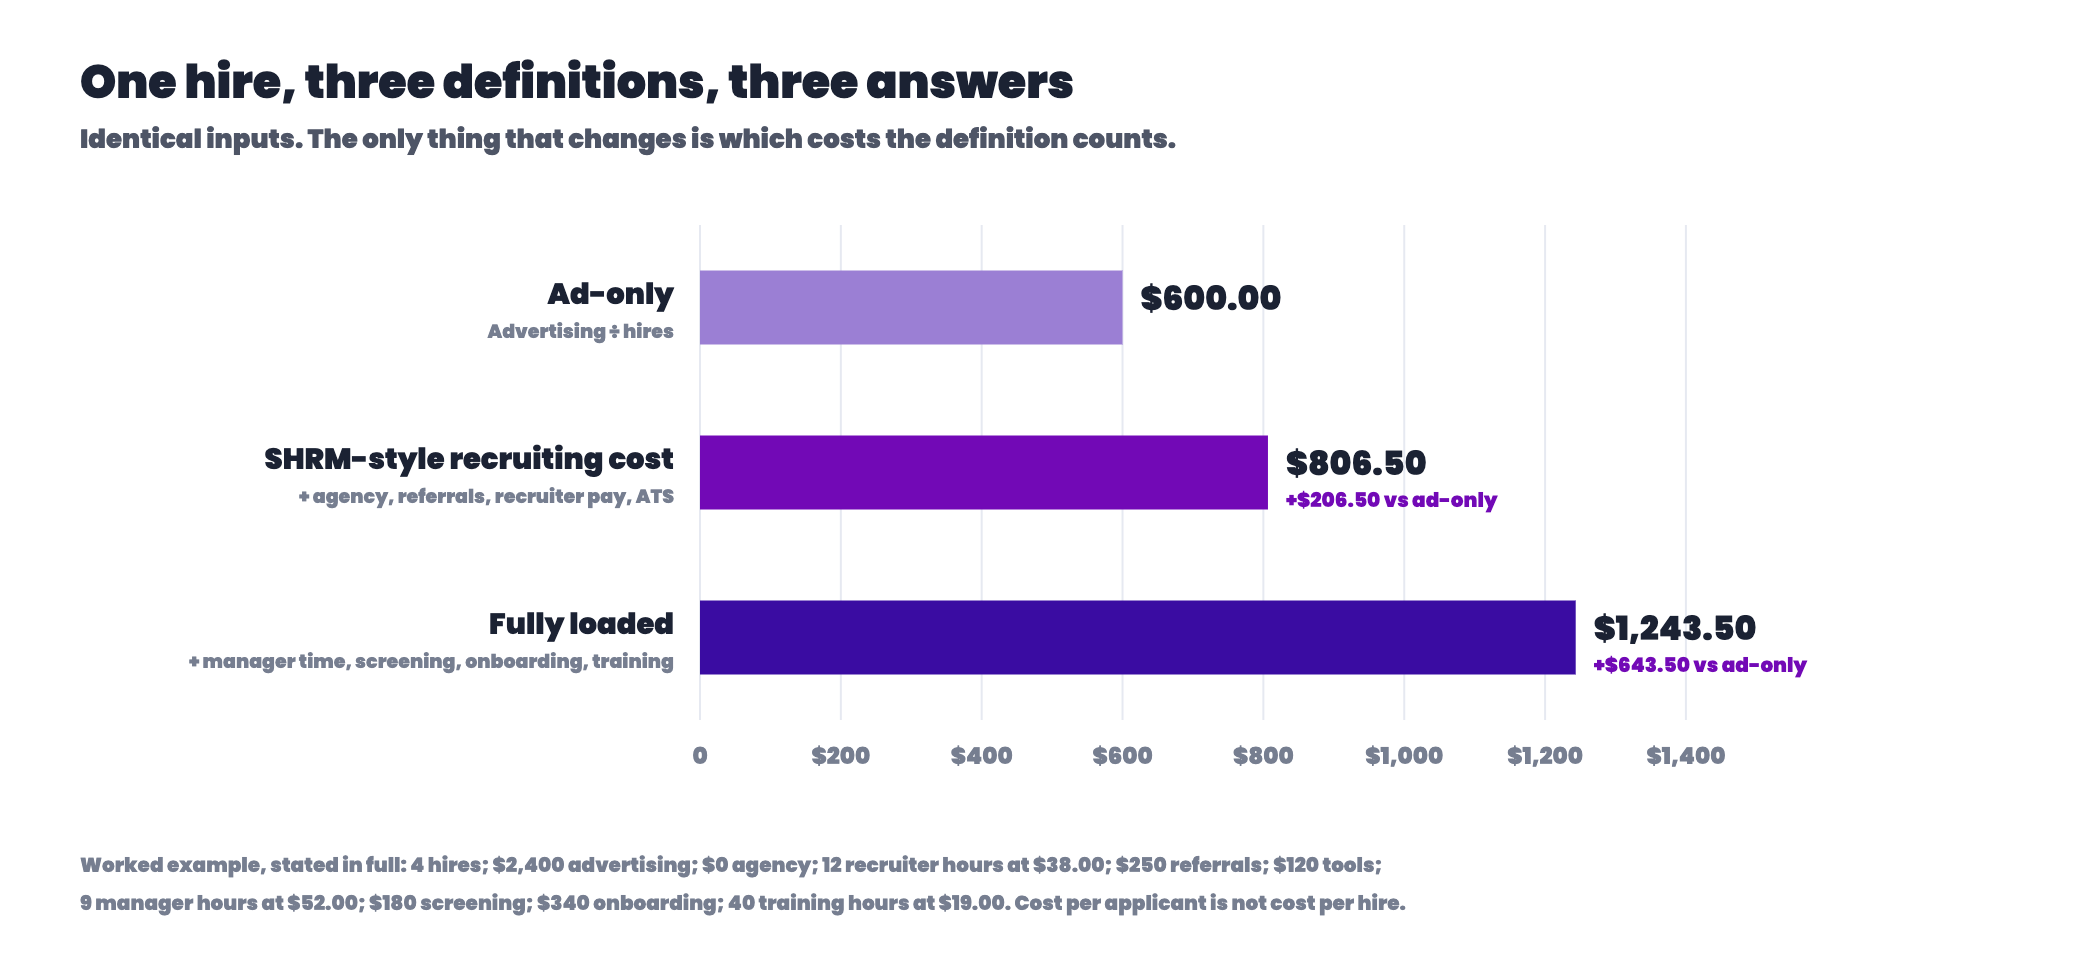
Enter one set of numbers. The calculator applies three definitions to them and returns three cost-per-hire figures at once. Mark the one your organization actually uses — then notice how far the other two sit from it.
Advertising divided by hires. What a media invoice can see, nothing more.
Agency and job-board fees, referral costs, recruiter pay and talent-acquisition system costs. Excludes manager time, screening, onboarding and training.
Everything above plus manager and interviewer time, screening, onboarding and training at reduced speed.
Cost per applicant is not cost per hire. Every figure here comes from the numbers you entered, not from Boostpoint campaign data — ad data cannot see a hire.
The middle definition follows the component list SHRM publishes with its survey: third-party and advertising agency fees, job fair costs, online job board fees, employee referral costs, applicant and staff travel, relocation, recruiter pay and benefits, and talent acquisition system costs, divided by hires. Travel and relocation sit at zero in the defaults because they rarely apply to hourly roles; fold them into agency fees if they apply to you.
What each definition leaves out
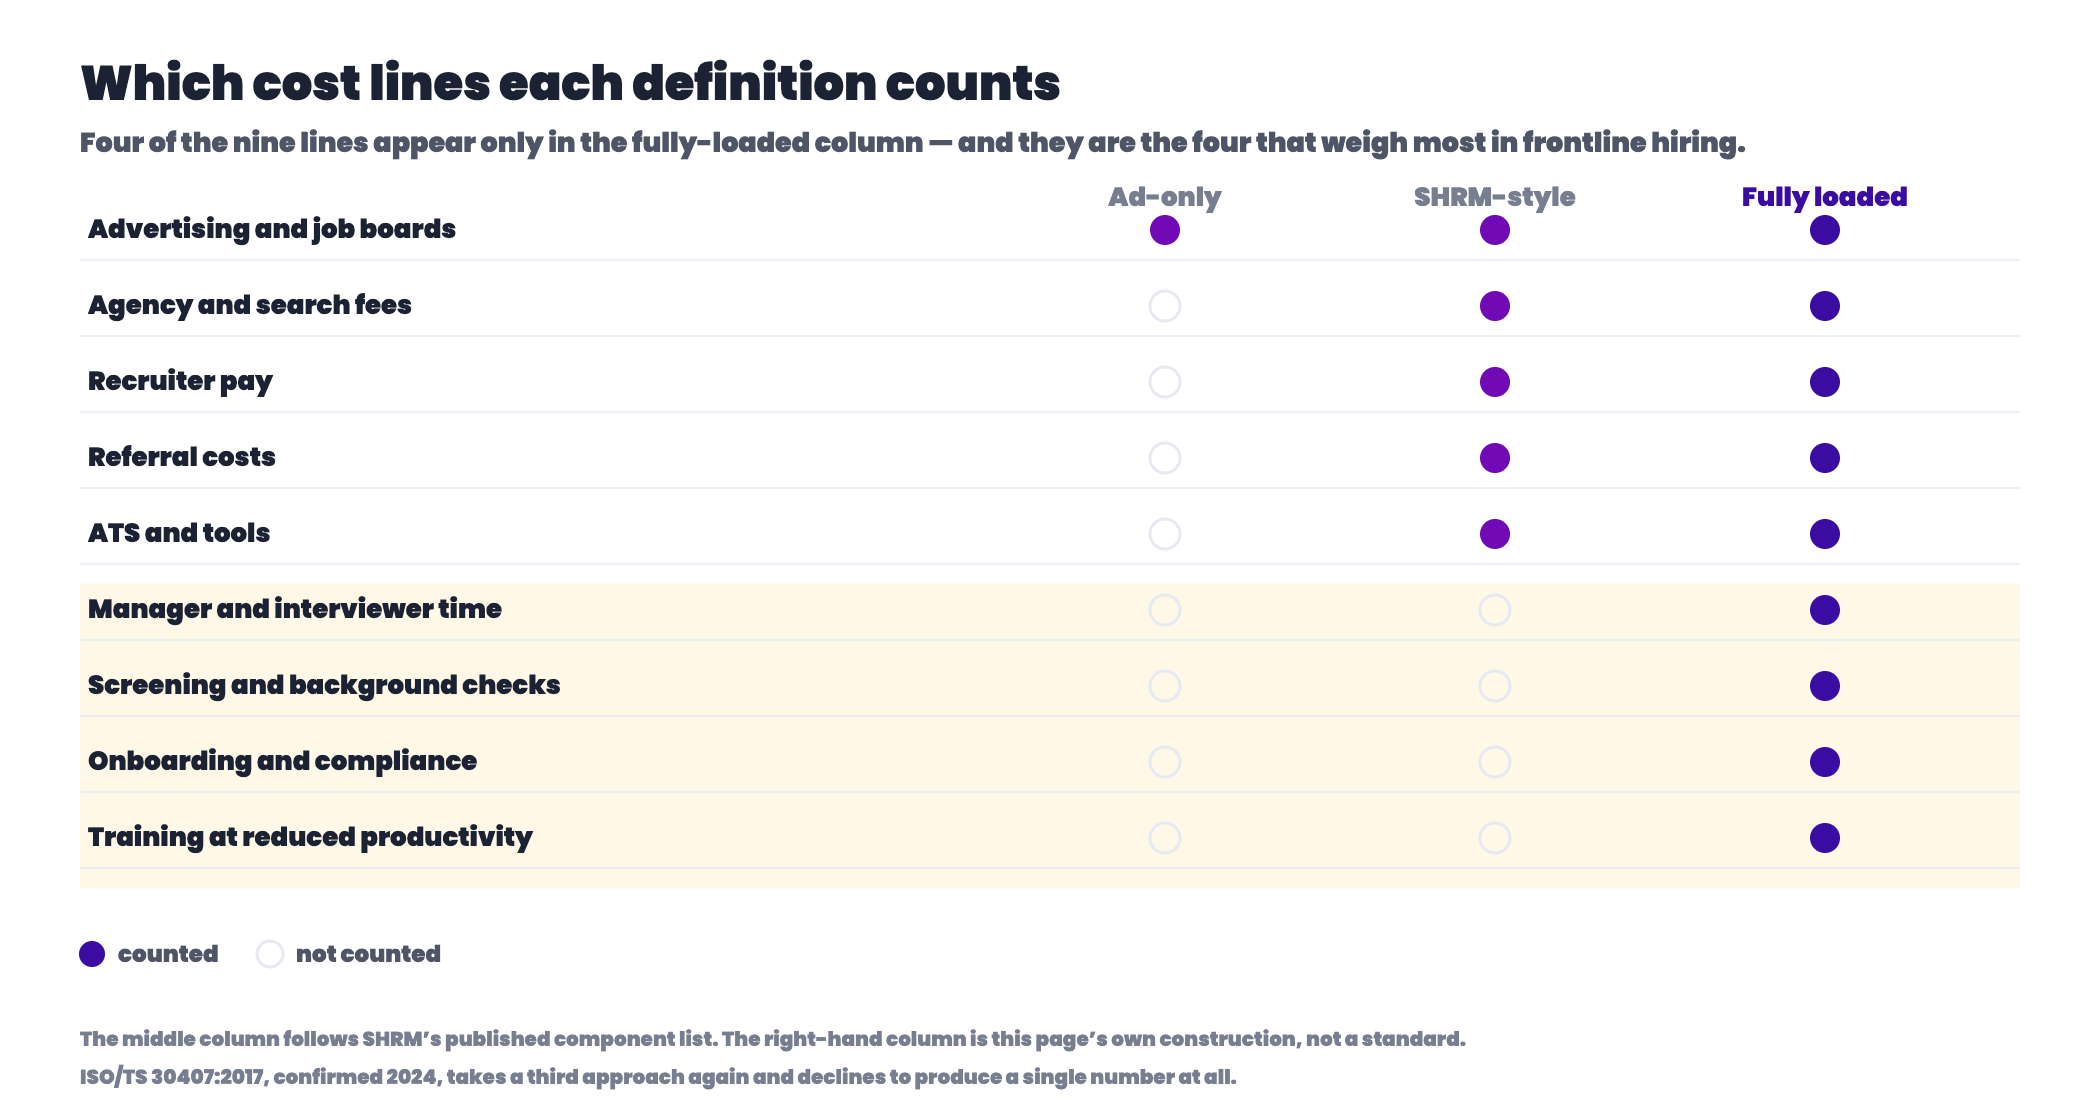
The gaps are not arbitrary. SHRM's enumeration is a recruiting-cost list: it counts recruiter pay but not the hiring manager's hours, and stops at the offer. That is a defensible line. It is also the line that makes frontline hiring look cheapest, because that is where screening, compliance and ramp are heaviest — a CDL hire's DOT physical, a caregiver's credentialing, a warehouse hire's first two weeks at reduced speed.
| Cost line | Ad-only | SHRM-style | Fully loaded |
|---|---|---|---|
| Advertising and job boards | Yes | Yes | Yes |
| Agency and search fees | No | Yes | Yes |
| Recruiter pay | No | Yes | Yes |
| Referral costs | No | Yes | Yes |
| ATS and tools | No | Yes | Yes |
| Manager and interviewer time | No | No | Yes |
| Screening and background checks | No | No | Yes |
| Onboarding and compliance | No | No | Yes |
| Training at reduced productivity | No | No | Yes |
The middle column follows SHRM's published component list. The right-hand column is this page's own construction, not a standard — the SHRM list plus the four things frontline employers most often tell us they pay for and cannot see. ISO/TS 30407, published March 2017 and confirmed in 2024, takes a third approach: rather than one number it defines internal recruitment costs, comparable recruitment costs and a hiring-to-cost ratio separately, and requires periodic audits of the input data.
Why we won't compute one from advertising data
This is the binding rule on everything Boostpoint publishes: cost per applicant is not cost per hire. An ad platform records a click and, if the form sits inside it, an application. It cannot record an interview, an offer, a start date or a first shift. Any cost per hire from ad data is a cost per applicant multiplied by an assumed ratio, and the assumption does the work.
What we do publish is the applicant side, across 891 campaigns and 1,334 campaign-months: a median of $13.88 per applicant, with the middle half of campaigns between $6.48 and $29.74. The spread is instructive — role and market move the figure several-fold, so use the role row closest to yours in the tool below. Multiply it by your own ATS's applicants-per-hire ratio and you have the advertising line of your cost per hire. Not the whole thing. The line.
That arithmetic is already done inside two verticals: cost per hire in logistics and warehousing and cost per hire in restaurants and food service. If the real question is what churn costs you, that is the turnover cost calculator. The dataset behind the applicant figures is at benchmarks.
One cost that does vary by state is compliance. Nine states require private employers to run E-Verify on new hires, at thresholds counted five different ways; our page on E-Verify requirements by state sets out which ones and how they count.
What we won't tell you
- What the ANSI/SHRM standard actually says. ANSI/SHRM 06001.2012 defines cost per hire as external plus internal costs divided by total hires. We could not read the standard's own text on any accessible page, so we do not reproduce the component lists that circulate as if quoted from it. Every version we found was a paraphrase by a party that had not read it either.
- A 2026 SHRM dollar figure. The 2026 edition reports a nonexecutive median time to fill of 39 days, but its cost figures sit behind membership. The most recent public ones are the 2025 figures above.
- A cost per hire for your industry. SHRM's finest public cut is "nonexecutive". There is no published hourly-versus-salaried split, and we are not going to invent one.
- An independent applicants-per-hire benchmark. There isn't one. The only hourly figures we could verify come from an ATS vendor's own platform data, and its published funnel percentages do not reconcile with its applicants-per-hire figure. Use your own ratio.
Before you compare your cost per hire to anyone else's, make them tell you what they counted. If they cannot, you are comparing two different metrics that share a name.
One offset that used to belong in this arithmetic is currently absent: the Work Opportunity Tax Credit lapsed on December 31, 2025. Our page on the WOTC tax credit explains what that means for a 2026 hire and what still needs doing at onboarding.
How to make the number useful anyway
Three rules make it worth tracking. Write the definition down, listing what is inside and what is not — the calculator will tell you which of the three you just described. Compare it only to your own history, not to a published average dragged upward by executive hires. And check the denominator against your ATS quarterly: a cost per hire computed on offers rather than starts is a different, flattering metric.
One more, particular to frontline hiring: a hire who leaves in week three still counted as a hire. If your cost per hire is falling while your turnover cost rises, the metric is improving because you are filling the same seat repeatedly — the opposite of what it is supposed to prove.
Frequently asked questions
How do you calculate cost per hire?
Add up the recruiting costs for a period and divide by the hires made in it. The arithmetic is trivial; the decision is which costs go in the numerator. The calculator above applies three definitions to one set of inputs and returns all three, because that decision moves the answer more than anything else.
What is the average cost per hire?
SHRM's 2025 survey of 2,371 organizations reports a mean of $5,475 and a median of $1,200 for nonexecutive roles. Use the median if you want what a typical hire costs; the mean is dragged upward by specialist and executive hiring. The much-quoted $4,129 is fiscal 2015 data published in 2016.
What is included in cost per hire?
It depends whose definition you use. SHRM's published list covers agency and job board fees, job fair costs, referral costs, applicant and staff travel, relocation, recruiter pay and talent acquisition system costs. It excludes hiring manager time, screening, onboarding, and training at reduced productivity — the four lines that weigh heaviest in frontline hiring.
Is there an official cost per hire standard?
There are two, and they disagree. ANSI/SHRM 06001.2012 defines it as external plus internal costs divided by total hires. ISO/TS 30407, published March 2017 and confirmed in 2024, declines to produce a single number at all, defining internal recruitment costs, comparable recruitment costs and a hiring-to-cost ratio separately.
Why do published cost-per-hire figures vary so much?
Because they answer different questions. The clearest evidence is inside one survey: SHRM's 2025 mean and median differ by $4,275 with the same respondents and the same year. Add a consultant quoted by SHRM in 2022 estimating the total cost of a hire at three to four times salary, and the published figures run from about a thousand dollars to several times a year's pay.
Can you get a cost per hire from Facebook or Instagram ad data?
No, and be wary of any vendor who offers one. Ad platforms record clicks and, at best, applications. They cannot see interviews, offers, start dates or first shifts, which all happen in your ATS. Cost per applicant is not cost per hire; a cost per hire from ad data is a cost per applicant multiplied by an assumption.
What does an applicant cost, if not a hire?
Across 891 Boostpoint-managed campaigns and 1,334 campaign-months, the median is $13.88 per applicant, and the middle half of campaigns paid $6.48 to $29.74. Multiply the figure for your role by your applicants-per-hire ratio for the advertising line of your cost per hire — one line, not the whole figure.
How long should a frontline hire take to fill?
SHRM's 2026 benchmarking reports a nonexecutive median time to fill of 39 days, down from 44 in 2025. Sector figures run wider: NSI Nursing Solutions puts the average time to recruit a bedside RN at 78 days across 527 hospitals. Treat any published figure as describing a different population from yours until you check the sample.
Get the applicant number right, and compute the hire yourself
We will show what applicants cost in your roles and markets and hand the ratio back to you to finish the arithmetic in your own ATS — including the cases where the honest answer is that advertising is not your constraint.
Book a demoMethodology. Third-party figures are named in-table. Sources: SHRM 2025 Recruiting Executives Benchmarking Data Brief, fielded January 9 to March 3, 2025 across 2,371 respondents, for the $1,200 median, and its press release of October 15, 2025 for the $5,475 nonexecutive and $35,879 executive means; SHRM, August 2016, for the $4,129 fiscal-2015 average; SHRM's 2026 brief, June 24, 2026, for the 39-day median time to fill, whose dollar figures are behind membership and are not quoted; SHRM, April 2022, for a consultant's three-to-four-times-salary estimate, which is expert opinion, not measured data; ANSI/SHRM 06001.2012 for the external-plus-internal formula, whose component lists we could not read and do not reproduce; ISO/TS 30407:2017, confirmed 2024; NSI Nursing Solutions 2026 National Health Care Retention Report, 527 hospitals, for the 78-day RN figure. Boostpoint figures come from a benchmark of 891 campaigns and 1,334 campaign-months and are what advertisers paid. Cost per applicant is not cost per hire, and no cost per hire here is computed from Boostpoint data. This is a sample of Boostpoint campaigns, not an industry-wide study. Worked example in full: 4 hires; $2,400 advertising; $0 agency; 12 recruiter hours at $38.00; $250 referrals; $120 tools; 9 manager hours at $52.00; $180 screening; $340 onboarding; 40 training hours at $19.00. Ad-only $2,400 ÷ 4 = $600.00. SHRM-style $2,400 + $0 + $456.00 + $250 + $120 = $3,226.00 ÷ 4 = $806.50. Fully loaded adds $468.00 manager time, $180 screening, $340 onboarding and $760.00 training for $4,974.00 ÷ 4 = $1,243.50, which is $643.50 above ad-only. Re-verify SHRM and standards figures quarterly. Dataset at benchmarks.