
Cost Per Hire in Logistics and Warehousing: What the Third-Party Benchmarks Say, Why Ad Data Can't Produce One, and What a Warehouse Applicant Costs Instead
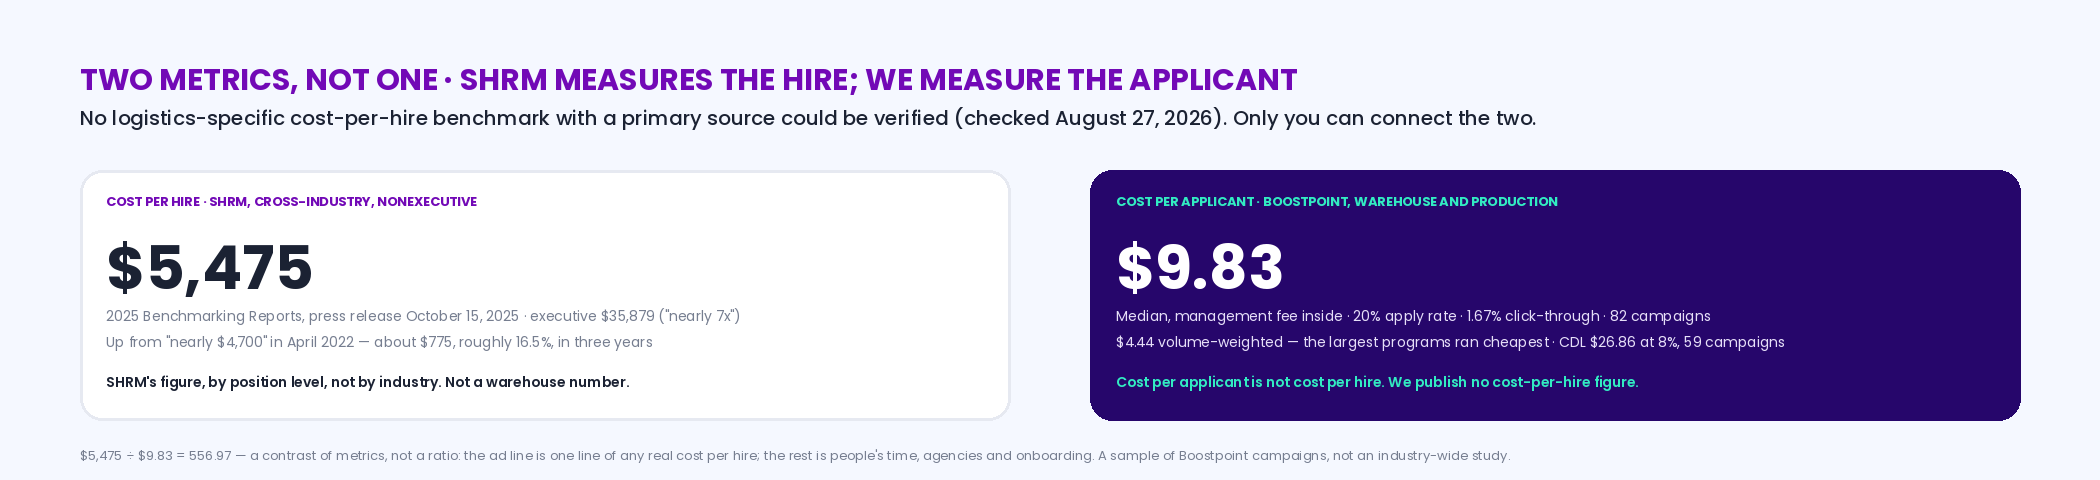
There is no published cost-per-hire benchmark specific to logistics and warehousing that we could verify from a primary source. The nearest figure is SHRM's cross-industry average for nonexecutive hires, $5,475, from its 2025 Benchmarking Reports (October 15, 2025), up from the "nearly $4,700" it reported in April 2022. What makes a warehouse seat expensive to fill isn't the ad — it's the churn: the BLS quits rate for transportation, warehousing and utilities was 2.4% a month in June 2026 against 2.0% for all employment, so the same seats are refilled all year. Our own number is a different metric: a warehouse applicant cost a median $9.83 in Boostpoint's 2026 Social Job Advertising Benchmark, and that is cost per applicant, not cost per hire — a cost per hire can only be computed by you, from your hires.
Source: Boostpoint 2026 Social Job Advertising Benchmark — 891 Boostpoint-managed campaigns on Meta (1,334 campaign-months), 2026; costs are what advertisers paid for advertising only.
A note on who's writing this
Boostpoint runs recruitment ads for warehouses, distribution centers and carriers, so we have a number for what a warehouse applicant costs and no number for what a warehouse hire costs, because we don't see the hire; it happens in your ATS and your payroll, weeks after our part is done. We hold a hard rule about that: we never publish a cost per hire computed from our ad data — not as a figure, not as a range, not as spend divided by an assumed ratio — because every version of that arithmetic is an assumption presented as a measurement. So this page does three things and labels each. It reports the cost-per-hire benchmarks that exist, from the parties who measured them. It reports the BLS figures that explain why the logistics number would be high. And it reports our cost per applicant, saying every time that it's a different metric. The two calculators compute on your figures — your hires, your spend, your hours — and produce a number that is yours.
The case for a cost-per-hire number, made first
Finance is right to want it. A warehouse that turns over a third of its floor a year is spending real money on replacement — recruiter and supervisor hours, drug screens and background checks, PPE and safety training, the weeks a new picker runs below rate, the agency markup on every temp hour — and none of that appears on the advertising line. A cost per hire that adds those up and divides by hires is the only figure that lets an operations director compare an owned pipeline against a staffing agency, or a referral bonus against a job board, on the same basis. The standard definition is plain: all internal and external recruiting costs in a period, divided by the hires made in it, and our glossary entry has the formula. The case is right. What it needs is the data the ad account doesn't have, which is why the honest version of this page is a benchmark table, a churn table, and a calculator you fill in — not a number we made up.
What the third-party benchmarks say
Two figures from the same source, three years apart, and neither is logistics-specific. SHRM's 2025 Benchmarking Reports, announced October 15, 2025, put the average cost per hire for nonexecutive positions at $5,475 and for executive positions at $35,879 — "nearly 7x," in SHRM's words — with screening and interviewing averaging eight to nine days each. In April 2022 SHRM had put the average at "nearly $4,700." Taken together they say the cross-industry number rose about $775, roughly 16.5%, in three years, on SHRM's respondents; they don't say what a forklift operator or a picker costs to hire, because SHRM's cut is by position level, not by industry. We looked for a logistics-specific benchmark with a primary source and didn't find one we could stand behind; the figures that circulate for "warehouse cost per hire" trace back to vendor surveys or to each other, and we'd rather print the gap than fill it.
| Figure | Scope | Source | Date |
|---|---|---|---|
| $5,475 average cost per hire | Nonexecutive positions, cross-industry, SHRM respondents | SHRM, "SHRM Releases 2025 Benchmarking Reports" (press release) | October 15, 2025 |
| $35,879 average cost per hire | Executive positions, same report — "nearly 7x" nonexecutive | SHRM, same release | October 15, 2025 |
| "Nearly $4,700" average cost per hire | Cross-industry, SHRM respondents | SHRM | April 11, 2022 |
| No verified figure | Logistics, warehousing or distribution specifically | None with a primary source we could confirm | Checked August 27, 2026 |
Why the logistics number would run high: what the BLS measures
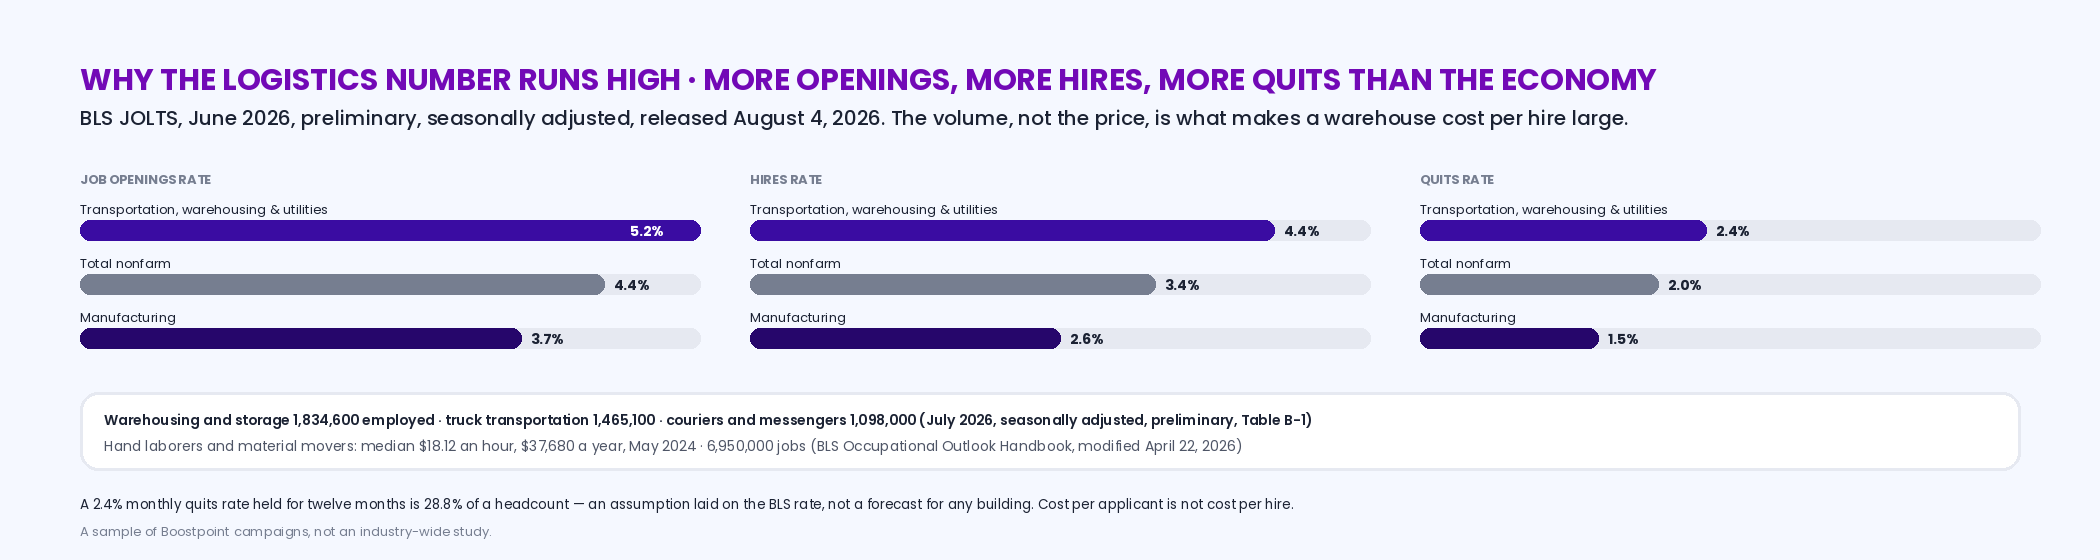
The reason a warehouse cost per hire is worth watching isn't that any one hire is expensive; it's that there are so many of them. The BLS's Job Openings and Labor Turnover Survey for June 2026, released August 4, 2026, puts transportation, warehousing and utilities ahead of the whole economy on every rate that drives hiring volume: a job openings rate of 5.2% (392,000 openings) against 4.4% for all nonfarm employment, a hires rate of 4.4% against 3.4%, and a quits rate of 2.4% against 2.0%. Manufacturing, the sector this page sits beside, ran the other way — openings 3.7%, hires 2.6%, quits 1.5% — which is why a plant and a distribution center on the same road have different hiring problems. Held for twelve months, a 2.4% monthly quits rate is 28.8% of a headcount walking out in a year, before layoffs, discharges and retirements; on a 120-person floor that is 34.56 replacement hires from quits alone, an assumption laid on the BLS rate rather than a forecast for any building. The sector is large enough that the arithmetic matters: warehousing and storage employed 1,834,600 people in July 2026 (seasonally adjusted, preliminary), truck transportation 1,465,100, couriers and messengers 1,098,000, and the transportation and warehousing sector as a whole 6,596,100. The pool those seats draw from is paid modestly — the BLS Occupational Outlook Handbook puts the median wage for hand laborers and material movers at $18.12 an hour ($37,680 a year) in May 2024, across 6,950,000 jobs — which is the other half of the churn: at that wage a competitor's extra dollar an hour moves people, and the seat refills.
| Sector | Job openings | Openings rate | Hires | Hires rate | Quits | Quits rate |
|---|---|---|---|---|---|---|
| Transportation, warehousing and utilities | 392 | 5.2% | 316 | 4.4% | 171 | 2.4% |
| Manufacturing | 481 | 3.7% | 329 | 2.6% | 192 | 1.5% |
| Total nonfarm | 7,359 | 4.4% | 5,348 | 3.4% | 3,232 | 2.0% |
Where a warehouse cost per hire actually goes
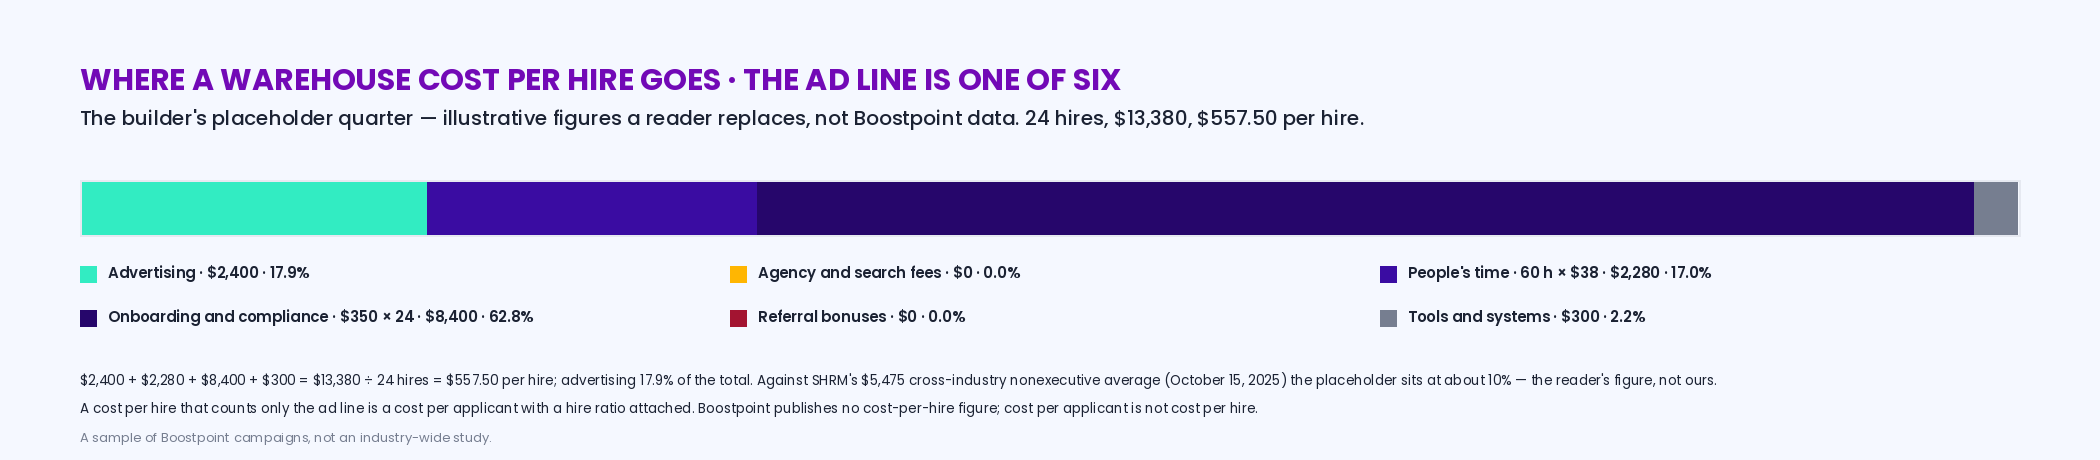
Add up what refilling a picker's seat costs and the advertising is one line among six. The recruiter's or supervisor's hours: the screening call, the interview, the reference, the offer, and the no-shows that eat half of them. The agency: for any seat filled through a staffing firm, a markup on every hour — the agency cost page has the published ranges and the math — which is why a cost per hire that leaves out agency spend is a cost per hire for the seats you filled yourself. Compliance and gear: the drug screen, the background check, the steel toes and the vest. Training: the safety course, the powered-equipment certification for a forklift seat, the weeks a new hire runs below rate while someone else covers. The referral bonus, when you pay one. And the advertising. A cost per hire that only counts the last line is a cost per applicant with a hire ratio attached, and that's the number to distrust; the builder below asks for all six, on your figures, and shows what share the ad line is.
Interactive
Cost-per-hire builder — your hires and your six cost lines for a quarter; get your cost per hire, the share the advertising line is, and how it reads against SHRM's cross-industry average
Nothing is stored or sent — this runs in your browser. Every input is yours; the defaults are illustrative placeholders, not Boostpoint data, and the result is your cost per hire, not ours. We supply no hire ratio.
—
six lines, the quarter
—
total ÷ hires
—
of the total
—
nonexecutive average, Oct 2025
Why ad data can't produce a cost per hire, and what it produces instead
An ad platform sees the impression, the click and — if the form lives inside the platform — the application. It never sees the start date. To turn ad spend into a cost per hire, someone has to divide by a hire ratio, and the ratio is either measured in your ATS, in which case you already have the real number and don't need the estimate, or it's assumed, in which case the figure is an assumption wearing a dollar sign. We've watched the second kind get presented to finance as a measurement and we won't do it; the attribution page walks through the three layers and the two gaps, and the measurement page has the system that connects them. What ad data does produce, honestly, is the cost of the applicant, and for warehouses that number is well measured. In our 2026 benchmark the warehouse and production family — 82 campaigns — ran a median $9.83 per applicant with a 20% apply rate and a 1.67% click-through rate; the volume-weighted figure across the family was $4.44, because the largest programs ran cheapest. An earlier campaign-level analysis of manufacturing employers — 264 campaigns across 14 clients — ran a $5.56 blended cost per applicant, and one multi-market client's 110 campaigns ran around $4.11; the warehouse playbook explains the gap between $9.83 and $4.44 and how a program gets to the cheap side of it. For the driving seats, CDL campaigns ran $26.86 at an 8% apply rate across 59 campaigns, and the transportation sector as a whole $13.34 at 13% with a $14.82 CPM. Those are applicant figures. Put beside SHRM's $5,475, the contrast is a contrast of metrics: $5,475 would buy 556.97 applicants at $9.83, which tells you only that the ad line is a small fraction of any real cost per hire and that the rest of it lives in people's time, agencies and onboarding — which is the point of the builder.
| Family or sector | Median cost per applicant | Apply rate | Click-through | Campaigns |
|---|---|---|---|---|
| Warehouse and production | $9.83 ($4.44 volume-weighted) | 20% | 1.67% | 82 |
| CDL drivers | $26.86 | 8% | 0.88% | 59 |
| Transportation sector | $13.34 | 13% | CPM $14.82 | 184 |
| All campaigns | $13.88 ($8.02 volume-weighted) | — | — | 891 |
Source: Boostpoint 2026 Social Job Advertising Benchmark — 891 Boostpoint-managed campaigns on Meta (1,334 campaign-months), 2026; costs are what advertisers paid for advertising only.
The churn is the cost: seats, replacements and the ad line
Because the volume is the problem, the useful planning number for a warehouse isn't one cost per hire; it's the number of seats you'll refill in a year times what each refill costs you, with the ad line shown as its honest share. The calculator takes your headcount, a monthly quits rate (the BLS sector figure is the default and yours from payroll is better), your applicants-per-hire ratio from your own ATS, and the cost per hire you built above, and lays out the year. It will also show you why the cheapest lever is rarely the ad: cutting a quarter of the quits — the first 90 days is where most of them happen — removes more cost than halving the advertising ever could, on any set of numbers you're likely to enter.
Interactive
Churn and seat calculator — headcount, a monthly quits rate, your applicants per hire and your cost per hire; get the replacements a year, the applicants to find, the ad line at the benchmark median, and the whole-year cost with the ad line's share
Nothing is stored or sent — this runs in your browser. The quits rate defaults to the BLS figure for transportation, warehousing and utilities; your own from payroll is better. The applicants-per-hire ratio is yours — we don't supply one.
—
headcount × rate × 12
—
replacements × your ratio
—
applicants × benchmark median, illustrative
—
replacements × your cost per hire
There is a prior problem worth naming: the same hire is reported at three different costs depending on whether you mean the ad spend, the SHRM definition or the fully loaded one. The cost per hire calculator computes all three side by side from one set of inputs, so you can see what the other two would have reported.
When the cost per hire is the wrong question
Three cases. A seasonal surge — the ten weeks before the holidays, the harvest run at a co-op's warehouse — where the seats are temporary by design and the honest comparison is agency markup against the cost of hiring and laying off, not a cost per hire at all. A single hard seat, a maintenance tech or a night-shift lead, where one hire a year makes any per-hire average meaningless and the question is time-to-fill and who covers meanwhile. And a floor where the quits rate is double the sector's: there the cost per hire is a symptom, and the number worth computing is what a quarter fewer quits would be worth, which the churn calculator answers in one line. The cost per hire is the right question for a floor that hires steadily and wants to know whether the pipeline it owns beats the one it rents; for that floor, build it from your six lines and revisit it quarterly.
Frequently asked questions
What is the average cost per hire in logistics and warehousing?
No logistics-specific benchmark with a primary source exists that we could verify. The nearest published figure is SHRM's cross-industry average for nonexecutive positions, $5,475, from its 2025 Benchmarking Reports (October 15, 2025), up from "nearly $4,700" in April 2022. A warehouse operation's own figure depends mostly on agency use, churn and what it counts, which is why the builder on this page asks for your six cost lines rather than supplying a number.
How do you calculate cost per hire for a warehouse?
Add every recruiting cost in a period — advertising, agency and search fees, recruiter and supervisor hours at a loaded rate, onboarding and compliance per hire (screens, checks, PPE, training, certification), referral bonuses, and tools — and divide by the hires that started in the period. Count starts, not offers, and include agency markup on temp hours or the figure only covers the seats you filled yourself.
Why is warehouse cost per hire high when warehouse applicants are cheap?
Because the cost is volume, not price. The BLS quits rate for transportation, warehousing and utilities was 2.4% a month in June 2026 against 2.0% for all employment, with a 4.4% hires rate against 3.4%; held for a year, 2.4% a month is 28.8% of a headcount. Each refill carries hours, screens, gear and training whether the applicant cost $9.83 or $98. The ad line is usually a small share of the total.
What does a warehouse applicant cost?
In our 2026 benchmark the warehouse and production family ran a median $9.83 per applicant with a 20% apply rate across 82 campaigns, and $4.44 volume-weighted because the largest programs ran cheapest; CDL campaigns ran $26.86 at 8% across 59. That is cost per applicant — a different metric from cost per hire, and one we don't convert, because the hire happens in your ATS.
Can you turn cost per applicant into cost per hire?
Only you can, by dividing your applicants by your hires in your ATS and multiplying. Any vendor who does it for you is assuming the ratio, and an assumed ratio wearing a dollar sign isn't a measurement. We publish no cost-per-hire figure from our data for exactly that reason; the calculators on this page use your ratio and your costs.
How much does logistics turnover cost?
Your headcount times the monthly quits rate times twelve gives the replacements a year — 120 people at the BLS sector rate of 2.4% is 34.56 refills from quits alone — and each refill costs whatever your cost per hire is. On the builder's placeholder figures ($557.50 a hire) that year is $19,267.20, with advertising about 17.6% of it; on your figures it's whatever your figures make it. The lever is the quits rate, and most quits happen in the first 90 days.
Is a staffing agency cheaper than a cost per hire?
For a surge, often; for a seat that exists all year, rarely, because the markup is paid on every hour indefinitely while a cost per hire is paid once per refill. The comparison only works if the agency markup is inside your cost-per-hire total for the seats it filled; the warehouse staffing agency cost page has the published markup ranges and the annual math.
Is cost per hire different for drivers than for warehouse workers?
The applicant side is: CDL campaigns ran a median $26.86 per applicant at an 8% apply rate in our benchmark against $9.83 at 20% for warehouse roles, because the license shrinks the pool. The hire side we don't measure. The BLS counts both inside transportation, warehousing and utilities, where the June 2026 openings rate was 5.2% and the quits rate 2.4%, so the churn arithmetic applies to both seats.
Know what the applicant costs; compute the hire yourself
Bring your floor headcount, last quarter's hires and your applicants-per-hire ratio. We'll show you what warehouse and driver applicants cost across 891 campaigns, build the campaign that gets you to the cheap side of $9.83 and $4.44, and leave the cost per hire where it belongs — in your numbers, computed by you.
Book a DemoBoostpoint figures come from the 2026 Social Job Advertising Benchmark — 891 campaigns and 1,334 campaign-months: warehouse and production median $9.83 per applicant, 20% apply rate, 1.67% click-through, 82 campaigns, $4.44 volume-weighted; CDL $26.86, 8%, 0.88%, 59; transportation sector $13.34, 13%, CPM $14.82, 184 campaigns; all campaigns $13.88 median, $8.02 volume-weighted. Earlier manufacturing analysis: 264 campaigns across 14 clients, $5.56 blended; one multi-market client's 110 campaigns at about $4.11. Third-party, verified August 27, 2026: SHRM, "SHRM Releases 2025 Benchmarking Reports," October 15, 2025 — nonexecutive average cost per hire $5,475, executive $35,879, "nearly 7x," screening and interviewing eight to nine days each; SHRM, April 11, 2022 — "nearly $4,700"; BLS JOLTS, June 2026, preliminary, seasonally adjusted, released August 4, 2026 — transportation, warehousing and utilities openings 392,000 (5.2%), hires 316,000 (4.4%), quits 171,000 (2.4%); manufacturing 481,000 (3.7%), 329,000 (2.6%), 192,000 (1.5%); total nonfarm 7,359,000 (4.4%), 5,348,000 (3.4%), 3,232,000 (2.0%); BLS Employment Situation, July 2026, Table B-1, seasonally adjusted, preliminary — warehousing and storage 1,834,600, truck transportation 1,465,100, couriers and messengers 1,098,000, transportation and warehousing 6,596,100; BLS Occupational Outlook Handbook, "Hand Laborers and Material Movers," modified April 22, 2026 — median $18.12 an hour, $37,680 a year, May 2024; 6,950,000 jobs, 2024. No logistics-specific cost-per-hire benchmark with a primary source could be verified. Arithmetic: 2.4% × 12 = 28.8%; 120 × 28.8% = 34.56; $5,475 ÷ $9.83 = 556.97; $5,475 − $4,700 = $775, 16.5% on an approximate base; builder placeholders $2,400 advertising + 60 × $38 + $350 × 24 + $300, no agency or referral spend, = $13,380 ÷ 24 = $557.50, advertising 17.9%. Boostpoint is priced as a product subscription plus ad spend: the subscription is priced on job volume and quoted on a call, ad spend is separate and recommended at a minimum of $750 a month per job category, there is one bill, through Boostpoint, and every cost-per-applicant figure we publish includes campaign management. Boostpoint publishes no cost-per-hire figure and no retention data; cost per applicant is not cost per hire, and no hire ratio is supplied or assumed on this page. A sample of Boostpoint campaigns, not an industry-wide study.