Employer benchmarkUpdated September 2026
Average Cost Per Hire by Industry (2026 Benchmarks)
SHRM's 2025 benchmarking put the mean cost per hire at $5,475 for nonexecutive roles and $35,879 for executives — but the median nonexecutive hire in the same survey cost $1,200. The frontline reality starts at the top of the funnel: in Boostpoint’s 2026 Social Job Advertising Benchmark, the median campaign cost $13.88 per applicant, which is not a cost per hire. Both SHRM numbers are correct, they come from the same 2,371 responses, and the gap between them is the single most important thing to understand before you compare your own figure to anything on this page. Industry averages sit between roughly $1,070 and $6,464 depending on the sector, and they are means, which means they carry the same skew.
Why published numbers run from about $1,200 to $5,475
The two figures are the median and the mean of the same distribution. The mean is more than four and a half times the median, which tells you the shape: most hires are cheap and a small number of hard, senior or heavily screened hires are very expensive, and they drag the average a long way from what a typical hire costs.
| Figure | What it is | Source |
|---|---|---|
| $1,200 | Median nonexecutive cost per hire, 2025 — a typical hire | SHRM 2025 Recruiting Benchmarking Report, 2,371 respondents |
| $5,475 | Mean nonexecutive cost per hire, 2025 — the average pulled up by outliers | SHRM press release, 15 October 2025 |
| $35,879 | Mean executive cost per hire, 2025 — nearly seven times the nonexecutive mean | SHRM press release, 15 October 2025 |
| $4,700 | Average cost per hire reported from SHRM benchmarking data in April 2022 | SHRM, 11 April 2022 |
| $4,129 | Average cost per hire, fiscal year 2015 | SHRM Human Capital Benchmarking Report |
Two practical consequences. First, if you are a frontline employer filling hourly roles in volume, the median is the number that describes you and the mean is the number that describes a mixed workforce including senior hires. Second, when a vendor or an article quotes "the average cost per hire" without saying whether it is a mean or a median, it is not a figure you can act on. The formula behind all of these is the same and it is set out on our cost per hire page.
The by-industry table
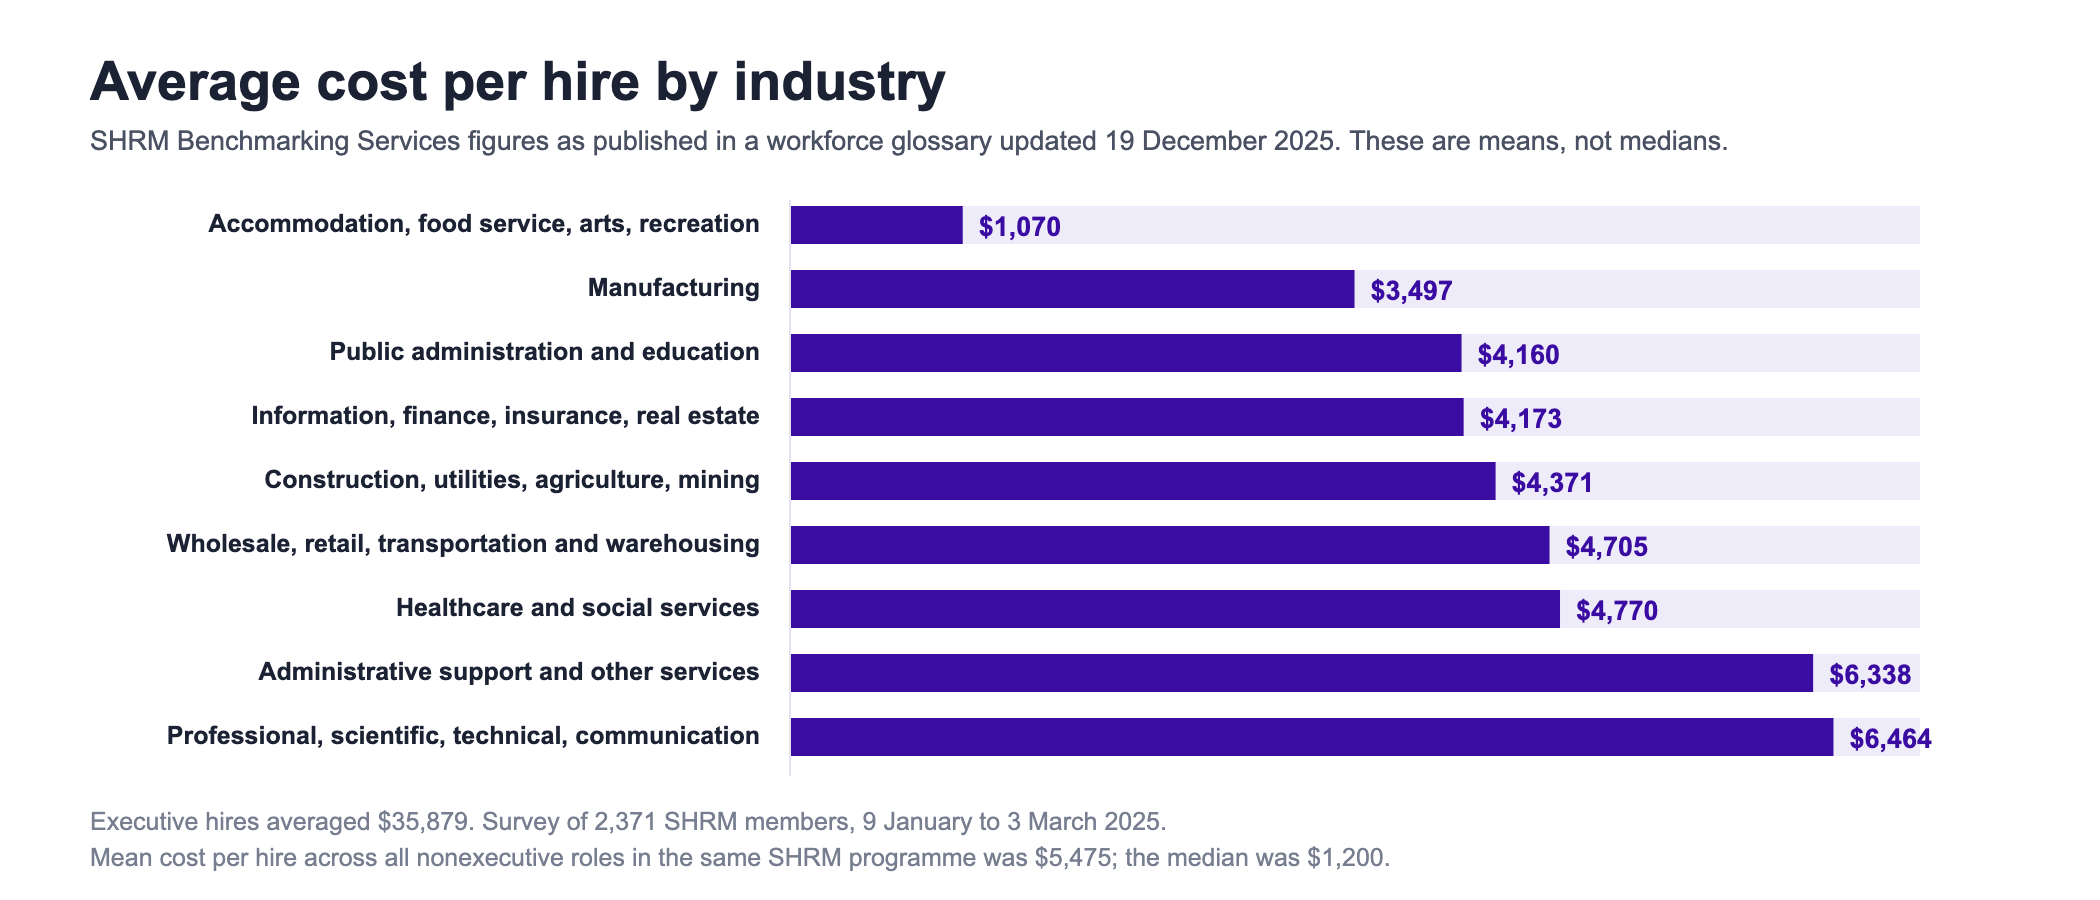
These are the industry figures that circulate most widely, drawn from SHRM Benchmarking Services and republished in a workforce glossary updated in December 2025. They are means, so the skew described above applies to every row.
| Industry | Average cost per hire | Source |
|---|---|---|
| Accommodation and food service, arts, entertainment, recreation | $1,070 | SHRM Benchmarking Services, republished December 2025 |
| Manufacturing | $3,497 | SHRM Benchmarking Services, republished December 2025 |
| Public administration and education | $4,160 | SHRM Benchmarking Services, republished December 2025 |
| Information, finance and insurance, real estate | $4,173 | SHRM Benchmarking Services, republished December 2025 |
| Construction, utilities, agriculture, mining | $4,371 | SHRM Benchmarking Services, republished December 2025 |
| Wholesale trade, retail trade, transportation and warehousing | $4,705 | SHRM Benchmarking Services, republished December 2025 |
| Healthcare and social services | $4,770 | SHRM Benchmarking Services, republished December 2025 |
| Administrative support and other services | $6,338 | SHRM Benchmarking Services, republished December 2025 |
| Professional, scientific and technical services, communication | $6,464 | SHRM Benchmarking Services, republished December 2025 |
| All nonexecutive roles (mean) | $5,475 | SHRM press release, 15 October 2025 |
| All nonexecutive roles (median) | $1,200 | SHRM 2025 Recruiting Benchmarking Report |
| Executive roles (mean) | $35,879 | SHRM press release, 15 October 2025 |
What a good cost per hire is
There is no threshold that makes a cost per hire good, and any article that gives you one is guessing. What there is instead are three tests, all of which you can run against your own number.
- Is it stable? A figure that moves 40% between quarters is usually measuring a changing boundary rather than a changing process. Fix the boundary first.
- Is it cheaper than the alternative? The only comparison that pays is against what you would otherwise do: an agency placement fee at 15–30% of first-year salary, or the cost of the seat staying open. Everything else is trivia.
- Does it hold when you look at retention? Cost per hire falls when screening stops. If it drops while ninety-day turnover rises, you did not save anything.
If you want a single orienting number rather than three tests: for frontline hourly hiring, a cost per hire in the low four figures is ordinary, and the $1,200 median is a better anchor than the $5,475 mean. Above about $5,000 for an hourly role, something specific is happening — agency use, a thin market, or an internal cost you have started counting that you did not count before.
The industries frontline employers ask about
Cost per hire in healthcare and for nurses
Healthcare and social services averages $4,770 in the SHRM industry figures, near the middle of the table — which understates the problem, because the average blends administrative roles with licensed clinical ones. What we can measure directly is the front of the funnel, and there the spread inside healthcare is enormous: a caregiver or home care applicant costs a $3.76 median in our 2026 data, a CNA $7.72, an LPN $12.77, a registered nurse $19.08, and a physical, occupational or speech therapist $74.62. The scarcity is real and it shows up in the advertising line long before it shows up in a cost per hire.
Cost per hire in manufacturing
Manufacturing averages $3,497, the second lowest industry in the table. That is consistent with what we see at the front of the funnel: warehouse and production applicants run a $9.83 median with a 20% apply rate, one of the healthier conversion rates in our data. Manufacturing hiring is usually a volume problem rather than a scarcity problem, which is why it responds well to advertising and badly to agency fees.
Cost per hire for truck drivers
Trucking sits inside "wholesale trade, retail trade, transportation and warehousing" at $4,705 in the industry table, which is not a useful figure for a carrier because the category is mostly not drivers. The measurable part is stark: a CDL truck driver applicant costs a $26.86 median in our 2026 data, against an 8% apply rate and a 0.88% click-through rate — roughly double the cost of a warehouse applicant and among the hardest audiences we advertise to. A driver cost per hire built on that front end will sit well above the category average.
Cost per hire in hospitality and retail
Accommodation and food service, with arts and recreation, is the cheapest row in the table at $1,070, and retail sits inside the $4,705 wholesale and retail row. Our own retail and corporate sector runs the cheapest applicants we measure — an $8.58 median with a 26% apply rate. The economics here are about volume and speed rather than cost: the cost of a vacancy usually exceeds the cost of the hire, which is the argument the employee cost calculator makes in dollars.
Cost per hire vs cost per applicant
Cost per hire is everything you spend to recruit, divided by the people who started. Cost per applicant is advertising spend divided by completed applications: the first step of the same funnel, and the only one an advertising platform can see. The two are linked by your applicants-per-hire ratio, which is set by your screening, your interview show rate and your offer acceptance. In Boostpoint’s 2026 Social Job Advertising Benchmark, the median campaign cost $13.88 per applicant and the volume-weighted average was $8.02; to turn either into the advertising part of a hire, multiply by your own ratio.
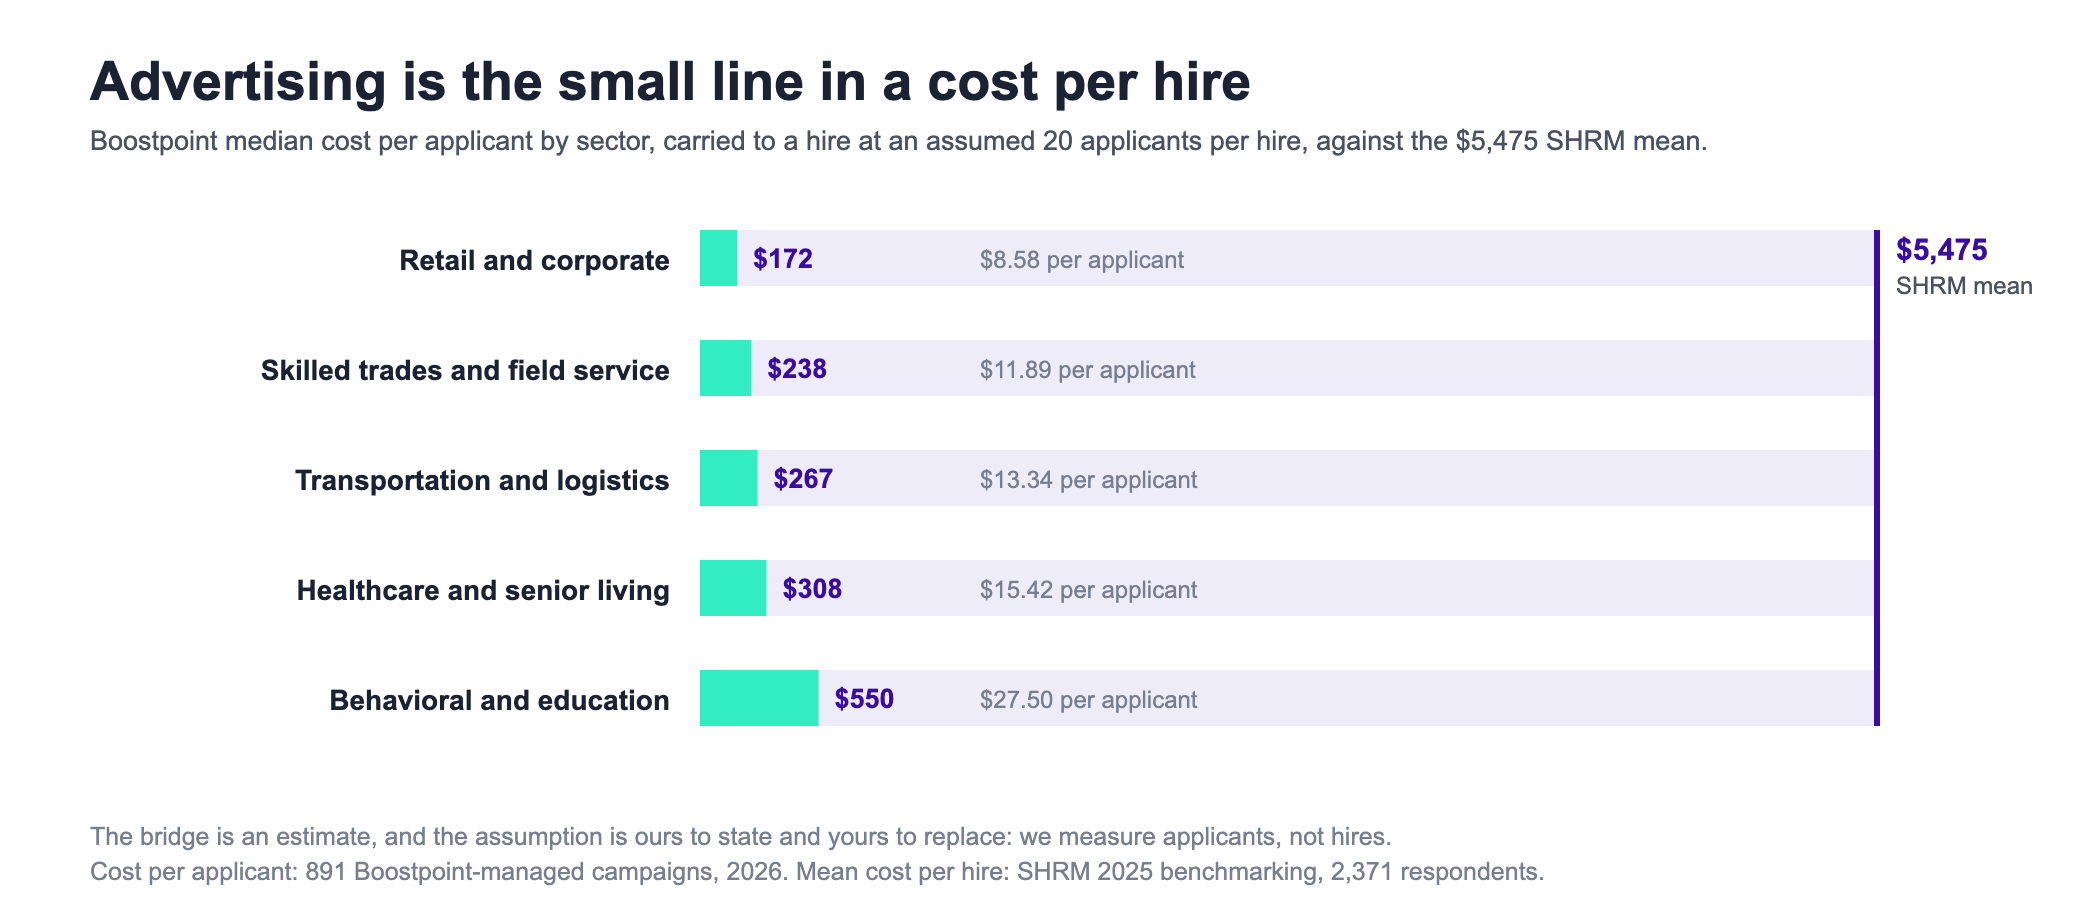
Everything above is somebody else's survey. Here is the part we measure ourselves, from 891 Boostpoint-managed campaigns and 1,334 campaign-months in 2026, published in full on the 2026 social job advertising benchmark.
| Sector | Median cost per applicant | Apply rate | Campaigns | Advertising per hire at an assumed 20 applicants |
|---|---|---|---|---|
| Retail and corporate | $8.58 | 26% | 181 | $172 (estimate) |
| Skilled trades and field service | $11.89 | 18% | 335 | $238 (estimate) |
| Transportation and logistics | $13.34 | 13% | 184 | $267 (estimate) |
| Healthcare and senior living | $15.42 | 16% | 553 | $308 (estimate) |
| Behavioral and education | $27.50 | 10% | 81 | $550 (estimate) |
Read that last column carefully, because it is the only number on this page we constructed rather than found. The assumption is twenty applicants per hire, and it is ours, not yours. How many applicants it takes to make one hire depends on your screening, your interview show rate and your offer acceptance — all of which happen after the click, in systems we do not see. Put your own ratio in and the arithmetic changes completely; at ten applicants per hire the healthcare figure halves, at forty it doubles. We do not publish a cost per hire from advertising data, and we say why on the cost per hire calculator.
What the bridge is useful for is proportion. Even at the pessimistic end, the advertising line is a few hundred dollars against a published cost per hire of several thousand. Whatever is making a frontline cost per hire expensive, it is usually not the advertising.
Year over year: what has actually changed
Three points on a decade-long line, all from the same organization's benchmarking program:
| Period | Reported average | What it was |
|---|---|---|
| Fiscal year 2015 | $4,129 | SHRM Human Capital Benchmarking Report |
| Reported April 2022 | nearly $4,700 | SHRM reporting of newer benchmarking data |
| 2025 survey | $5,475 mean, $1,200 median | SHRM 2025 benchmarking reports, 2,371 respondents |
The mean has risen about a third across a decade, which is roughly in line with wage growth rather than ahead of it. But the more useful observation is that only the 2025 release publishes a median alongside the mean, and the moment it did, the headline number stopped looking like a typical hire. If you have been benchmarking against $4,129 or $4,700 for years, you have been comparing your frontline hiring to an average that includes executive search.
Before you use any figure on this page
Ask three questions of it. Is it a mean or a median? Does it include internal recruiter and hiring manager time, or only invoices? And is the denominator hires who started, or offers accepted? Two employers answering those three questions differently will produce figures several times apart from identical hiring. The number is only ever as portable as its boundary.
Frequently asked questions
The cost of recruiting: the whole bill, not just the hire
Cost per hire is one line of a larger number. When people ask what recruiting costs, they usually mean the total annual bill, and it has five parts. Four of them are invisible on any invoice, which is why the answer people give is almost always too low.
| Component | What it is | How to price it |
|---|---|---|
| Advertising | Job board spend, sponsored posts, social campaigns | The only part you can look up. Applicants needed × cost per applicant — our sector medians ran $8.58 to $27.50 in 2026 |
| Internal time | Supervisor hours spent screening, calling, interviewing and no-showed on | Hours × loaded hourly cost. For most frontline employers this is larger than the advertising line |
| Agency and outsourced fees | Contingency placements, RPO retainers, temp markups | A percentage of salary or bill rate; see RPO and agency cost |
| Tools | Applicant tracking, texting, background checks, assessments | Annual subscription divided by hires. Small in absolute terms, easy to over-buy |
| The vacancy itself | Overtime, agency cover, lost output or refused work while the seat is empty | The biggest line for most operators and the one nobody books to recruiting |
A recruiting budget you can build in five minutes
Work forward from hires rather than backward from a percentage of payroll. The arithmetic is: hires needed × applicants per hire × cost per applicant. The first number comes from last year's separations, the third is in the table on this page, and the middle one you have to measure — it varies far too much by role and by screening standard for anyone else's figure to be useful.
A worked illustration for a warehouse operation that needs twelve hires a year. Suppose it takes eight applicants to make one hire (measure your own; this is an assumption, not a benchmark). Twelve hires × eight applicants is 96 applicants. At the warehouse and production median of $9.83, that is about $944 for the year in advertising — roughly $80 a month. If the same employer's apply rate is poor and it takes twenty applicants per hire at $18 each, the same twelve hires cost $4,320. Same seats, same market, four and a half times the money, and the difference is almost entirely the application form and the speed of the first reply.
Two numbers change the budget more than the budget does. Apply rate explains about 70% of the difference in cost per applicant between two campaigns, and applicants per hire is set by your screening standard and your response time. Fix those and the advertising line shrinks on its own; raise the budget without fixing them and you buy more of the same leak.
Where recruiting spend sits against everything else, and which metrics are worth tracking against it, is on hiring metrics benchmarks. The annual planning version — forecast, channel mix, owners — is on talent acquisition strategy.
What is the average cost per hire?
SHRM's 2025 benchmarking put the mean at $5,475 for nonexecutive roles and $35,879 for executives, from a survey of 2,371 members fielded between 9 January and 3 March 2025. The median nonexecutive hire in the same survey cost $1,200. The mean is more than four times the median because a small number of expensive hires pull it up, so for volume hourly hiring the median is the better anchor.
What is the average cost per hire by industry?
Using SHRM Benchmarking Services figures: accommodation, food service, arts and recreation $1,070; manufacturing $3,497; public administration and education $4,160; information, finance and real estate $4,173; construction, utilities, agriculture and mining $4,371; wholesale, retail, transportation and warehousing $4,705; healthcare and social services $4,770; administrative support and other services $6,338; professional, scientific and technical services $6,464. All are means.
What does SHRM say the average cost per hire is?
SHRM's most recent published figures, announced on 15 October 2025 with its 2025 benchmarking reports, are $5,475 mean for nonexecutive hires and $35,879 mean for executive hires, with executives running nearly seven times more expensive. Earlier SHRM figures were $4,129 for fiscal 2015 and nearly $4,700 as reported in April 2022. The 2025 median nonexecutive figure is $1,200.
What is a good cost per hire?
There is no published threshold, and any single number offered as one is a guess. Three tests are more useful: is the figure stable across quarters on a fixed cost boundary; is it cheaper than the alternative you would otherwise use, such as an agency fee at 15 to 30 percent of first-year salary; and does it hold up when you look at ninety-day retention. Cost per hire always falls when screening stops.
What is the average cost per hire in healthcare?
Healthcare and social services averages $4,770 in the SHRM industry figures. That blends administrative and clinical roles, so it understates licensed hiring. At the front of the funnel our 2026 data shows how wide healthcare is: a caregiver applicant costs a $3.76 median, a CNA $7.72, an LPN $12.77, a registered nurse $19.08 and a physical, occupational or speech therapist $74.62.
What is the average cost per hire for nurses?
No public benchmark publishes a nurse-specific cost per hire, and we do not compute one, because that requires hire data we do not hold. What we can report is the advertising cost of reaching them: across 173 registered nurse campaigns in 2026, the median cost per applicant was $19.08 with an 11 percent apply rate, and across 57 LPN campaigns it was $12.77. Multiply by your own applicants-per-hire ratio to get the advertising component.
What is the cost per hire in manufacturing?
Manufacturing averages $3,497 in the SHRM industry figures, the second cheapest sector in the table. Our own front-of-funnel data agrees with the direction: warehouse and production applicants ran a $9.83 median cost per applicant with a 20 percent apply rate across 82 campaigns in 2026, one of the better conversion rates we measure. Manufacturing hiring is usually a volume problem rather than a scarcity problem.
Why do cost-per-hire benchmarks vary so much?
Three reasons, in order of size. The distribution is skewed, so a mean and a median from identical data differ by more than four times. Employers draw the cost boundary differently, and internal recruiter and hiring manager time is the line most often left out. And the denominator varies: hires who started is not the same count as offers accepted. Compare boundaries before you compare numbers.
What does recruiting cost per year?
Add five components: advertising, internal supervisor time, any agency or RPO fees, tools, and the cost of the vacancy while the seat is empty. Only the first is on an invoice, which is why most stated recruiting costs are too low.
How do I calculate a recruiting budget?
Hires needed, times applicants per hire, times cost per applicant. Take hires from last year's separations, measure applicants per hire yourself, and use the sector medians on this page for the third figure.
What is the difference between cost of recruiting and cost per hire?
Cost per hire is the total recruiting spend divided by hires in the same period. The cost of recruiting is the total itself, including the internal time and the vacancy cost that most employers never book against hiring.
How much should a small employer spend on job advertising?
Work it from the seats rather than from a percentage of payroll. Twelve warehouse hires at eight applicants each and a $9.83 median is roughly $944 a year; the same twelve hires with a poor apply rate can cost four times that.
What is the cost per hire for construction workers?
The SHRM industry figures on this page do not break out construction workers on their own. The closest row is construction, utilities, agriculture and mining at $4,371, a mean that blends office, supervisory and field hires. What Boostpoint measures is the advertising at the front of the funnel: for skilled construction trades, the Skilled trades family in Boostpoint's 2026 Social Job Advertising Benchmark had a median of $14.14 per applicant and a 15% apply rate. That is a cost per applicant, not a cost per hire. Multiply it by your own applicants per hire to get the advertising part of a construction hire; the rest is supervisor time, any agency fee and the cost of the crew running short. Channels and timing are covered in how to recruit construction workers.
What is the cost per hire for hospitals?
The SHRM figures on this page do not report hospitals separately. The nearest row is healthcare and social services at $4,770, a mean for the whole sector that blends administrative hires with licensed clinical ones. A hospital's real cost per hire differs by role, so calculate it per role family. At the front of the funnel, Boostpoint's 2026 benchmark shows how far apart those families sit: median cost per applicant was $7.72 for the CNA / nursing assistant family, $12.77 for LPN / LVN, $19.08 for registered nurse, $54.37 for allied health / imaging and $74.62 for therapy (PT / OT / SLP). Multiply each by that role's applicants per hire from your ATS; the formula is on our cost per hire page.
What is the cost per hire for hospitality?
In the SHRM industry figures on this page, accommodation and food service, arts, entertainment and recreation is the cheapest row at $1,070, a mean. Boostpoint's 2026 benchmark does not report hospitality as a role family of its own, so the all-campaign median of $13.88 per applicant is a general reference rather than a hospitality price. In hospitality the bigger cost is repetition: the sector turns over fast, so the same seats are refilled often and the cost per hire is paid again each time. Shortening the application and answering applicants the same day cut both the cost per applicant and how often you pay it. See hospitality recruiting for the playbook and the cost of vacancy calculator for what an empty shift costs.
Two neighbors to this page: the formula and a worked example live on cost per hire, and the tool that runs your own figure under three definitions at once is the cost per hire calculator, and the nine levers for bringing your own figure down are ranked on how to reduce cost per hire.
See what an applicant costs in your sector
Tell us the roles you are filling and the markets you are filling them in, and we will show you the cost per applicant behind these figures.
Book a Demo