
Hospitality Recruiting: How to Hire Restaurant and Hotel Staff When the Quits Rate Is Double Everyone Else's
Hospitality recruiting is replacement hiring at a rate no other sector runs: workers in accommodation and food services quit at 4.1% a month against 2.0% for the whole economy (BLS JOLTS, June 2026, revised), and BLS projects about 889,000 openings a year for cooks and servers alone. So plan hires per month, not per opening; run a campaign built around a date or a standing multi-role campaign rather than one ad per vacancy; put the pay, the shift, and the tip arrangement in the first line; and take applications in under a minute, on a phone, between shifts. When they apply, our server interview questions cover what to ask front-of-house candidates.
A note on who's writing this
Boostpoint runs social media job ads for restaurants, hotels, and other frontline employers, so the parts of this page about advertising describe what we sell and should be read that way. The turnover and wage facts are the Bureau of Labor Statistics', the National Restaurant Association's, and Black Box Intelligence's, each named where used. One thing we will not do on this page is give you a restaurant-specific cost per applicant: our 2026 benchmark does not break hospitality out as a sector, and we would rather say so than borrow a number from a neighboring one. The campaign-structure figures below come from the whole benchmark, and they are about how hospitality employers should structure recruiting, not what it will cost them. For staffing-agency fees, which are the other half of this question, we keep a separate page on hospitality staffing agency costs.
The condition you are recruiting in: replacement, every month
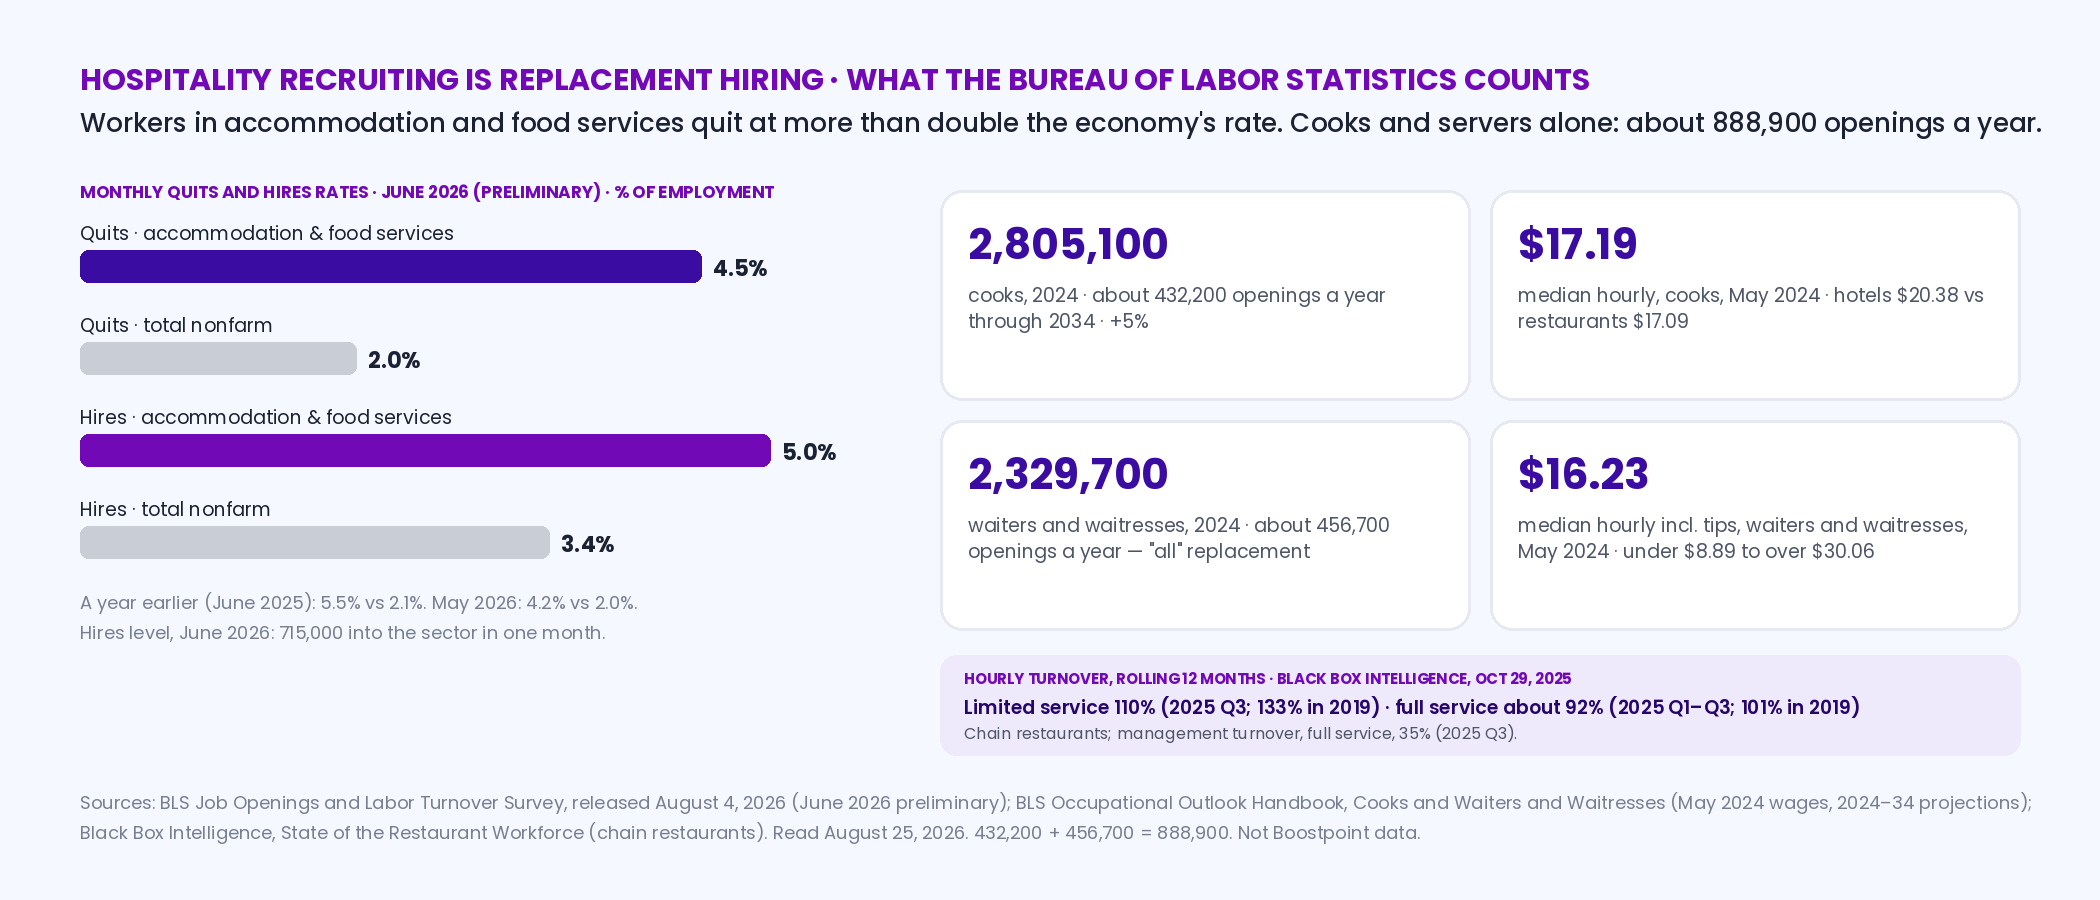
Most recruiting advice assumes an opening is an event. In hospitality it is a rate. In BLS's Job Openings and Labor Turnover Survey, the quits rate for accommodation and food services was 4.1% of employment in June 2026 (revised), against 2.0% for total nonfarm and 2.2% for the private sector; in May it was 4.2% against 2.0%, and a year earlier, in June 2025, 5.5% against 2.1%. Hires ran at 5.0% of employment in June 2026 — 722,000 people hired into the sector in one month — against 3.4% economy-wide. No other industry in the table quits or hires at that pace. Read across a full year rather than a single month, the same series is the restaurant turnover rate.
Black Box Intelligence, which benchmarks restaurant chains, puts the annual version of that in its State of the Restaurant Workforce (October 29, 2025): hourly turnover on a rolling twelve months of 110% in limited-service restaurants (2025 Q3; 133% in 2019) and about 92% in full-service (2025 Q1–Q3; 101% in 2019), with full-service management turnover at 35%. Those are chain figures and the improvement since 2019 is real, but a restaurant that turns over its hourly staff roughly once a year is not "hiring a cook." It is hiring cooks, continuously, and the recruiting system has to be built for that.
| Measure | Accommodation & food services / restaurants | Comparison | Source |
|---|---|---|---|
| Quits rate, June 2026 (revised) | 4.1% of employment per month | Total nonfarm 2.0%; total private 2.2% | BLS JOLTS, September 1, 2026 release |
| Quits rate, May 2026 | 4.2% | Total nonfarm 2.0% | BLS JOLTS |
| Quits rate, June 2025 | 5.5% | Total nonfarm 2.1% | BLS JOLTS |
| Hires rate, June 2026 (revised) | 5.0% (722,000 hires) | Total nonfarm 3.4% | BLS JOLTS |
| Hourly turnover, limited service, rolling 12 months | 110% (2025 Q3) | 133% in 2019 | Black Box Intelligence, October 29, 2025 |
| Hourly turnover, full service, rolling 12 months | About 92% (2025 Q1–Q3) | 101% in 2019 | Black Box Intelligence |
| Management turnover, full service | 35% (2025 Q3) | — | Black Box Intelligence |
The industry-level picture is the same. The National Restaurant Association's 2026 State of the Restaurant Industry (February 12, 2026) projects 15.8 million restaurant and foodservice jobs in 2026, more than 100,000 of them new, on $1.55 trillion in sales; "nearly three quarters of operators plan to hire but expect difficulties finding experienced managers and chefs," and 42% of operators reported their restaurant was not profitable last year. Hiring plans and thin margins in the same sentence is the whole recruiting problem: you cannot buy your way out of a 100% turnover rate, so the system has to be cheap to run every month.
Whether there is still a restaurant labor shortage at all, and which formats and roles it is concentrated in, is covered on our restaurant labor shortage page.
The two roles that define the sector, in BLS's numbers
For cooks, BLS counted 2,805,100 jobs in 2024 and projects about 432,200 openings a year through 2034 on 5% growth; median pay was $35,760 a year, or $17.19 an hour, in May 2024, with the lowest tenth under $12.00 and the highest tenth above $22.45. Cooks in traveler accommodation — hotels — earned a median $20.38 an hour against $17.09 in food services and drinking places, which is the first useful recruiting fact on this page: a hotel kitchen can out-pay the restaurant down the street and should say so. 76% of cooks work in food services and drinking places, 7% in healthcare, 5% in education, 3% in hotels. No formal education is typically required.
For waiters and waitresses: 2,329,700 jobs, about 456,700 openings a year, and — BLS's words — all of them "expected to result from the need to replace workers who transfer to other occupations or exit the labor force," because employment is projected to decline 1%. Median pay including tips was $33,760 a year, $16.23 an hour, with a spread from under $8.89 to over $30.06 an hour that is wider than any hourly figure can describe. Training is "several days to a few weeks." Part-time work is common; so are early mornings, late evenings, weekends, and holidays. Add the two occupations together and BLS is projecting 888,900 openings a year, nearly all of them replacement — the annual shape of the monthly quits rate above.
Volume planning assumes the interviews convert, which for room attendants comes down to two numbers and one judgment call. Our housekeeper interview questions work through rooms per shift against your own assignment, and what to ask about being alone in an occupied room.
That planning only works if the turnover figure behind it is the right one. Employee turnover in hospitality reconciles the 66%, 92% and 110% figures in circulation, shows which population each one counts, and works out how many roles that leaves standing empty at any moment.
The hospitality labor shortage
If a labor shortage means more open jobs than the rest of the economy, the hospitality one has largely closed. In the BLS JOLTS job openings table (last modified 1 September 2026), accommodation and food services had 673,000 openings in July 2026 (preliminary), an openings rate of 4.5 percent against 4.4 percent for total nonfarm. A year earlier, in July 2025, it was 840,000 openings and 5.6 percent.
What has not closed is the quits gap. In the same release’s quits table, 3.5 percent of the sector’s workers quit in July 2026 (preliminary), against 1.9 percent across all nonfarm employers. That is why hotel and restaurant operators still describe a shortage when the openings data says the market has loosened: the jobs are not unusually hard to post, they are unusually quick to empty again. The hotel labor shortage follows the same pattern, though the national release tables do not separate hotels from restaurants, so your own monthly quit rate is a better guide than any national figure. For restaurants specifically, see the restaurant labor shortage; for how the turnover figures in circulation compare, employee turnover in hospitality.
Plan hires per month, not per opening
The arithmetic is short and most operators have never done it. Take your hourly headcount and your turnover rate — your own, or Black Box's 110% for limited service and 92% for full service if you don't track it — and you have hires per year; divide by twelve for hires per month; multiply by the applicants you need to see for one hire and you have the applicant volume the recruiting system has to produce every month, whether or not anyone has given notice. A 40-person limited-service crew at 110% turnover needs 40 × 1.10 = 44 hires a year, or 44 ÷ 12 = 3.67 a month; at eight applicants per hire that is 3.67 × 8 = 29.3 applicants a month, every month. For scale, the median campaign in our 2026 benchmark produced 20 applicants in a campaign-month on a $334 budget and reached 6,061 people — so that crew is asking for roughly a campaign and a half of median output, continuously, not a job posting when someone quits.
Interactive
Replacement math — how many applicants a month your turnover actually requires
Nothing is stored or sent — this runs in your browser. Use your own turnover if you track it; the defaults are Black Box Intelligence's chain figures.
Arithmetic on your inputs only. Applicants per hire is yours to set — it depends on your form, your response time, and your no-show rate, and we publish no hospitality funnel. This estimates volume, not cost: cost per applicant is not cost per hire, and this page computes neither for restaurants.
Match the campaign structure to the turnover
Once the unit of planning is hires per month, the way most restaurants advertise — one posting per vacancy, switched on when someone quits and off when someone starts — is visibly the wrong shape. Our 2026 benchmark compared campaign structures across all sectors, and the result is the most useful finding on this page for a hospitality employer: campaigns built around a date — a hiring day, an opening, a season start — produced the lowest median cost per applicant of any structure. One campaign for one specific opening, switched on after each quit, is the default, and it gives that advantage away. Seasonal operations that cannot fill locally at any campaign structure sometimes turn to a visa instead; H-2B visa for employers covers the cap, the timeline and the recruitment you owe US workers first.
| Structure | The hospitality version |
|---|---|
| Event-driven | A hiring day at the restaurant on a Tuesday afternoon; the new location's open house; "interviews on the spot, Thursday 2–5" |
| Multi-role / always-on | One standing campaign for a group: cooks, servers, dish, host — always live, roles swapped in and out |
| Single-role | "Line cook wanted," launched the day after the notice, paused the day the new cook starts |
The structure finding comes from the Boostpoint 2026 Social Job Advertising Benchmark across all sectors; no hospitality-only cut exists. The practical reading: a single restaurant should run its recruiting as a series of dated hiring days — the mechanics and the RSVP math are on our on-the-spot hiring page — and a group or a hotel should keep one multi-role campaign live all year and treat each vacancy as a change to the ad, not a new campaign. A new location or a seasonal surge is mass hiring, which is the event structure at scale.
If you are choosing the tools rather than the tactics, restaurant hiring software sets out the three kinds of product and what each one does for a restaurant or hotel.
The case for a staffing agency or a shift app first
Before the advertising: there are hospitality situations where paying an agency markup or a shift-app fee is the right answer, and our agency-cost page says so with the fee ranges. A 400-cover banquet on Saturday with two servers out is not a recruiting problem; it is a Saturday problem, and a staffing agency or a gig platform exists to solve exactly that at a price. A new hotel opening with a hard date and no local HR yet may want an agency to carry payroll and compliance for the first ninety days while direct recruiting ramps. And a single-unit operator who cannot answer applicants within the hour — because they are on the line — may get more from a service that does the screening than from a cheaper applicant nobody calls. The agency's weakness is structural, not moral: its fee is a percentage of every hour worked, so it is priced for surges and expensive as a way of staffing the schedule. Use it for the Saturday. Build the rest yourself. The ranges, and how they compare across industries, are on staffing agency markup and fees.
What a cook or a server reads first
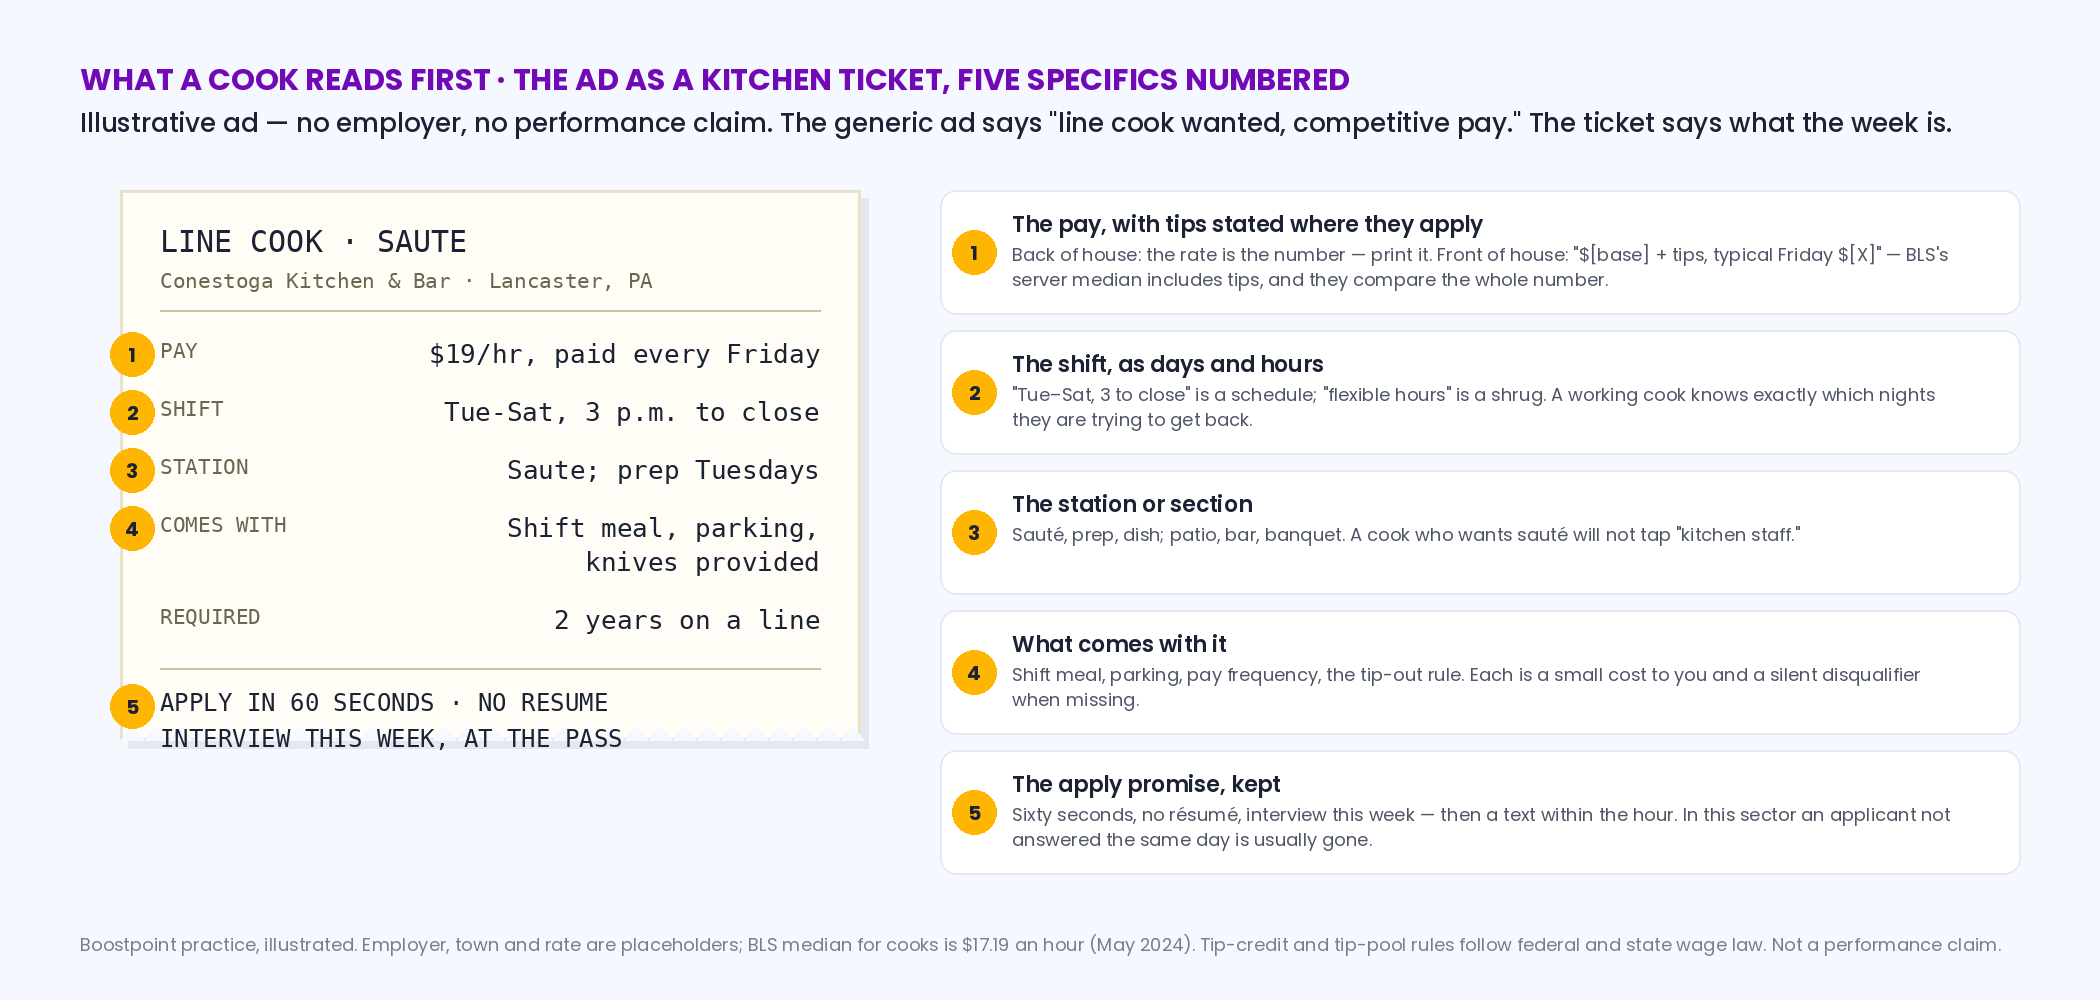
Hospitality workers read job ads the way they read a ticket: fast, for the specifics, and with an eye for what's missing. Across 891 campaigns, applicant conversion — what happens after the click — explained 70% of the variation in cost per applicant; audience explained 30%, and creative 18%. In a sector where nearly everyone applies from a phone between shifts, the ad's job is to make the tap obvious and the form's job is to not lose them. The first line carries five things, in this order:
- The pay, with the tip arrangement stated. "$16 + tips" and "$16 + tip pool, averaging $24–$27 on weekend nights" are read as different ads by the same server. BLS's waiter median of $16.23 an hour includes tips; a server comparing ads is comparing the whole number. For back of house, the hourly rate is the number — print it, not "competitive."
- The shift, as days and hours. "Tuesday to Saturday, 3 to close" is a schedule; "flexible hours" is a shrug. A cook deciding whether to leave a job knows exactly which nights they are trying to get back.
- The station or section. Line, prep, sauté, dish; patio, bar, banquet. A cook who wants sauté will not apply to "kitchen staff."
- What comes with it. Shift meal, parking, the uniform, paid weekly or biweekly, and the tip-out rule if there is one. Each is a small cost to you and a silent disqualifier when missing.
- The apply promise, kept. "Apply in 60 seconds, no résumé, interview this week." Then keep it: a hospitality applicant who is not texted the same day has usually accepted somewhere else.
Interactive
Kitchen-ticket ad builder — which role is this ad for?
Nothing is stored or sent — this runs in your browser. Pick the role; the ticket shows what its first line has to carry and what that person is comparing you against.
Boostpoint's practice, not a template to paste. Bracketed fields are yours; rates are placeholders, not recommendations. Knockout questions must be real requirements of the job; nothing about age, sex, or origin. Tip-credit and tip-pool rules are set by federal and state wage law — state yours the way you actually run it.
In Seattle and San Francisco there is a step before the form. And where the shift is going to a 16 or 17 year old, child labor laws by state decides how late it may run and what has to be on file first. Both require available hours to be offered to existing part-time staff before anybody new is hired; our page on predictive scheduling laws by state sets out that rule and the notice periods that go with it.
The form is where hospitality recruiting is won or lost
If conversion explains 70% of cost variation, the form is the biggest lever a restaurant owns, and the benchmark shows how steep it is. Campaigns with an apply rate under 5% paid a median $53.77 per applicant; 5% to 10%, $23.13; 10% to 20%, $11.11; 20% to 35%, $4.41; over 35%, $1.61. In this dataset, 41% of all budget ran in campaigns converting under 10% and produced 11% of the applicants. For a server on a break with four minutes and a cracked screen, the form is name, phone, the three knockout questions from the ticket above, and a submit button. No résumé — BLS's training requirement for a server is "several days to a few weeks," and asking for a résumé to prove it filters out the people you want. No account creation. No "tell us about yourself." Then the response: a text within the hour, a call the same day, an interview that week, ideally at the restaurant during a slow hour so the applicant sees the kitchen and meets the chef. A same-day response is not a courtesy in this sector; it is the difference between a hire and an applicant who is already working somewhere else.
Watch frequency in a small radius
A restaurant recruits from a few miles around it, and a small radius fills up fast. In the benchmark, campaigns running below a frequency of 1.5 paid a median $7.85 per applicant; at 3.0 to 4.0, $18.76; above 4.0, $26.78 — and 33% of all budget ran above 3.0, with click-through falling from 1.69% to 0.94% across the range. The same people seeing "hiring line cooks" for the seventh time do not become more likely to apply; they become the audience you have exhausted. For a single unit, the operating rule is to check frequency weekly and act when it passes 2.5: rotate the creative — new footage of the line at 6 p.m., a different first line — pause for a week, or move the budget to the hiring day. A group with a standing multi-role campaign has a natural fix — rotate which roles lead the ad.
Where restaurant and hotel staff actually come from
| Channel | Who it reaches | What it costs you | The honest note |
|---|---|---|---|
| Your staff's referrals | Cooks and servers your people have worked beside — the industry moves in groups | A bonus paid in installments at 30 and 90 days | The fastest hire and the one that stays past 90 days. Ask every shift for one name, not once a year. |
| Hiring day at the restaurant (event-driven) | Employed people who will walk in on a Tuesday afternoon but won't fill out a form | Ad spend to fill the room, plus a manager's afternoon; the lowest median cost per applicant of any campaign structure in our benchmark | The cheapest structure we measured. Run one a month if turnover says you need three hires a month. See open house hiring events. |
| Social feed ads (Facebook, Instagram) | Employed cooks and servers scrolling on a break — the majority of the sector on any given day | Media plus management; no hospitality-specific figure published | What we sell. Works as a standing multi-role campaign or to fill the hiring day; fails as a one-off posting with a long form behind it. |
| The window sign and the QR code | Regulars, neighbors, and the server from across the street | A sign, and the same one-minute form behind the code | Still real. Put the pay on the sign; "Now hiring" without a number is wallpaper. |
| Job boards | The minority actively searching this week, plus everyone every other restaurant in town is also emailing | Per post or per click | Fine for management and chef roles, where BLS and the NRA both say the shortage is; slow for the hourly crew. |
| Staffing agencies and shift apps | Temporary staff at a markup or per-shift fee | A percentage on the wage or a fee per shift; see the agency cost page | Right for the banquet on Saturday. Wrong as the way you staff Tuesday. |
| Culinary and hospitality programs | Entry-level cooks and future managers | Externship slots and a manager's time | Slow, and the only channel that produces the "experienced chefs" three quarters of operators say they can't find. |
Hotels carry two crews with different recruiting: the kitchen and restaurant above, and housekeeping, which is its own labor market with its own ad — we've written that up separately in how to hire housekeeping and janitorial staff. The hotel's one structural advantage in the kitchen is the wage: BLS's $20.38 median for cooks in traveler accommodation against $17.09 in restaurants is a first line by itself.
A recruiting month for a restaurant
- Week 1: run the replacement math. Write one ticket-style ad per role you'll need this quarter, with the pay including tips, the shift, and the station. Build the one-minute form: name, phone, three knockout questions. Shoot fifteen seconds of the line on a phone.
- Week 2: launch the standing multi-role campaign (a group) or schedule the first hiring day (a single unit) and run the ads to fill it. Ask every shift for one referral, with the bonus in writing. Put the pay on the window sign.
- Weeks 3–4: text every applicant within the hour; interview at the restaurant during a slow hour; make offers the same day for hourly roles. Check frequency weekly and rotate the creative past 2.5.
- Every month after: keep it on. BLS's 888,900 openings a year for cooks and servers and a 4.1% monthly quits rate mean the next vacancy has a date even if you don't know it yet; a campaign that never turned off costs less than one relaunched in a panic every six weeks.
The opening isn't the event. The turnover rate is the event, and it happens every month — so recruit like it.
If you want the cost side of the same argument, we compute what the industry actually spends on wages as a share of sales — and why that share keeps falling — on restaurant labor costs.
Related: Front Desk Interview Questions, Host & Hostess Job Description, Concierge Job Description, Valet Attendant Job Description, Bartender Interview Questions.
Frequently asked questions
How do you recruit hospitality staff?
Treat it as replacement hiring at a rate, not a series of openings: the quits rate in accommodation and food services was 4.1% a month in June 2026 (BLS JOLTS, revised), more than double the economy's 2.0%. Compute hires per month from headcount and turnover, run a campaign structure built for that — a hiring day each month for a single unit or a standing multi-role campaign for a group — write the ad with the pay including tips, the shift, and the station in the first line, and take applications in under a minute with a same-day response.
Why is restaurant turnover so high?
The measured facts, from BLS and Black Box Intelligence: hourly turnover of 110% in limited-service and about 92% in full-service restaurants (Black Box, 2025), a monthly quits rate more than double the economy's (BLS JOLTS), training of "several days to a few weeks" for servers and no formal education typically required for cooks, so switching costs are low; part-time work and evening, weekend, and holiday schedules are common. The causes are debated; the recruiting consequence is not — the system has to produce applicants every month.
How much do cooks and servers make?
Per the BLS Occupational Outlook Handbook (May 2024 data), the median for cooks was $35,760 a year or $17.19 an hour, with cooks in hotels (traveler accommodation) at a $20.38 median against $17.09 in restaurants; for waiters and waitresses, $33,760 a year or $16.23 an hour including tips, with a range from under $8.89 to over $30.06. Local markets vary widely; the ad should print your rate and, for tipped roles, the tip arrangement and a realistic typical shift.
What should a restaurant job ad say?
Five things in the first line: the pay with the tip arrangement stated; the shift as days and hours; the station or section; what comes with it (shift meal, parking, pay frequency, tip-out rule); and an apply promise you keep — sixty seconds, no résumé, interview this week. Leave duties lists and "team player" language out; the person reading it is a working cook or server on a break, comparing you to the job they already have.
Should a restaurant use a staffing agency?
For a surge with a date — a banquet, a catering weekend, a pre-opening month — often yes; an agency or shift app is priced for exactly that, and our hospitality staffing agency cost page has the fee ranges. As the way you staff the regular schedule, the markup is a percentage of every hour worked, which is expensive against a turnover rate near 100%. The usual split: agency for the Saturday, direct recruiting for the week.
What is the best way to hire restaurant staff fast?
A dated hiring day, advertised for a week, with interviews and offers on the spot. In our 2026 benchmark, event-driven campaigns produced the lowest median cost per applicant of any campaign structure, and the walk-in format skips the form entirely for the people who won't fill one out. Pair it with a same-day response to every online applicant: in this sector an applicant who isn't texted the same day is usually gone.
How many applicants do you need to hire a cook?
We don't publish a hospitality funnel, so use your own: count applications per hire including no-shows, and multiply by hires per month from your turnover. A 40-person crew at 110% turnover needs 44 hires a year, 3.67 a month; at eight applicants per hire that is about 29 applicants a month, roughly a campaign and a half of the benchmark's median 20 applicants per campaign-month. The calculator on this page does the arithmetic on your numbers.
What does it cost to recruit restaurant staff with advertising?
We don't publish a restaurant- or hospitality-specific cost per applicant, because our 2026 benchmark does not break the sector out, and we won't borrow a neighbor's number. What we publish is structural and applies across sectors: event-driven campaigns produced the lowest median cost per applicant of any campaign structure, with apply rate explaining 70% of the variation in cost. Cost per applicant is not cost per hire, and this page makes no claim about the latter.
Recruit for the month, not the opening
We'll build the ticket-style ads and the one-minute form, run the hiring day or the standing campaign where cooks and servers actually scroll, and show you the campaigns closest to yours — costs, and no hospitality number we can't back.
Book a DemoBoostpoint figures come from the 2026 Social Job Advertising Benchmark — 891 campaigns and 1,334 campaign-months: by campaign structure, event-driven campaigns produced the lowest median cost of any structure. Median campaign $334 a month, 20 applicants per campaign-month, 6,061 people reached. Apply-rate bands: under 5% $53.77, 5–10% $23.13, 10–20% $11.11, 20–35% $4.41, over 35% $1.61; 41% of budget in campaigns converting under 10% produced 11% of applicants. Frequency: under 1.5 $7.85, 3.0–4.0 $18.76, over 4.0 $26.78; 33% of budget above 3.0; click-through 1.69% to 0.94%. Applicant conversion explains 70% of cost variation, click-through rate 30%, cost per thousand impressions 18%. No hospitality or restaurant sector cut exists in the benchmark and none is stated. Cost per applicant is not cost per hire; we do not track hires and publish no cost-per-hire figure. Turnover, wage, and employment figures are BLS's, the National Restaurant Association's, and Black Box Intelligence's, attributed in place. Channel notes, the ticket format, and the replacement arithmetic are Boostpoint's practice, not measured results; the calculators run on your inputs. A sample of Boostpoint campaigns, not an industry-wide study.