
Restaurant Turnover Rate
Three numbers are in circulation and all three are correct. The federal survey publishes 5.5% for accommodation and food services, which is an average monthly rate and works out at 66.0% of the workforce across the year. A restaurant-only industry index puts rolling twelve-month hourly turnover at 110% in limited service and around 92% in full service. They count different populations by different rules, and the one you should measure yourself against depends on which staff you are counting.
The three numbers, and what each one counts
The federal figure covers accommodation and food services as an industry: every employee on the payroll, hourly and salaried, in restaurants, bars and hotels alike. It counts every separation, voluntary or not, and it excludes anyone working through a temporary agency, an outside contractor or a leasing company.
The industry index is narrower and closer to the floor. It tracks hourly restaurant employees at participating brands on a rolling twelve-month basis, which is why it reads well above the federal line (110% is 1.67 times the federal 66.0%, and 92% is 1.39 times it): hourly restaurant staff churn far faster than the salaried managers and hotel employees mixed into the federal number.
And the third form of the number, 66.0%, is the federal rate expressed the way operators actually think about it. The survey publishes an average monthly rate under an annual label, so multiplying by twelve gives the share of a workforce that separated across the year. That multiplication is exact rather than an estimate, because the published rate is defined as summed monthly separations over summed monthly employment.
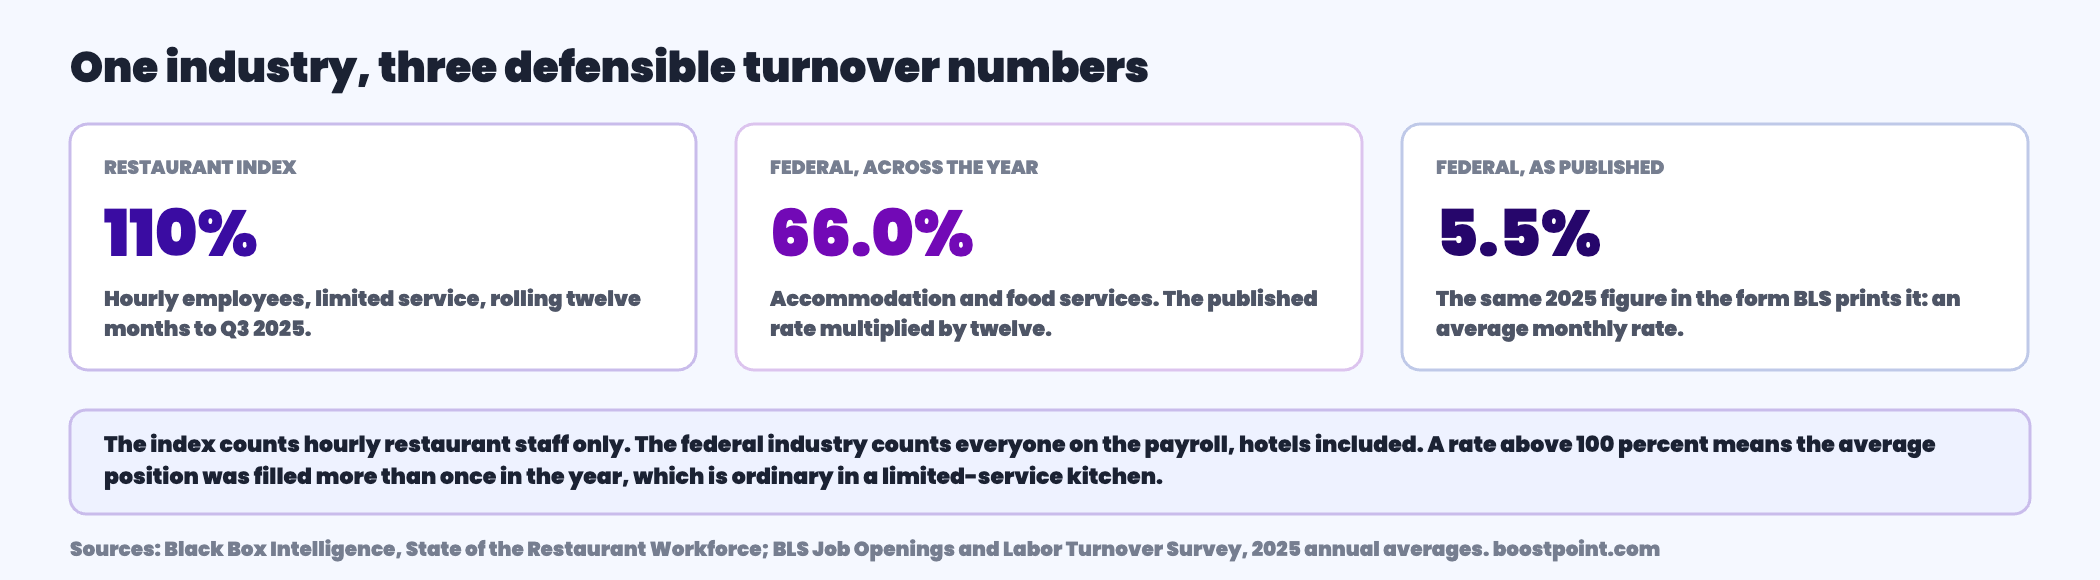
The federal rate for restaurants, in both forms
Accommodation and food services runs the highest separations rate of any major private industry apart from arts, entertainment and recreation, and it runs the highest quits rate of any industry at all. Set against the whole economy the gap is not subtle.
| Industry | Separations, as published | Separations, across the year | Quits, across the year |
|---|---|---|---|
| Arts, entertainment and recreation | 6.1% | 73.2% | 26.4% |
| Leisure and hospitality | 5.6% | 67.2% | 46.8% |
| Accommodation and food services | 5.5% | 66.0% | 50.4% |
| Retail trade | 3.8% | 45.6% | 31.2% |
| Total, all industries | 3.3% | 39.6% | 24.0% |
Source: U.S. Bureau of Labor Statistics, Job Openings and Labor Turnover Survey, annual average rates 2025, not seasonally adjusted, read August 29, 2026. Across-the-year figures are the published rates multiplied by twelve; BLS does not publish them in that form and the multiplication is ours.
Restaurants and hotels separate staff at 1.67 times the all-industry rate, and quit at 2.1 times it. The hires rate matches the separations rate almost exactly, at 5.5% a month, which is what a workforce in steady-state replacement looks like: an industry hiring at full speed all year and staying roughly the same size.
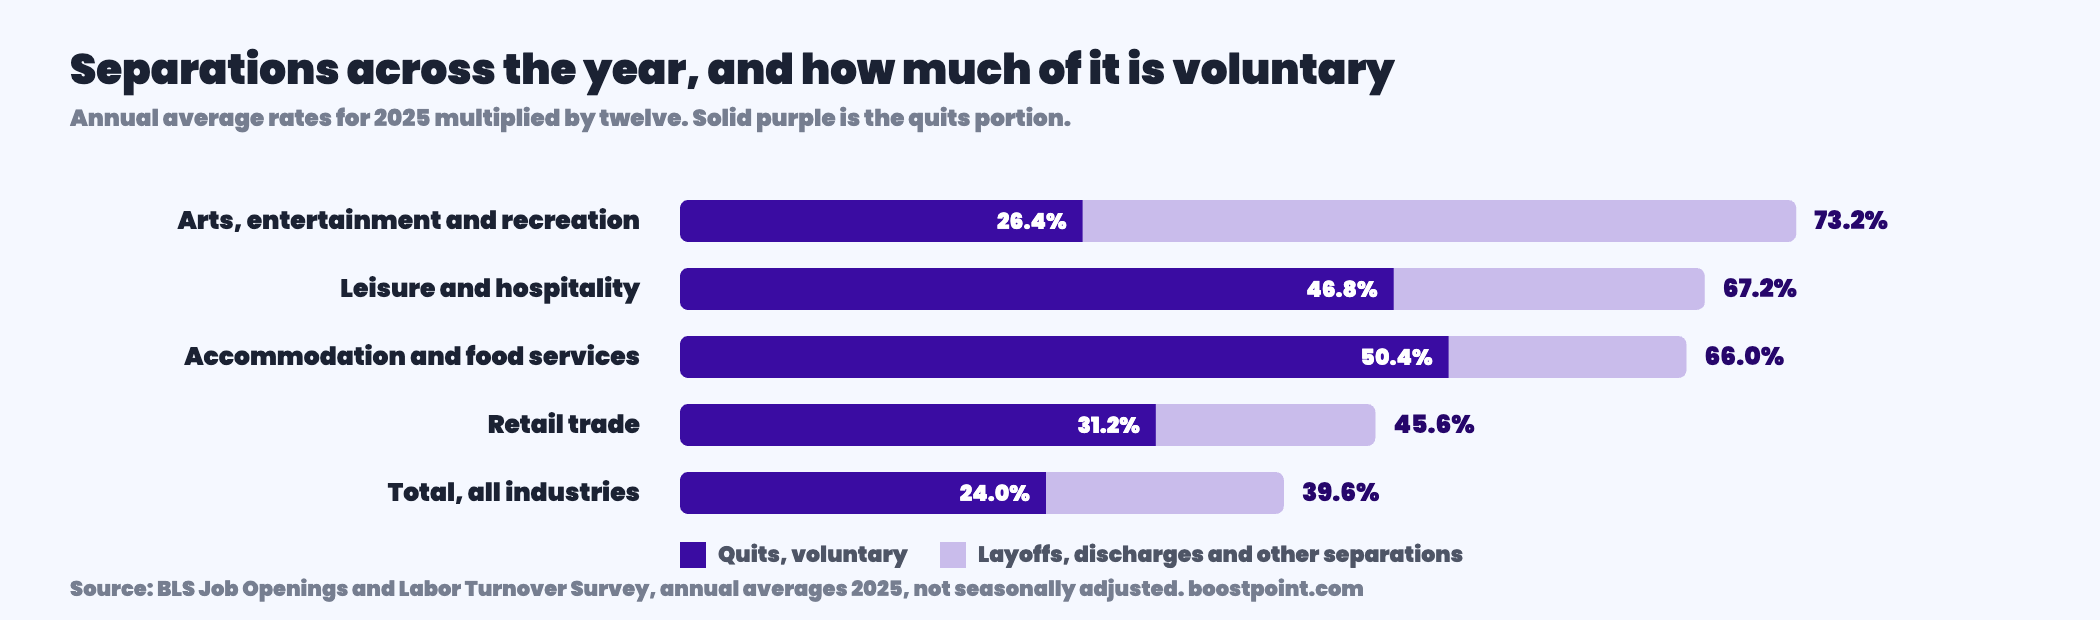
Almost all of it is voluntary
Of the 5.5 points of monthly separations, 4.2 are quits and 1.1 are layoffs and discharges, leaving about 0.2 for retirements, transfers and other separations. Across the year that is 50.4% quitting, 13.2% let go, 2.4% leaving for other reasons.
This is the opposite of the pattern in arts, entertainment and recreation, where a similar headline rate is driven mostly by employer-initiated separations. It matters because the two halves respond to completely different management. A quits-heavy rate is a schedule, pay, and first-shift experience problem. A layoff-heavy rate is a demand-forecasting problem. Restaurants overwhelmingly have the first one.
It also means the quits line is the honest benchmark for most operators. If you are trying to work out whether your people leave more than the industry does, 50.4% across the year is the number to beat, not 66.0%. The same two forms of the same rate are set out for every other industry on employee turnover rates by industry.
What has changed since 2021
Restaurant turnover has fallen a long way from its peak and has now essentially stopped falling. Separations ran 85.2% across 2021 and 66.0% across 2025, with almost all of that improvement landing in 2023 and 2024. Quits fell further in proportional terms, from 69.6% to 50.4%.
| Year | Separations | Quits | As published, separations |
|---|---|---|---|
| 2021 | 85.2% | 69.6% | 7.1% |
| 2022 | 84.0% | 69.6% | 7.0% |
| 2023 | 75.6% | 60.0% | 6.3% |
| 2024 | 64.8% | 49.2% | 5.4% |
| 2025 | 66.0% | 50.4% | 5.5% |
Source: U.S. Bureau of Labor Statistics, Job Openings and Labor Turnover Survey, annual average total separations and quits rates for accommodation and food services, 2021 to 2025, not seasonally adjusted, read August 29, 2026. Across-the-year figures are the published rates multiplied by twelve.
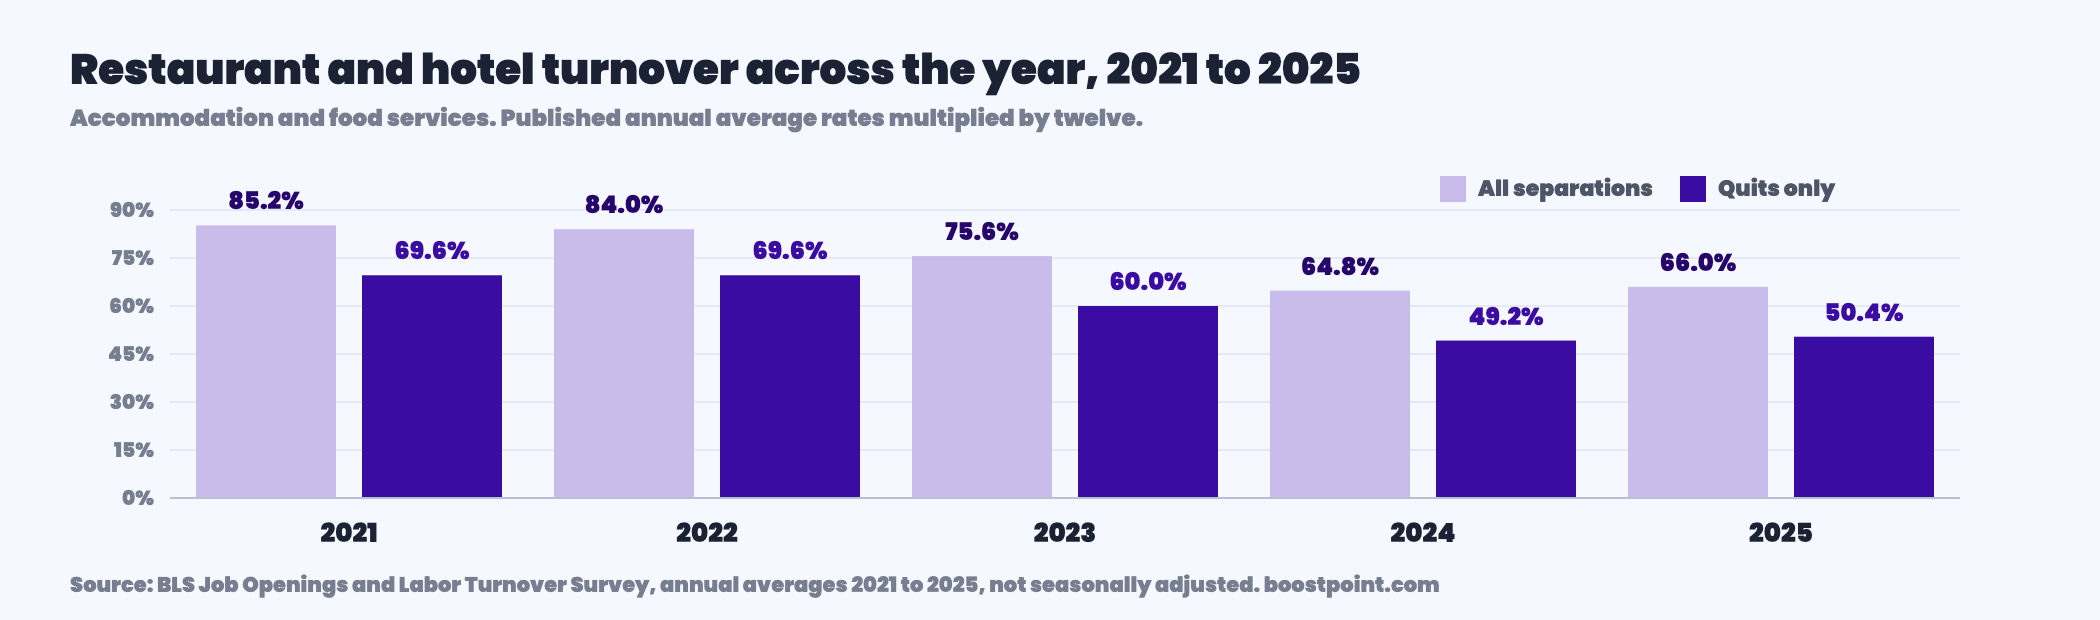
The small increase in the most recent year is the part worth watching. It is not large enough to call a reversal on its own, but it arrived after two years of steady improvement, and it means the easy gains from a cooling labor market have been taken.
Why the industry indexes read higher
Rolling twelve-month hourly turnover in limited service was 110% in the third quarter of 2025, down from 133% in 2019. Full service ran about 92% across the first three quarters of 2025, against 101% in 2019. Manager turnover is a different story: limited-service management has sat at roughly 44% to 47% through 2024 and 2025, while full-service management improved from 41% to 35% over the same period.
Three things explain the distance between 110% and 66.0%. The index counts hourly employees only, and hourly staff turn over faster than the salaried population folded into the federal figure. It covers restaurants specifically, while the federal industry includes hotels, where turnover is materially lower. And a rate above 100% is normal in a workforce where the same position is filled more than once in a year, which is exactly what happens in a limited-service kitchen.
None of that makes one number better than the other. It means you compare hourly restaurant staff to the hourly restaurant index, and total payroll to the federal industry line, and you never mix them in the same sentence.
Where your own number sits
The comparison below picks the right benchmark for what you are counting and shows the gap in both directions.
Comparison
Your rate against the right benchmark
Enter the share of your workforce that left across a full year, then say which group you counted.
Federal lines are the published 2025 annual averages multiplied by twelve. Index lines are the published rolling twelve-month figures, quoted unchanged.
Turnover as a monthly hiring plan
A restaurant turnover rate is really a hiring schedule wearing a percentage sign. The number that runs a store is not the annual rate but how many people you have to bring in each month simply to stay level.
Replacement plan
What the rate costs you in hiring
Headcount across all your locations, and the annual turnover you are running.
Replacement hiring only. It assumes headcount stays flat and says nothing about growth, and it produces no cost per hire.
Run it at the industry rate and the shape of the problem is obvious. Sixty people at 66.0% is about forty separations a year, which is more than three replacements every month, in an operation that probably interviews on the same afternoon it advertises. That cadence, not the percentage, is what a recruiting plan has to be built around.
What restaurant recruiting costs, and what we cannot tell you
Our benchmark does not break restaurants out as a role family or a sector, so there is no restaurant cost per applicant on this page. Publishing one would mean borrowing a number from an adjacent category and putting a restaurant label on it, and that is the sort of thing this page exists to argue against. What a restaurant hire actually costs, line by line, is worked through separately on cost per hire in restaurants.
What the benchmark does measure, and what applies directly to replacement hiring at this cadence, is campaign structure.
| Structure | Median cost per applicant | Apply rate | Click-through |
|---|---|---|---|
| Event-driven, a dated hiring event | $8.02 | 21% | 1.53% |
| Multi-role always-on | $9.83 | 12% | 1.10% |
| Single-role | $14.45 | 18% | 1.36% |
Source: Boostpoint 2026 Social Job Advertising Benchmark — 891 Boostpoint-managed campaigns on Meta (1,334 campaign-months), 2026; advertising costs only. Cost per applicant is not cost per hire, and nothing on this page derives one from the other.
A dated hiring event returns applicants at $8.02 against $14.45 for advertising one role at a time, a difference of $6.43. For an operation replacing three or four people a month across a handful of stores, that is the single largest structural lever available, and it happens to fit the way restaurants already hire: in batches, on a day, with interviews on the spot. The structure and the numbers behind it are set out on mass hiring.
Median hourly pay for food and beverage serving and related workers was $15.24, or $31,710 a year, in May 2025, the most recent federal occupational data. Set the advertising against the wage bill and it is a small line item. Set it against the turnover it is chasing and it is smaller still, which is the argument for fixing the schedule before increasing the budget.
Setting it against the wage bill is worth doing precisely, and the industry-wide version of that sum is on restaurant labor costs: wages ran 28.9 percent of sales in the first half of 2026, down from 32.3 percent in 2017.
Frequently asked questions
What is the average restaurant turnover rate?
It depends which population you count. The federal survey puts accommodation and food services at 5.5% a month for 2025, which is 66.0% of the workforce across the year, with quits alone at 50.4%. A restaurant-only industry index of hourly employees puts rolling twelve-month turnover at 110% in limited service and about 92% in full service.
Why do some sources say restaurant turnover is over 100%?
Because they are measuring hourly restaurant employees only, on a rolling twelve-month basis, at restaurant brands. A rate above 100% simply means the average position was filled more than once during the year, which is ordinary in a limited-service kitchen. The federal figure is lower because it also counts salaried staff and hotel employees.
Is restaurant turnover getting better or worse?
Much better than 2021, and flat now. Separations across the year fell from 85.2% in 2021 to 64.8% in 2024, then rose slightly to 66.0% in 2025. Quits followed the same path, from 69.6% down to 49.2% and back to 50.4%. The improvement came as the wider labor market cooled, with quits falling across all industries over the same years.
How much of restaurant turnover is voluntary?
Most of it. Of 5.5 points of monthly separations, 4.2 are quits and 1.1 are layoffs and discharges, with roughly 0.2 for retirements, transfers and other separations. Across the year that is 50.4% quitting against 13.2% let go, so the majority of the rate responds to scheduling, pay and the first-shift experience rather than to demand forecasting.
Is restaurant turnover higher than retail?
Yes, and by a wide margin. Retail trade ran 3.8% a month in 2025, or 45.6% across the year, with quits at 31.2%. Accommodation and food services ran 66.0% and 50.4% on the same basis. Restaurants also hire at a higher rate every month, which is what keeps the two figures roughly in balance.
What is a good turnover rate for a restaurant?
There is no published threshold and any single number offered as one has been invented. The defensible test is your hourly staff against the hourly restaurant index for your service model, your total payroll against the federal industry line, and your quits separated from your terminations before you draw any conclusion at all.
How many people will I have to hire in a year?
At the industry rate, about two thirds of your headcount, and the number that matters is the monthly version of it. Sixty people at 66.0% is roughly forty separations a year, or a little over three a month, every month. Planning for that cadence rather than for individual openings is what separates operations that keep up from operations that run short.
Are agency and contract staff counted?
No. The federal survey excludes employees of temporary help agencies, employee leasing companies, outside contractors and consultants, as well as transfers within the same location and employees on strike. If your internal number includes agency conversions or moves between your own stores, part of any gap from the published rate is definitional rather than real.
Hire for the month, not the opening
A rate this high is a standing hiring requirement, and the operations that keep up treat it as one. Keeping that pipeline full is the part we measure.
Federal turnover figures: U.S. Bureau of Labor Statistics, Job Openings and Labor Turnover Survey, annual average rates by industry, not seasonally adjusted, 2021 to 2025, read August 29, 2026 — accommodation and food services total separations 7.1%, 7.0%, 6.3%, 5.4% and 5.5% and quits 5.8%, 5.8%, 5.0%, 4.1% and 4.2% across those five years, layoffs and discharges 1.1% and hires 5.5% in 2025; leisure and hospitality 5.6% and 3.9%; arts, entertainment and recreation 6.1% and 2.2%; retail trade 3.8% and 2.6%; all industries 3.3% and 2.0%. Published rates are average monthly figures; every across-the-year figure on this page is the published rate multiplied by twelve, which follows from the survey's definition of the annual average rate as summed monthly levels over summed monthly employment. BLS does not publish the figures in that form and the multiplication is ours, shown throughout so it can be checked. Separations definitions, including the exclusion of transfers within the same location, employees on strike, and employees of temporary help agencies, employee leasing companies, outside contractors and consultants, are quoted from the same survey's technical note. Industry index figures: Black Box Intelligence, State of the Restaurant Workforce, published October 29, 2025 and read August 31, 2026 — rolling twelve-month hourly turnover of 110% in limited service in the third quarter of 2025 against 133% in 2019, about 92% in full service across the first three quarters of 2025 against 101% in 2019, limited-service management turnover of roughly 44% to 47% through 2024 and 2025, and full-service management turnover of 41% in the third quarter of 2024 improving to 35% a year later. Wage figure: U.S. Bureau of Labor Statistics, Occupational Outlook Handbook (Occupational Employment and Wage Statistics data), food and beverage serving and related workers, median $15.24 an hour and $31,710 a year, May 2025, read October 5, 2026. Advertising figures: Boostpoint 2026 Social Job Advertising Benchmark — 891 Boostpoint-managed campaigns on Meta across 1,334 campaign-months in 2026, advertising costs only; event-driven median $8.02 at a 21% apply rate and 1.53% click-through, multi-role always-on $9.83 at 12% and 1.10%, single-role $14.45 at 18% and 1.36%. The benchmark does not publish a restaurant role family or sector and no restaurant cost per applicant is stated anywhere on this page. Cost per applicant is not cost per hire, and no cost per hire is derived from it anywhere on this page. Replacement-hiring figures produced by the calculators are arithmetic on a rate and a headcount you supply, not measured values. Last updated October 5, 2026.