
Employee Turnover Rates by Industry
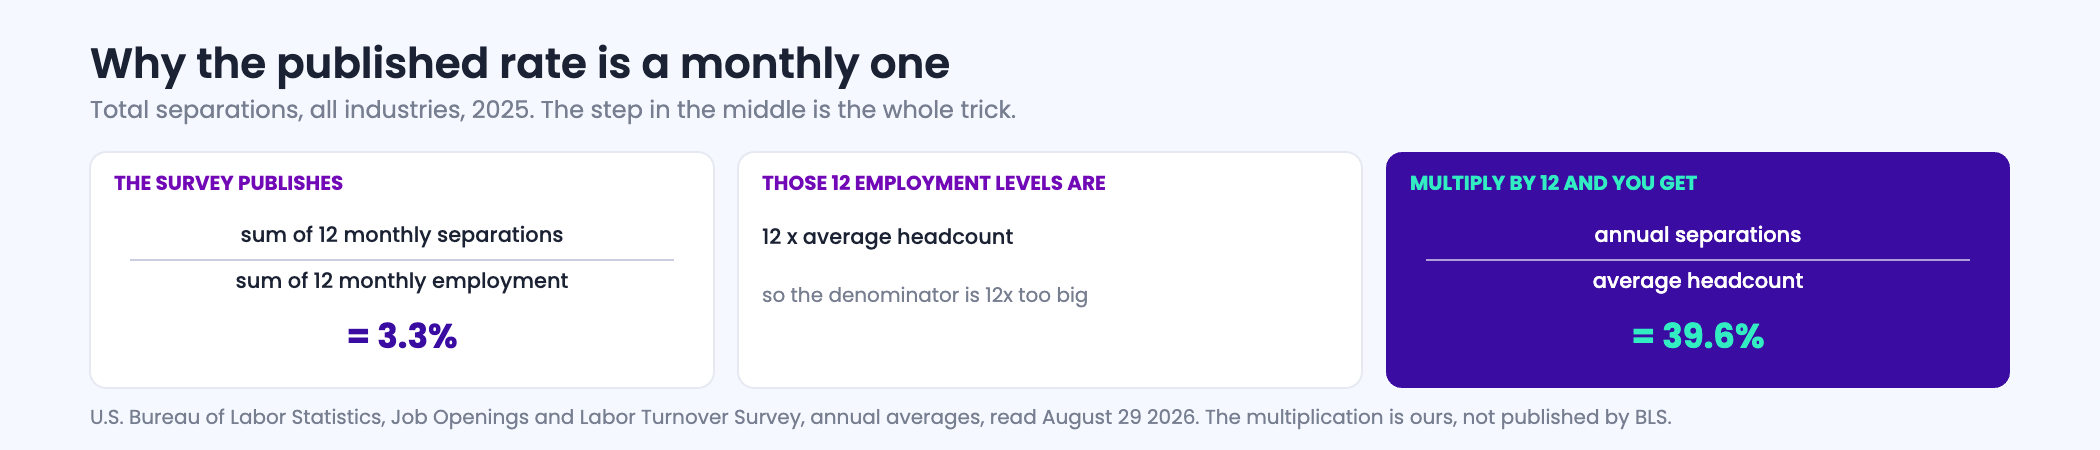
In 2025 the all-industry total separations rate was 3.3% as the federal survey publishes it — which is an average monthly rate, and works out at 39.6% of the workforce across the year. Accommodation and food services ran 66.0% across the year, manufacturing 28.8%, government 18.0%. Before you compare your own number to any of these, check which of the two forms you are holding, because most published benchmarks never say.
The one thing to settle before reading any of these numbers
The Job Openings and Labor Turnover Survey defines its annual average total separations rate as the sum of the twelve monthly separations levels as a percent of the sum of the twelve monthly employment levels. Those twelve monthly employment levels add up to twelve times average headcount, so the published figure is annual separations divided by twelve times average employment. It is an average monthly rate carrying an annual label, and multiplying it by twelve gives the share of a workforce that separated across the year.
That multiplication is exact rather than an estimate; it falls straight out of the definition. It also explains why a company with 40% annual turnover keeps being told the national rate is 3.3%. Both numbers are right. They are measuring different things, and every table on this page therefore shows both.
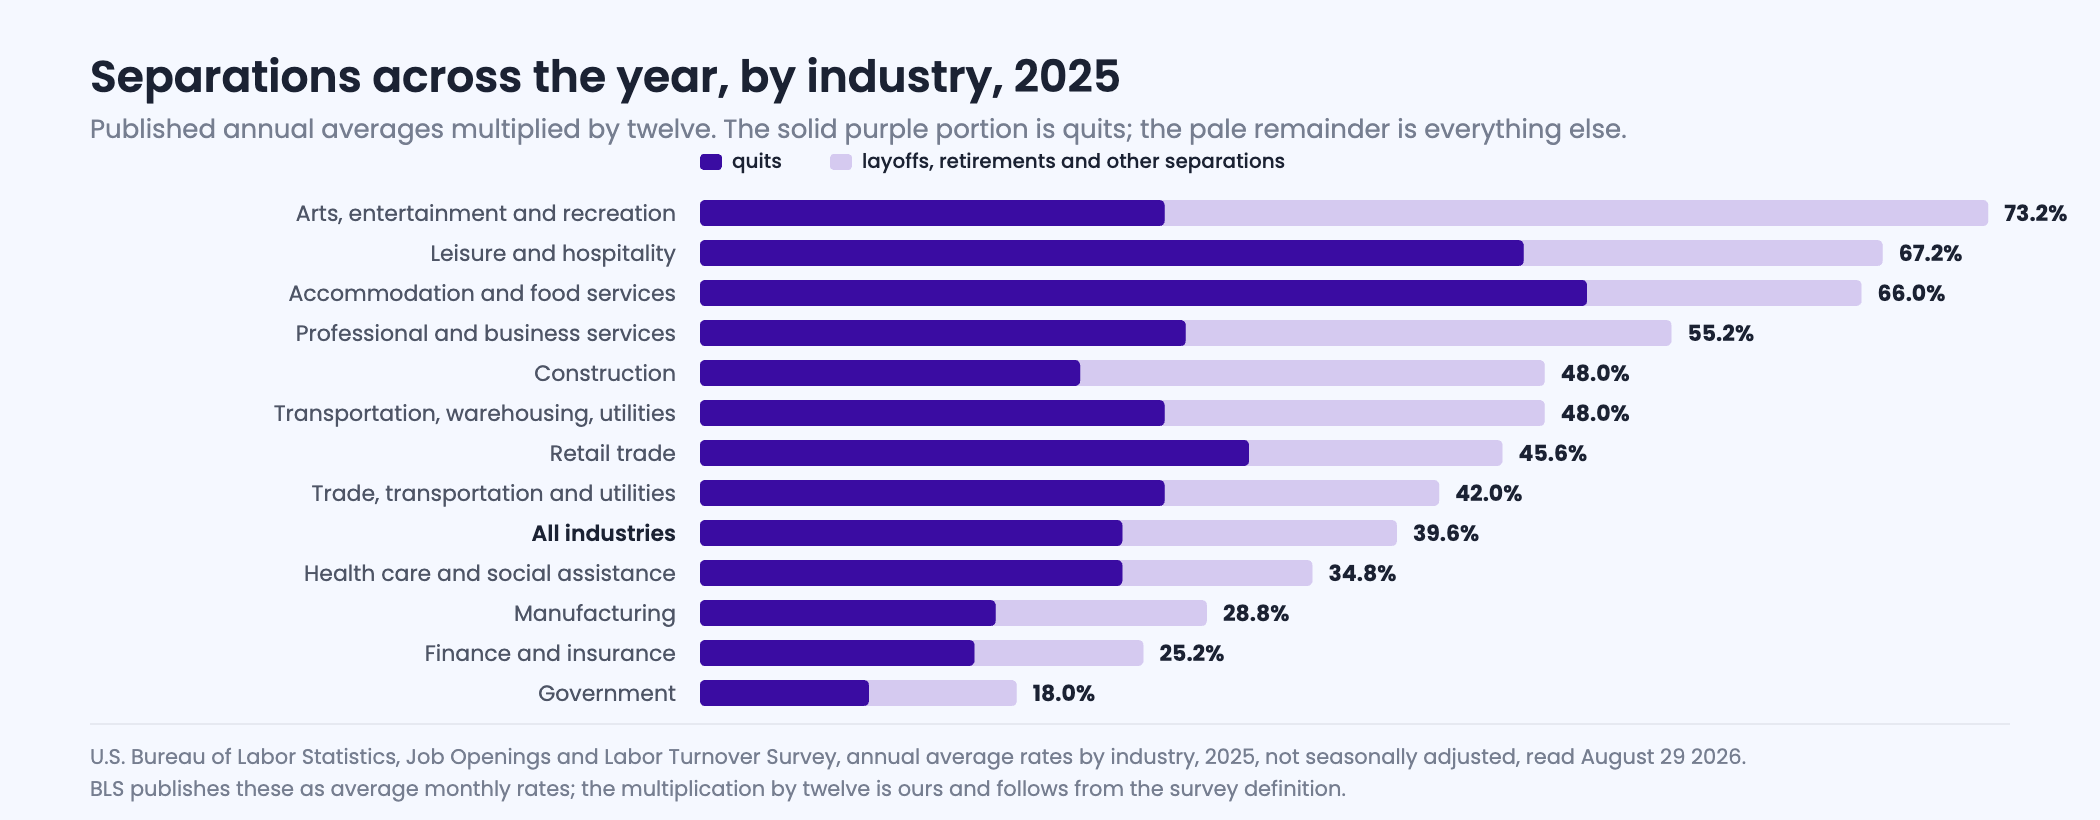
Total separations by industry, 2025
Total separations counts everyone who came off the payroll: quits, layoffs and discharges, and other separations such as retirements, transfers to another location, disability separations and deaths.
| Industry | As published | Across the year | 2021, across the year |
|---|---|---|---|
| Total, all industries | 3.3% | 39.6% | 46.8% |
| Total private | 3.6% | 43.2% | 52.8% |
| Arts, entertainment and recreation | 6.1% | 73.2% | 79.2% |
| Leisure and hospitality | 5.6% | 67.2% | 84.0% |
| Accommodation and food services | 5.5% | 66.0% | 85.2% |
| Professional and business services | 4.6% | 55.2% | 64.8% |
| Construction | 4.0% | 48.0% | 56.4% |
| Transportation, warehousing and utilities | 4.0% | 48.0% | 48.0% |
| Retail trade | 3.8% | 45.6% | 64.8% |
| Trade, transportation and utilities | 3.5% | 42.0% | 54.0% |
| Mining and logging | 3.3% | 39.6% | 37.2% |
| Other services | 3.3% | 39.6% | 44.4% |
| Health care and social assistance | 2.9% | 34.8% | 39.6% |
| Information | 2.8% | 33.6% | 37.2% |
| Private education and health services | 2.8% | 33.6% | 37.2% |
| Nondurable goods manufacturing | 2.7% | 32.4% | 48.0% |
| Real estate, rental and leasing | 2.6% | 31.2% | 36.0% |
| Manufacturing | 2.4% | 28.8% | 40.8% |
| Durable goods manufacturing | 2.3% | 27.6% | 36.0% |
| Wholesale trade | 2.3% | 27.6% | 33.6% |
| Financial activities | 2.3% | 27.6% | 28.8% |
| Private educational services | 2.2% | 26.4% | 25.2% |
| Finance and insurance | 2.1% | 25.2% | 26.4% |
| Federal government | 1.8% | 21.6% | 19.2% |
| Government | 1.5% | 18.0% | 18.0% |
| State and local government | 1.4% | 16.8% | 18.0% |
Source: U.S. Bureau of Labor Statistics, Job Openings and Labor Turnover Survey, annual average total separations rates by industry, not seasonally adjusted, read August 29 2026. The first column is as published. The across-the-year columns are that figure multiplied by twelve, which follows exactly from the survey's definition of the annual average rate; BLS does not publish them in that form.
Quits, layoffs and hires, side by side
A separations rate on its own hides the thing you most want to know, which is whether people are leaving or being let go. That same distinction sets the payroll deadline in 21 states, which is the subject of final paycheck laws by state. Arts, entertainment and recreation has the highest separations rate of any industry and one of the lower quit rates, because so much of its churn is employer-initiated. Accommodation and food services is the reverse: almost everything in the number is voluntary.
One industry at a time
Pick an industry
All four measures for 2025, in both forms, with the change since 2021.
Published figures are average monthly rates. Across-the-year figures are those multiplied by twelve.
The whole table, sortable
Click a column to sort. Everything here is the 2025 annual average expressed across the year, so the columns are directly comparable to one another and to a full year of your own data.
Sort it your way
Every industry, every measure
Separations, quits, layoffs and discharges, and hires — all across the year, 2025.
A hires rate above the separations rate means the industry grew; below it means it shrank. Both are shares of employment across the year.
What changed between 2021 and 2025
The direction is consistent and it is worth stating plainly: turnover has fallen almost everywhere. Across all industries, separations fell from 46.8% of the workforce in 2021 to 39.6% in 2025, and quits fell from 32.4% to 24.0%. The largest fall of any sector was accommodation and food services, down from 85.2% to 66.0%. That sector has its own page, because the restaurant-only indexes read about twice as high: see restaurant turnover rate.
The exceptions are informative. Mining and logging, private educational services and federal government all show a higher separations rate in 2025 than in 2021, and in the federal case the quits rate is the only one in the series that has returned to its 2021 level after falling in between. Everywhere else, fewer people are leaving and fewer are being hired at the same time, which is what a cooling labor market looks like from an employer's side.
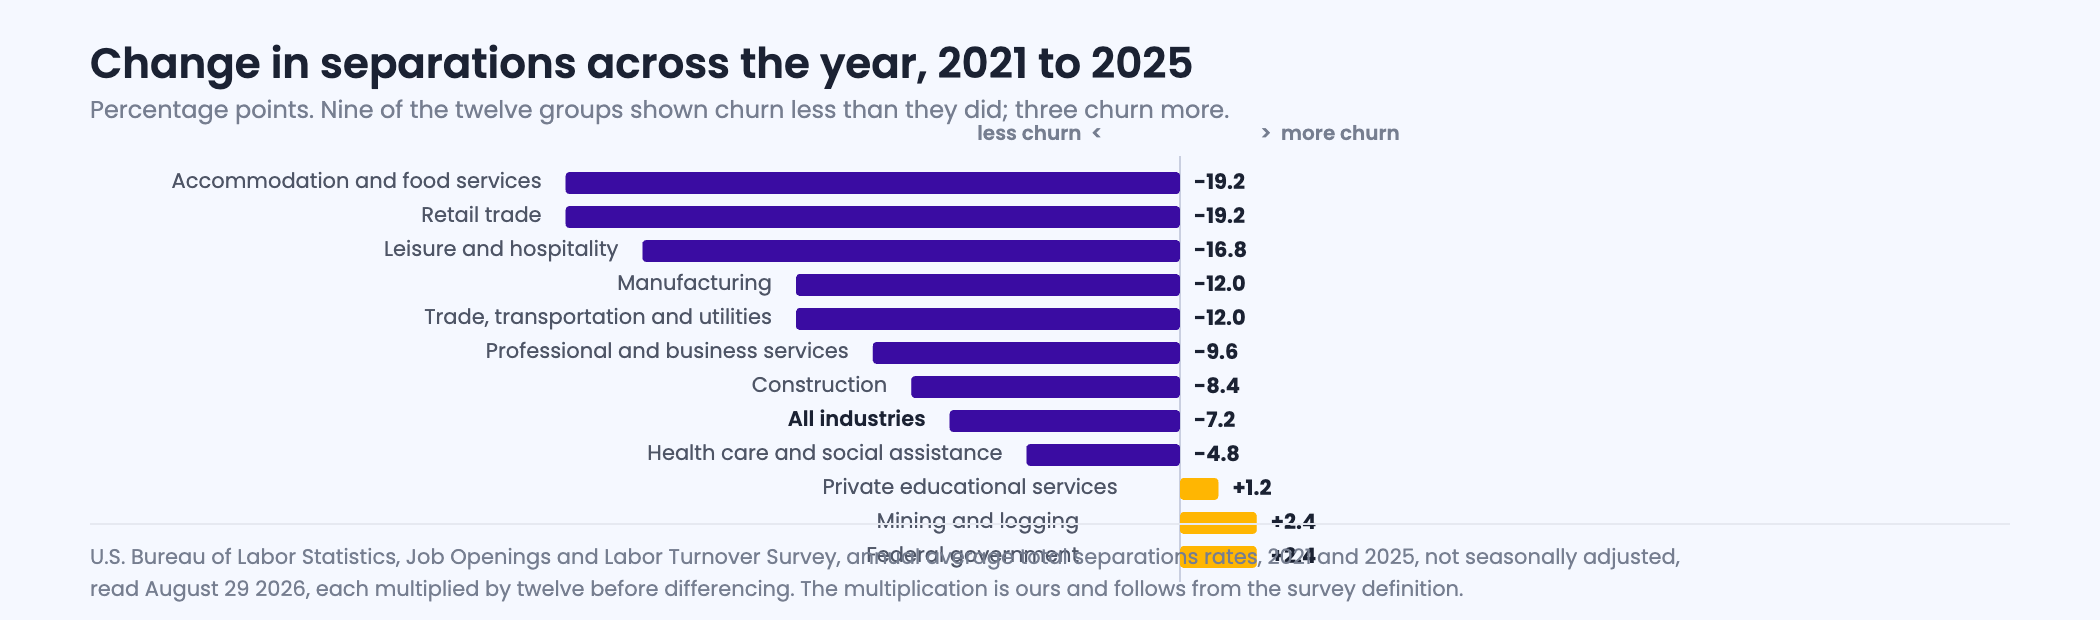
Almost every industry churns less than it did in 2021. If your own number has not moved, the gap between you and your industry has widened without anything at your company getting worse.
Some sectors are missing from this table entirely. There is no row for call centers, contact centers or administrative and support services, which is why the figures quoted for that work are unsourced — call center employee turnover works through what the published sectors can and cannot bracket.
What counts as high
The honest answer is that it depends on which industry line you sit under, and that most of the thresholds circulating online have no source. Rather than inventing one, three practical tests are worth more than a number, and what to do once you have applied them is set out on employee retention strategies.
- Compare against your own industry, not the all-industry line. A 45% annual separations rate is below average in retail and roughly 60% above average in manufacturing.
- Split voluntary from involuntary before you conclude anything. If most of your number is layoffs and discharges, it is a workforce planning result rather than a retention failure, and the fixes are different.
- Look at when in the relationship people leave. Two companies with identical annual rates can have completely different problems depending on whether departures cluster in the first ninety days or after two years.
The mechanics of computing your own figure, including which separations to count and which the federal survey excludes, are on the turnover rate calculator. What the departures cost is a separate calculation again, on the turnover cost calculator, and the two should not be combined into one headline number. Health care is the clearest example, because the hospital nursing figure and the sector figure describe different populations entirely, which is worked through on nurse turnover rate.
Retail is the sector where the published figure and the quoted figure have drifted furthest apart: most articles still say 60%, which was true in 2022 and is now four years stale. Retail employee turnover works through that gap year by year and splits the current rate into quits and everything else, and employee turnover in hospitality does the same for the sector at the other end of this table.
What these rates mean for hiring volume
Read across the year, these rates are a replacement workload. An employer of 200 people in accommodation and food services is looking at roughly 132 separations a year at the industry line; the same employer in manufacturing is looking at about 58. That difference, more than anything about the job itself, is why frontline hiring in some sectors feels like a permanent campaign and in others like an occasional project.
What it costs to keep that pipeline full is the part we measure. Across 891 Boostpoint-managed campaigns on Meta, the median campaign paid $13.88 for a completed application while the volume-weighted average was $8.02 — and the cheapest tenth of campaigns paid $2.91. The gap between those figures is mostly tuning rather than luck.
| Point in the distribution | Cost per applicant |
|---|---|
| Cheapest 10% of campaigns | $2.91 |
| Lower quartile | $6.48 |
| Median campaign | $13.88 |
| Upper quartile | $29.74 |
| Volume-weighted average | $8.02 |
Source: Boostpoint 2026 Social Job Advertising Benchmark — 891 Boostpoint-managed campaigns on Meta (1,334 campaign-months), 2026; advertising costs only. Cost per applicant is not cost per hire, and nothing on this page derives one from the other.
A turnover rate on its own does not tell you whether you are short-staffed. Understaffing puts it next to your coverage gap and your overtime share, which is where the answer actually is.
Frequently asked questions
What is the average employee turnover rate by industry?
For 2025 the federal annual averages were 3.3% for all industries, 5.5% in accommodation and food services, 4.6% in professional and business services, 4.0% in construction and in transportation and warehousing, 3.8% in retail, 2.9% in health care and social assistance, 2.4% in manufacturing and 1.5% in government. Those are average monthly rates; across the year they are 39.6%, 66.0%, 55.2%, 48.0%, 45.6%, 34.8%, 28.8% and 18.0%.
Which industry has the highest turnover rate?
Among the major industry groups published, arts, entertainment and recreation has the highest total separations rate at 6.1% a month, or 73.2% across the year, driven heavily by layoffs and discharges rather than quits. Accommodation and food services is close behind at 5.5% a month or 66.0% across the year, and there almost all of the churn is voluntary.
Which industry has the lowest turnover?
State and local government, at 1.4% a month or 16.8% across the year, followed by government overall at 1.5% and 18.0%. Among private industries, finance and insurance is lowest at 2.1% a month or 25.2% across the year.
Is the published turnover rate monthly or annual?
It is an average monthly rate, despite being labeled an annual average. The survey computes it as the sum of the twelve monthly separations levels over the sum of the twelve monthly employment levels, and multiplying it by twelve gives the share of the workforce that separated across the year. This is the single most common source of confusion when comparing a company figure to a published one.
Has turnover gone down since 2021?
In almost every industry, yes. All-industry separations fell from 46.8% of the workforce across 2021 to 39.6% across 2025, and quits from 32.4% to 24.0%. Accommodation and food services fell furthest, from 85.2% to 66.0%. Mining and logging, private educational services and federal government are the exceptions in the other direction.
What is the difference between the separations rate and the quit rate?
Quits are voluntary departures, excluding retirements and transfers to other locations. Total separations adds layoffs and discharges, which are employer-initiated and include terminations of seasonal employees, plus other separations such as retirements, transfers, disability separations and deaths. Comparing a mixed internal number against a published quits rate is the second most common comparison error.
Are temporary staff included in these rates?
No. Employees of temporary help agencies, employee leasing companies, outside contractors and consultants are excluded from the survey's separations measures, as are transfers within the same location and employees on strike. If your internal number includes any of those, part of the difference from a published rate is definitional rather than real.
What is a good turnover rate for my industry?
There is no published threshold, and any single number offered as one has been invented. The defensible approach is to compare against your own industry line across a full year, split voluntary from involuntary before drawing conclusions, and look at when in the employment relationship departures cluster rather than at the annual total alone.
Turnover rates are the input to a staffing forecast, not the output. If you are turning these numbers into headcount, our hiring plan template takes a turnover rate and a target headcount and returns how many people you need to hire, and by when.
When the industry rate is your hiring plan
Separations across the year are a replacement workload before they are anything else. Keeping that pipeline full is the part we measure.





All turnover figures: U.S. Bureau of Labor Statistics, Job Openings and Labor Turnover Survey, annual average rates by industry, not seasonally adjusted, for 2021 and 2025, read August 29 2026, covering total separations, quits, layoffs and discharges, and hires. Published rates are average monthly figures; every across-the-year figure on this page is the published rate multiplied by twelve, which follows exactly from the survey's definition of the annual average rate as summed monthly levels over summed monthly employment. BLS does not publish the figures in that form and the multiplication is ours, shown throughout so it can be checked. Separations definitions, including the exclusion of transfers within the same location, employees on strike, and employees of temporary help agencies, employee leasing companies, outside contractors and consultants, are quoted from the same survey's technical note. Advertising figures: Boostpoint 2026 Social Job Advertising Benchmark — 891 Boostpoint-managed campaigns on Meta across 1,334 campaign-months in 2026, advertising costs only; $2.91 at the cheapest decile, $6.48 lower quartile, $13.88 median, $29.74 upper quartile, $8.02 volume-weighted. Cost per applicant is not cost per hire, and no cost per hire is derived from it anywhere on this page. The replacement-workload examples are arithmetic from the published industry rates and a stated headcount, not measured values. Last updated August 2026.