
Employer guideUpdated September 2026
Call Center Employee Turnover: There Is No Official Number
Every article on this subject tells you call center turnover runs at 30% to 45%. None of them says where that came from, because there is no primary source to point at. The Bureau of Labor Statistics does not publish a call center turnover rate — its industry table has twenty-seven rows and not one of them is call centers, contact centers, or even administrative and support services. This page shows what the federal data can and cannot bracket, and gives you the calculation to produce a number you can actually defend.
Where "30 to 45%" actually comes from
Search the term and the same band comes back from almost every result on the first page. One contact-center software vendor says the average annual attrition rate ranges between 30 and 45%. A second says the rate averages between 30 and 45% annually. A third repeats 30 to 45% per year. A fourth widens it to somewhere between 15% and 45%. A fifth puts it at 40 to 45%, rising to 55 to 60% in high-stress sectors.
Follow any of those citations back and the trail stops. There is no survey, no sample size, no methodology and no year attached to the original. The figure has the shape of a statistic without the provenance of one, and it has been passed between vendor blogs long enough to look official.
Why this matters more than it sounds
An unsourced band that wide is not a benchmark, it is permission. At 30% you are doing well; at 45% you are still "in range". A number that cannot be wrong cannot tell you anything, and a contact center measuring itself against it will never learn whether its own churn is good, bad or catastrophic.
What the federal data can and cannot tell you
BLS runs the Job Openings and Labor Turnover Survey, and its annual industry table is the closest thing to an authoritative source. It publishes twenty-seven industry rows. Call centers are not one of them, and neither is administrative and support services, the category contact centers actually sit inside. The nearest published line is professional and business services — a supersector that also contains law firms, accounting firms and engineering consultancies, whose staff do not turn over anything like a phone queue does.
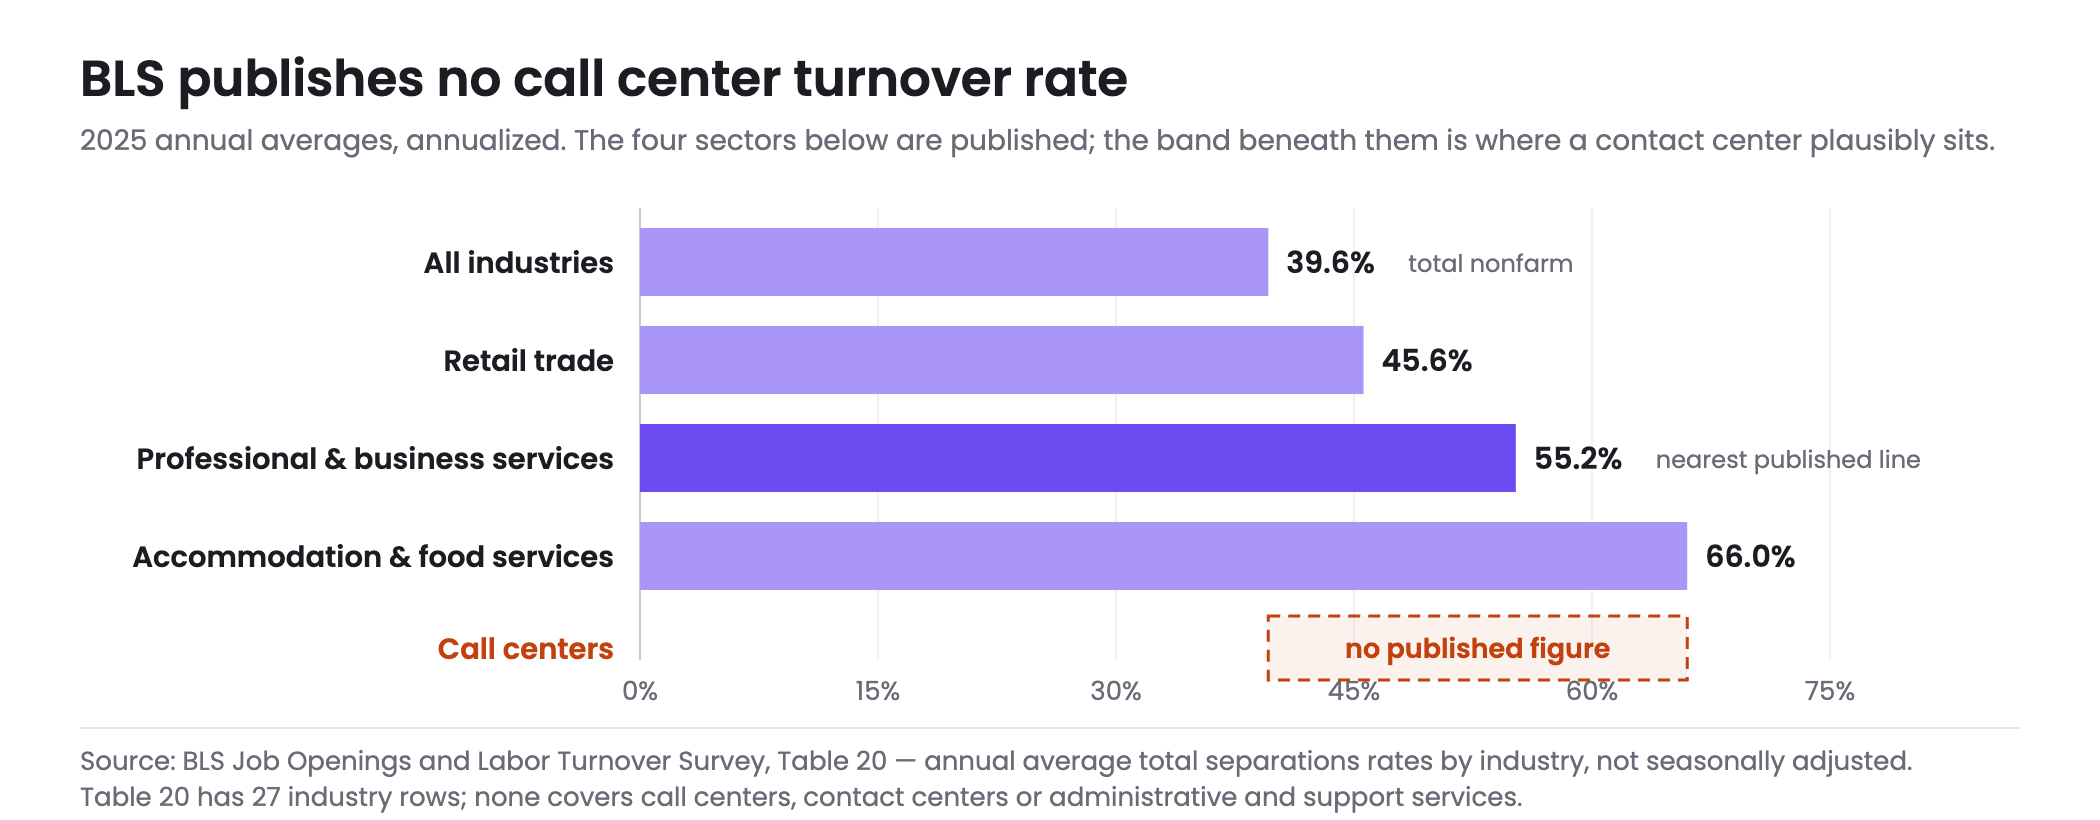
| Published sector | 2025, across the year | Can it stand in for a call center? |
|---|---|---|
| All industries | 39.6% | No — the economy-wide floor, well below any frontline role |
| Retail trade | 45.6% | Partly — comparable hourly, customer-facing work |
| Professional and business services | 55.2% | The nearest published line, but it blends in salaried professional roles |
| Accommodation and food services | 66.0% | Partly — comparable shift-based churn, different work |
| Call centers | not published | — |
So the honest statement is a bracket, not a number: a contact center is a frontline, hourly, shift-based operation, which puts it above the all-industry 39.6% and plausibly in the same territory as retail and hospitality. Anyone who gives you a precise call center figure is estimating, including us. What we will not do is dress the estimate up as a published statistic.
The only number you can defend is your own
Since there is nothing credible to compare against, the useful move is to calculate your own properly and track it against itself. The two choices that change the answer most are which separations you count and how you annualize a partial period.
Build a defensible turnover rate
The rate matters less than the seats
A contact center has a second problem that a store does not: a new agent cannot take calls on day one. The seat is empty while you recruit, and then it is occupied by someone still in training. Both count against coverage, and only the first one shows up in a vacancy report.
Seats not taking calls
What a call center applicant costs, on our own data
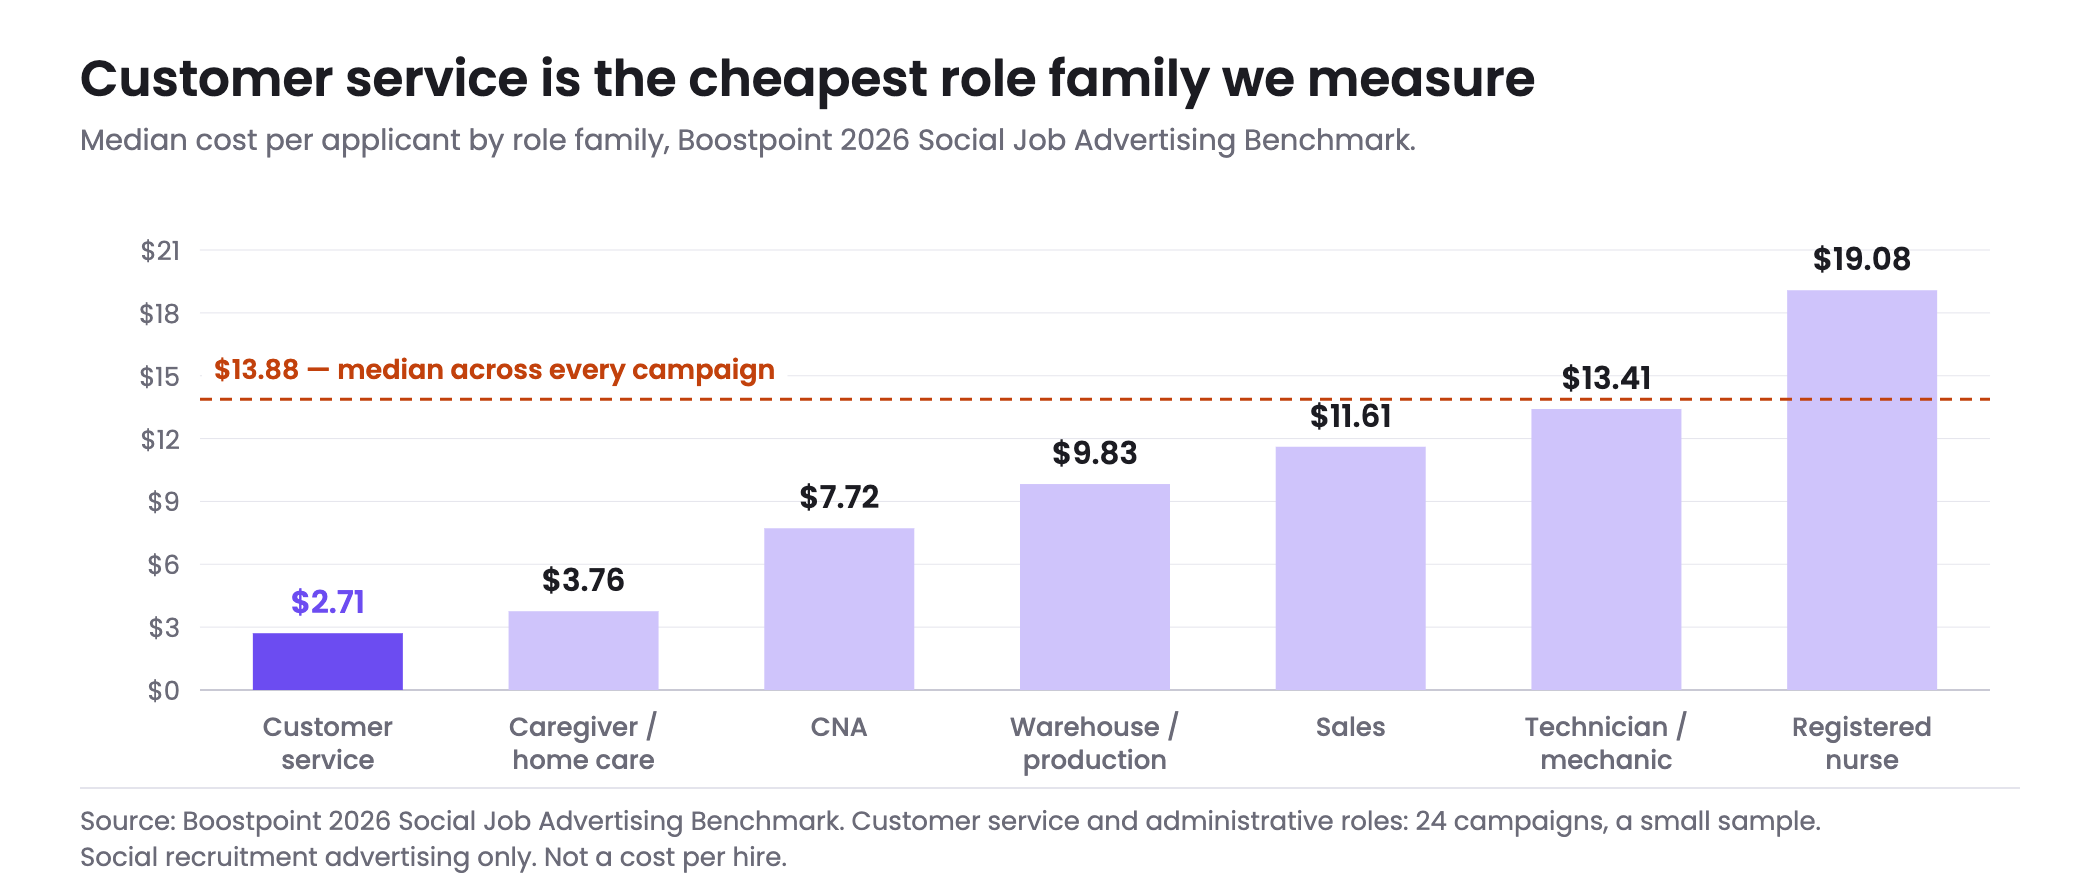
This is our measurement rather than anyone's benchmark, and it covers social recruitment advertising only. Customer service and administrative roles are the cheapest family we measure, by a wide margin.
| Measure | Customer service / admin | All campaigns |
|---|---|---|
| Median cost per applicant | $2.71 | $13.88 |
| Middle 50% | $2.14 – $7.47 | — |
| Apply rate | 25% | — |
| Click-through rate | 1.77% | — |
| Campaigns measured | 24 | — |
At a $2.71 median the applicants cost about a fifth of the all-campaign median of $13.88, and the apply rate of 25% is among the highest we record. That combination is why the advertising side of a contact center problem is rarely the expensive part. It is also why we are careful about what we claim next.
Three numbers worth more than the industry average
If the sector figure cannot be sourced, the alternative is not to give up on measurement. It is to track the three things that actually change what your floor can do, each of which you already have the data for.
- Annualized separations, scope fixed in writing. The rate itself, calculated the same way every quarter. Its value is not the level — you have nothing to compare the level against — it is the direction. A rate that moved from 38% to 47% over three quarters tells you something true regardless of what the industry average is.
- Seats not taking calls, empty and training counted together. The number above. This is the one that shows up in average speed of answer and in the pressure on the agents who stayed, and it is the only one of the three that recruiting can move directly.
- Share of separations inside the first ninety days. Early attrition and late attrition have almost nothing in common. Someone leaving in week three usually means the job was described differently than it turned out to be, or the training was compressed. Someone leaving in month fourteen usually means the job is what it is. The first is partly a hiring problem; the second is not.
We publish no benchmark for that third number and will not supply one, in this sector or any other — it varies too much by queue type, shift pattern and how the ramp is run. But it is the number most likely to change what you do next, and it costs nothing to start counting.
What we cannot tell you
- We cannot give you a call center turnover benchmark. No credible one exists. We could publish an estimate and it would rank, but it would be the sixth unsourced number in a field that already has five.
- Twenty-four campaigns is a small sample. The $2.71 median is real and it is ours, but it is not the population figure for an industry and we are not going to present it as one.
- Cheap applicants do not fix an attrition problem. If agents leave in month three because of the queue, the monitoring or the schedule, cheaper sourcing refills the same seat more often and slightly faster. That is worth money, and it is not the same as solving it.
Where this leaves a contact center operator: measure your own rate properly, track the seats rather than the percentage, and treat sourcing as the cheap lever it genuinely is here. For the hiring side — what works in the ad, which structures fill seats fastest — see call center recruiting. For how the same reconciliation works in sectors BLS does publish, see retail employee turnover and employee turnover rates by industry.
Frequently asked questions
What is the average call center turnover rate?
There is no authoritative figure. The Bureau of Labor Statistics does not publish a turnover rate for call centers, contact centers or administrative and support services; its industry table has twenty-seven rows and none of them covers this work. The widely quoted 30% to 45% band circulates without a primary source. The defensible statement is a bracket: a contact center is frontline hourly work, so it sits above the all-industry rate of 39.6% and plausibly near retail's 45.6% or accommodation and food services' 66.0%.
Why do so many sources say 30 to 45%?
Because they are quoting each other. The band appears on contact-center software vendor blogs and workforce-management sites, each presenting it as an industry average, and following the citations back does not reach a survey, a sample or a methodology. It has been repeated long enough to acquire the appearance of an official statistic without ever having been one.
Does BLS publish call center turnover data?
No. The Job Openings and Labor Turnover Survey publishes total separations by industry at supersector level, and the nearest line to a contact center is professional and business services, which ran 4.6% of employment per month in 2025, or 55.2% across the year. That supersector also contains law firms, accounting firms and engineering consultancies, so it is a poor proxy for a phone queue and should not be quoted as a call center figure.
How should I calculate my own call center turnover rate?
Divide separations in the period by average headcount over that period, then multiply by 100. If the period is shorter than a year, annualize by multiplying by twelve divided by the number of months. Decide once whether you are counting all separations or voluntary quits only, write the decision down, and never change it mid-comparison. Most disagreements about turnover figures are disagreements about the denominator and the scope rather than the arithmetic.
Should I count agents who leave during training?
That is a scope decision, and the important part is making it consistently. Counting them raises the rate and better reflects what the operation actually experiences, since a seat vacated in week two costs the recruiting and the training with nothing returned. Excluding them makes the number more comparable to published sector rates, which are based on payroll separations. Whichever you choose, apply it to every period you compare.
How many seats are empty at a given turnover rate?
Roughly separations per week multiplied by weeks to fill, plus the seats occupied by agents still in training. On a hundred-seat operation at 40% turnover with a three-week fill and four weeks of training, that is a little over two seats waiting to be filled (40 a year ÷ 52 × 3 weeks ≈ 2.3, as the calculator shows) and roughly three more not yet taking calls at full productivity. The training half is the part vacancy reports usually miss.
What does it cost to attract a call center applicant?
In our own benchmark the customer service and administrative role family had a median cost per applicant of $2.71, with the middle 50% of campaigns between $2.14 and $7.47 and an apply rate of 25%. That is the cheapest family we measure, against an all-campaign median of $13.88. The sample is twenty-four campaigns, which is small, and it covers social recruitment advertising only.
Will better recruiting reduce call center attrition?
Not the rate itself, and we would rather say so. Recruiting determines how fast and how cheaply a seat refills, not whether the person in it stays. Attrition in this work is driven by the queue, the monitoring, the schedule and the pay. What better sourcing does buy you is a shorter empty-seat window, which in an operation refilling continuously is a real and recurring saving rather than a one-time one.
Refill the seat before the schedule notices
Bring your seat count and your average time to fill. We will show you what customer service campaigns cost across the benchmark, and what your empty-and-training seat count above translates to in applicants a month.
Book a Demo