Employer guideUpdated October 5, 2026
Retail Employee Turnover: What the Number Actually Is in 2026
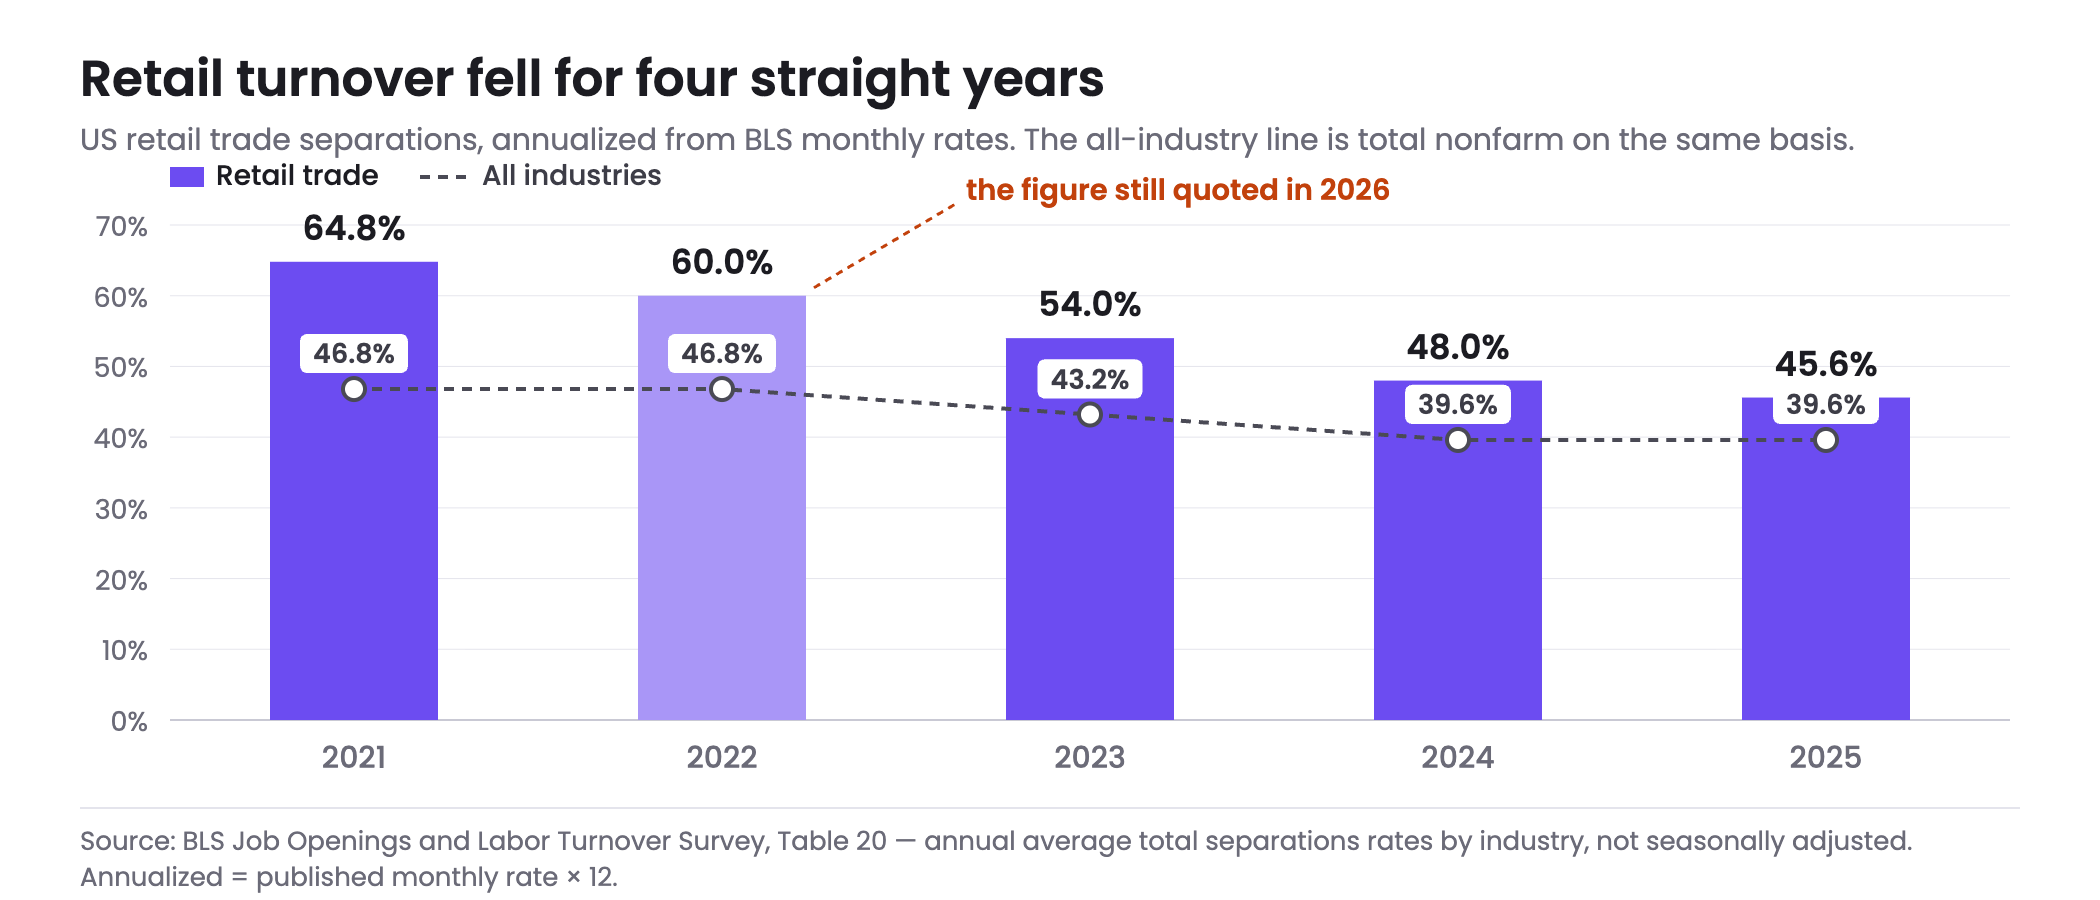
Retail turnover in the United States was 45.6% across 2025 — the Bureau of Labor Statistics measured retail trade separations at 3.8% of employment per month, and twelve of those months is 45.6%. The figure almost every article quotes, 60%, is the 2022 number. It has been copied forward for four years while the real rate fell 14.4 points, to 45.6% in 2025. If you are sizing next year's replacement hiring off 60%, you are planning to hire about a third more people than the published data says will leave.
The number everyone quotes is four years old
Search for retail turnover and you will be told, repeatedly and confidently, that it runs at about 60% a year. Many of the pages ranking for this term say some version of it — "around 60%", "over 60% each year", "hovers around 60%", "at least 60 percent for a long time".
They are not making it up. 60.0% is exactly the retail trade figure for 2022. The BLS annual average separations rate for retail that year was 5.0% a month, and 5.0 × 12 = 60.0. An article written in 2022 that said "about 60%" was correct. What happened next is that the sentence got copied, and the copies got copied, and nobody went back to the table.
Here is what the table has done since.
What retail turnover actually is
BLS publishes separations as a monthly rate: the share of employment that left in a month. To get something comparable to the annual figures people quote, you multiply by twelve. Both columns are below so you can see which one you are looking at.
| Year | Retail, as published (monthly) | Retail, across the year | All industries, across the year |
|---|---|---|---|
| 2021 | 5.4% | 64.8% | 46.8% |
| 2022 | 5.0% | 60.0% | 46.8% |
| 2023 | 4.5% | 54.0% | 43.2% |
| 2024 | 4.0% | 48.0% | 39.6% |
| 2025 | 3.8% | 45.6% | 39.6% |
Retail turnover fell in every one of those four years, from 64.8% to 45.6% — 19.2 points, or a 29.6% relative decline. Retail is still well above the all-industry rate of 39.6%, and it is still a high-churn sector. It is not a 60% sector, and it has not been one since 2022.
Three ways this number gets quoted wrong
- The monthly rate read as an annual one. "Retail turnover is 3.8%" is the monthly figure presented as if it were the year. It is off by a factor of twelve, and it is a common error in vendor blog posts that cite BLS directly.
- A peak-year figure quoted as current. 60% is 2022. 64.8% is 2021. Both get presented as today's number, four and five years on.
- Two different BLS bases mixed together. The annual averages above are not seasonally adjusted. The monthly series most people quote from the newest release is seasonally adjusted. They are different tables built on different treatments, and a figure from one does not belong in a sentence with a figure from the other. We keep them separate on this page for that reason.
2026: the fall has stopped
The four-year decline is not still running. On the seasonally adjusted monthly series — a different basis from the annual averages above, so read it on its own — retail separations were 4.5% in March 2026, 3.9% in April, 4.1% in May, 4.3% in June and July, and 4.4% in August (preliminary). Every one of those is at or above the 3.8% that 2025 averaged, and August 2026 is above August 2025's 3.5%.
We are not going to call six months a trend, and one preliminary month is not a turning point. What we will say is the practical version: if you built your 2026 hiring plan on the assumption that retail churn was still falling, the published data has stopped agreeing with you. The honest planning position for the next two quarters is flat to slightly up, not down.
Two out of three retail departures are voluntary
Separations include everyone who left: quits, layoffs, discharges, retirements, transfers. That matters, because the levers are completely different. BLS publishes quits separately, and in retail it is the large majority.
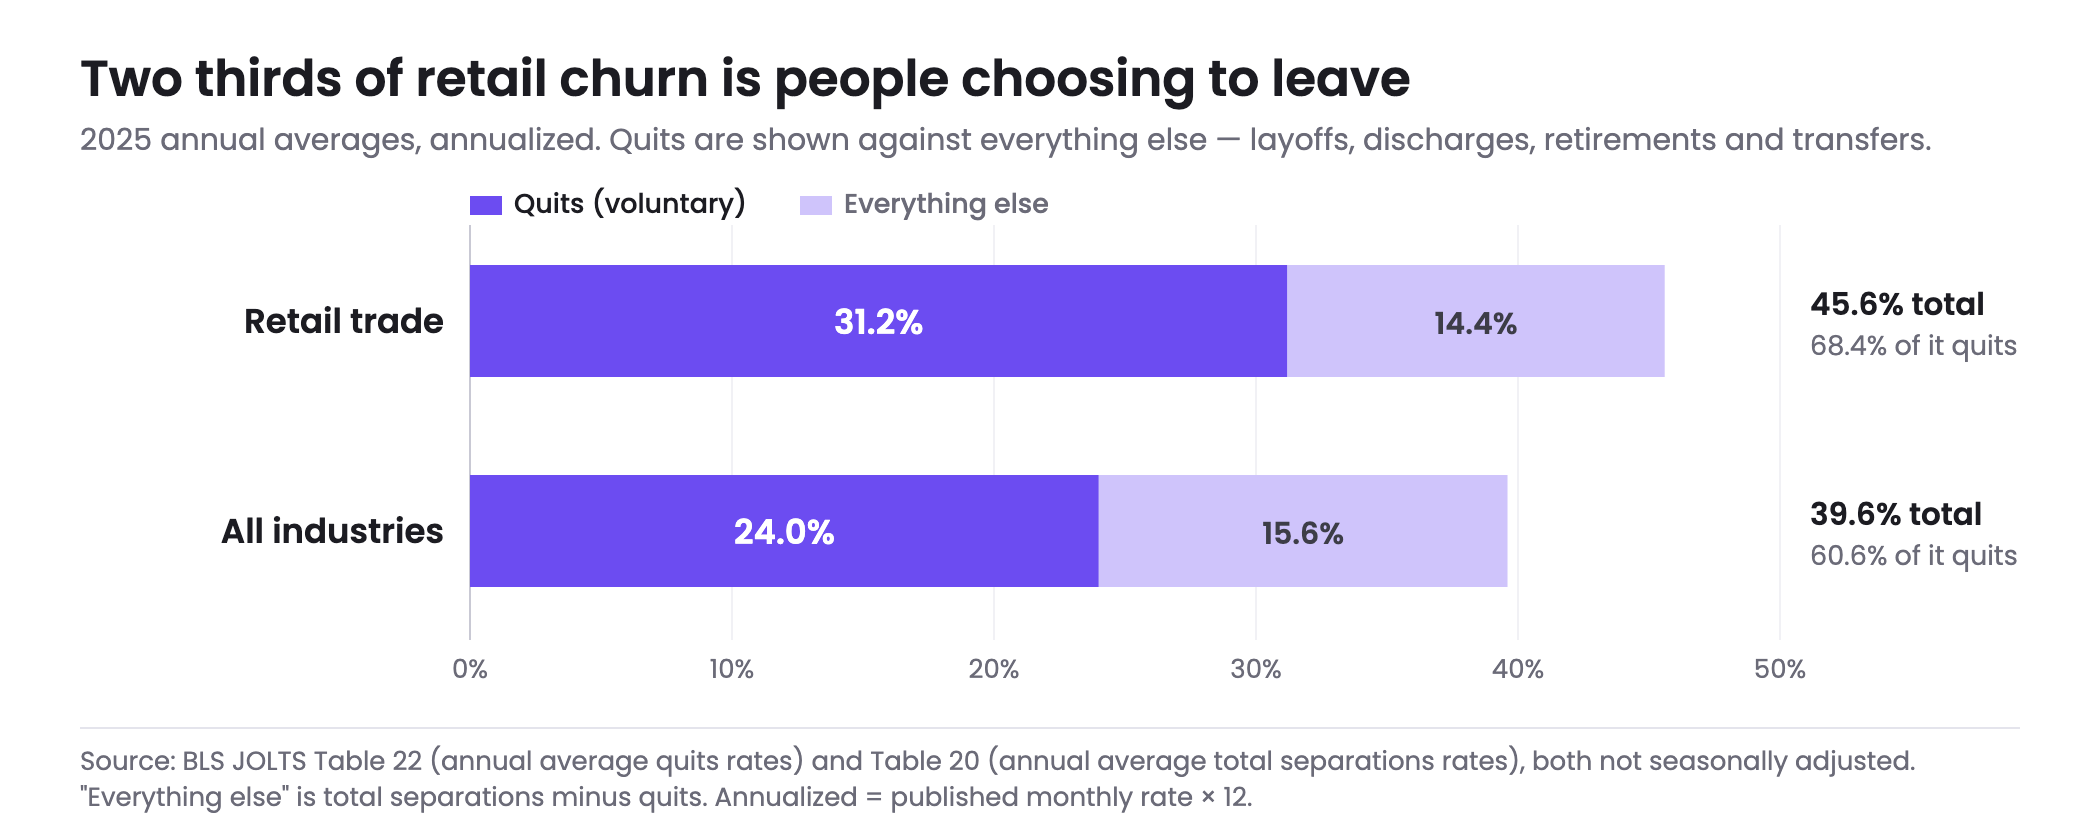
In 2025 retail quits ran at 2.6% a month, or 31.2% across the year. Against total separations of 45.6%, that means quits are 68.4% of all retail departures — against 60.6% across all industries. Retail does not have an unusual layoff problem. It has people choosing to leave, at a higher rate than the economy as a whole.
This is the reframe that matters for what you do on Monday. A layoff-driven separations rate is a business-planning number. A quit-driven one is a job-quality and early-tenure number, and it is the one advertising can only partly reach: better ads put more of the right people at the door, and change nothing at all about what happens to them in week three. What a posting can do is set expectations: the cashier job description puts the shift, the pay and the work beyond the register where an applicant reads them before saying yes.
In a fair workweek city part of that load is priced separately. Changing a posted schedule can trigger predictability pay for each affected employee; our page on predictive scheduling laws by state works through the premiums and the rule that comes before hiring.
What your own churn costs you in hiring load
The reason to get the rate right is that it multiplies. Turnover is not a statistic you report; it is a hiring quota you did not choose. Put your own headcount and rate in and see what it actually commits you to.
Replacement hiring load
What a retail applicant costs, on our own data
Once you know the hires, the next question is what the applicants to support them cost. This is our own measurement, not BLS, and it covers social recruitment advertising only — not job boards, not agencies, not referrals.
| Sector | Median cost per applicant | Middle 50% | Apply rate | Campaign-months |
|---|---|---|---|---|
| Retail / corporate | $8.58 | $3.72 – $17.76 | 26% | 181 |
| Skilled trades & field service | $11.89 | $6.50 – $24.89 | 18% | 335 |
| Transportation & logistics | $13.34 | $5.26 – $25.17 | 13% | 184 |
| Healthcare & senior living | $15.42 | $7.89 – $39.61 | 16% | 553 |
| Behavioral & education | $27.50 | $15.35 – $76.67 | 10% | 81 |
Of the five sectors in this cut, retail is the least expensive and has the highest apply rate, which is the one piece of good news on this page. The middle 50% still spans $3.72 to $17.76 — a 4.8x spread inside a single sector — so the median is a starting assumption, not a quote.
Retail is not the extreme case. In accommodation and food services the same BLS measure runs at 66.0% with a 76.4% voluntary share, and the published figures there disagree with each other far more sharply — employee turnover in hospitality reconciles them.
Retail at least has a published figure to argue about. Call center employee turnover covers the harder case, where BLS publishes nothing for the sector and the number in circulation turns out to have no source behind it at all.
How much of it is actually addressable
Not all churn is available to be fixed, and treating it as if it were is how retention budgets get spent on the wrong third. Split your own number.
Addressable churn split
What we cannot tell you
Three things, stated against our own interest.
- We cannot tell you what your turnover costs in dollars. The replacement-cost multiples in circulation — a third of salary, half of salary, twice salary — are estimates built on assumptions about productivity and management time that nobody measures in a store. We measure advertising. Deriving a cost per hire from advertising data would be inventing most of the number, and we will not do it.
- We cannot tell you that advertising reduces turnover. It does not, directly. Advertising changes who arrives and how fast. If people are leaving in week three because of the schedule or the manager, a better ad delivers more people to the same exit.
- We cannot give you a first-90-days benchmark. Early-tenure quit share varies enormously by format and role, and we have not measured it at a standard we would publish. Anyone who quotes you a confident industry figure for it is estimating.
Where advertising does help is narrower and worth stating precisely: if 68% of your churn is voluntary and you are refilling those roles continuously, the cost and speed of refilling is a real line item, and that is the part we can move. If your problem is that people leave in week three, the useful work is in retention and what happens in the first ninety days, and you should spend there first. For the industry-by-industry picture behind this page, see employee turnover rates by industry; for what to do about the hiring itself, retail recruitment strategies covers the campaign side.
Frequently asked questions
What is the average employee turnover rate in retail?
45.6% across 2025, on the most recent full year of Bureau of Labor Statistics data. BLS publishes retail trade total separations as an annual average of 3.8% of employment per month; twelve of those months is 45.6%. That covers everyone who left for any reason. Retail sits well above the all-industry figure of 39.6% on the same basis, so it remains a high-churn sector, but it is materially below the 60% that most articles still quote.
Why do so many sources say retail turnover is 60%?
Because it was. 60.0% is precisely the retail figure for 2022, when the annual average separations rate was 5.0% a month. Articles written that year were accurate, and the sentence has been reproduced ever since without anyone returning to the source table. The rate has fallen in every year since: 54.0% in 2023, 48.0% in 2024 and 45.6% in 2025.
Is retail turnover still falling in 2026?
No. On the seasonally adjusted monthly series, retail separations ran 4.5% in March 2026, 3.9% in April, 4.1% in May, 4.3% in June and July, and 4.4% in August, all at or above the 3.8% that 2025 averaged. Six months is not a trend and August is preliminary, so we will not call it a reversal. The practical reading is that the four-year decline has stopped, and a plan built on continued improvement no longer has data behind it.
How much of retail turnover is people quitting rather than being let go?
68.4% in 2025. BLS publishes quits separately from total separations: retail quits averaged 2.6% a month against total separations of 3.8%. Across all industries the equivalent share is 60.6%, so voluntary departures make up a larger part of retail churn than they do in the economy generally. Retail's problem is people choosing to leave, not employers letting them go.
What is the difference between the monthly rate and the annual rate?
A factor of twelve, and it is a common mistake in turnover writing. BLS reports separations as the share of employment that left during one month. Quoting 3.8% as a company's annual turnover understates it by an order of magnitude; multiplying by twelve gives the 45.6% figure that is comparable to the annual rates employers calculate from their own payroll.
Can I compare the BLS annual averages to the latest monthly release?
Not directly. The annual averages come from tables that are not seasonally adjusted, and the headline monthly series is seasonally adjusted. They are built on different treatments of the same underlying survey, and a number from one does not belong in a sentence with a number from the other. Compare annual averages with annual averages, and monthly with monthly.
Does recruitment advertising reduce turnover?
Not directly, and we would rather say so than imply otherwise. Advertising determines who applies, how many apply and how quickly the role refills. It has no effect on the schedule, the pay, the manager or anything else that drives someone to leave in week three. What it can do is make the refilling cheaper and faster where churn is structural, which in a sector with a two-thirds voluntary quit share is a permanent cost line rather than an occasional one.
How long does the average retail employee stay?
3.2 years, on the most recent Bureau of Labor Statistics tenure figures (January 2026). That is the median for retail trade wage and salary workers, against 4.1 years across all wage and salary workers. Tenure and turnover measure different things — tenure is how long the people currently employed have been there, turnover is how many left over a period — so the two will not reconcile arithmetically, and a source that treats them as interchangeable is not reading either one carefully.
See what retail applicants actually cost you
Bring your store count and your open roles. We will show you what campaigns like yours cost across 181 retail campaign-months in the benchmark, and what the refill load in the calculator above translates to in applicants a month.
Book a Demo