
Employee Retention Strategies
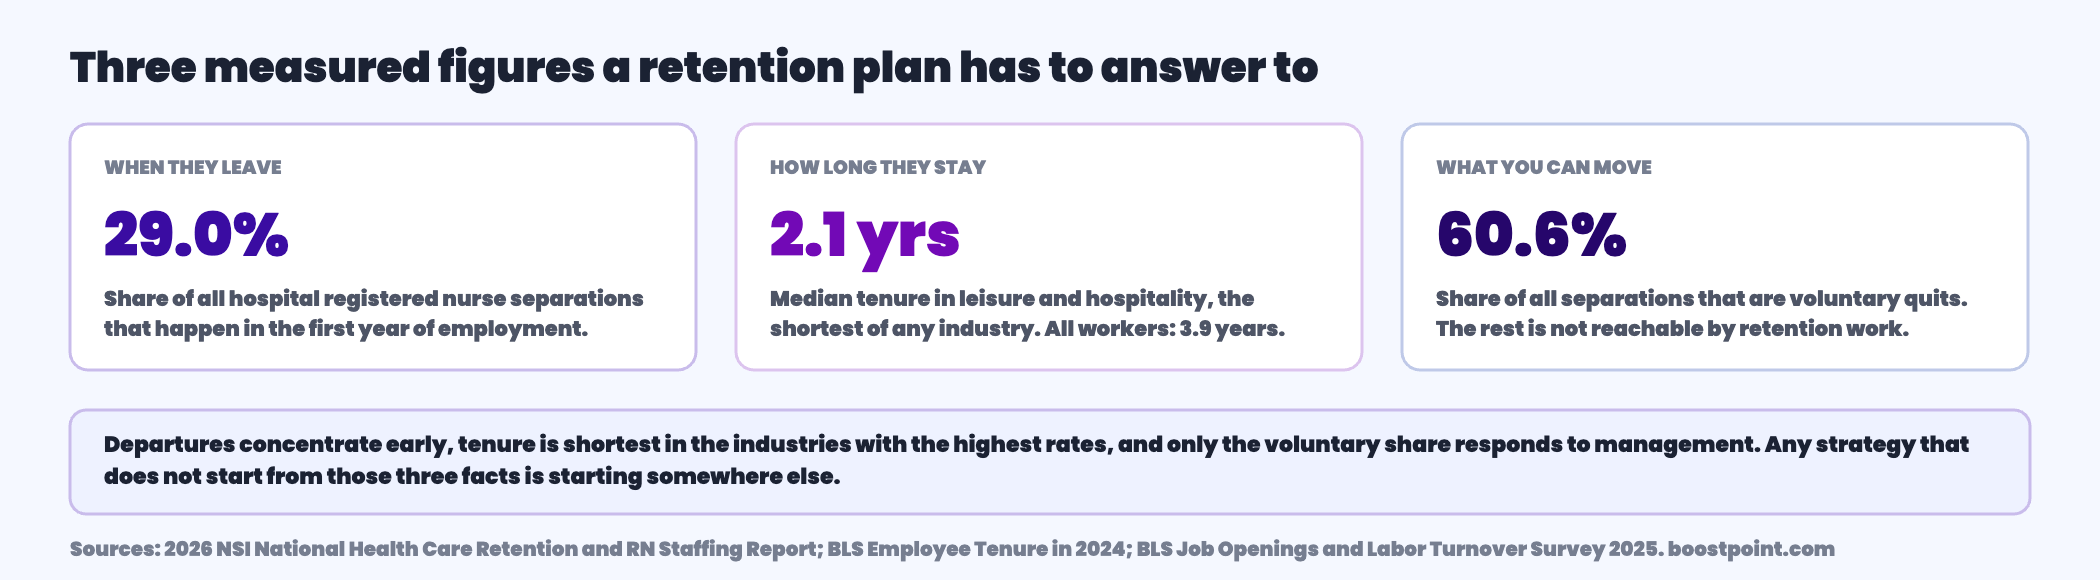
Retention strategy starts with a subtraction. Across all industries, 60.6% of separations are voluntary — that is the share retention can move, and the rest is a demand and performance question wearing the same label. It also starts early: the departures concentrate in the first year of employment, and the median American worker has been with their employer 3.9 years. Everything below is built on measured figures, and where something is a working pattern rather than a measured result, this page says so.
First, split the number you are trying to move
The federal survey separates total separations into quits, which are voluntary departures excluding retirements and transfers, and layoffs and discharges, which are employer-initiated and include firings for cause and terminations of seasonal employees. A third small category covers retirements, transfers, disability separations and deaths.
Retention programs act on the first group. A company with a 40% annual separations rate and a heavy layoff component does not have a retention problem in any useful sense; it has a forecasting problem. A company with the same headline rate where three quarters of it is voluntary has a very different task in front of it.
So the first honest step is to work out what share of your own separations is voluntary and compare that share, not the headline, against your industry. Most published turnover benchmarks never make the split, which is why so many retention plans are aimed at the wrong half. The turnover rate calculator walks through the same split with your own figures.
How much of your turnover is even addressable
The card below turns the published rates into the two numbers that matter: how many people out of a hundred leave voluntarily in a year, and how many are leaving for reasons retention work cannot reach.
Leverage
Your industry, split into the two halves
Pick the closest industry. Figures are 2025 federal annual averages, shown across the year.
Voluntary share is quits divided by total separations, computed by us from the published rates. Across-the-year figures are the published monthly averages multiplied by twelve.
| Industry | Separations across the year | Quits across the year | Voluntary share |
|---|---|---|---|
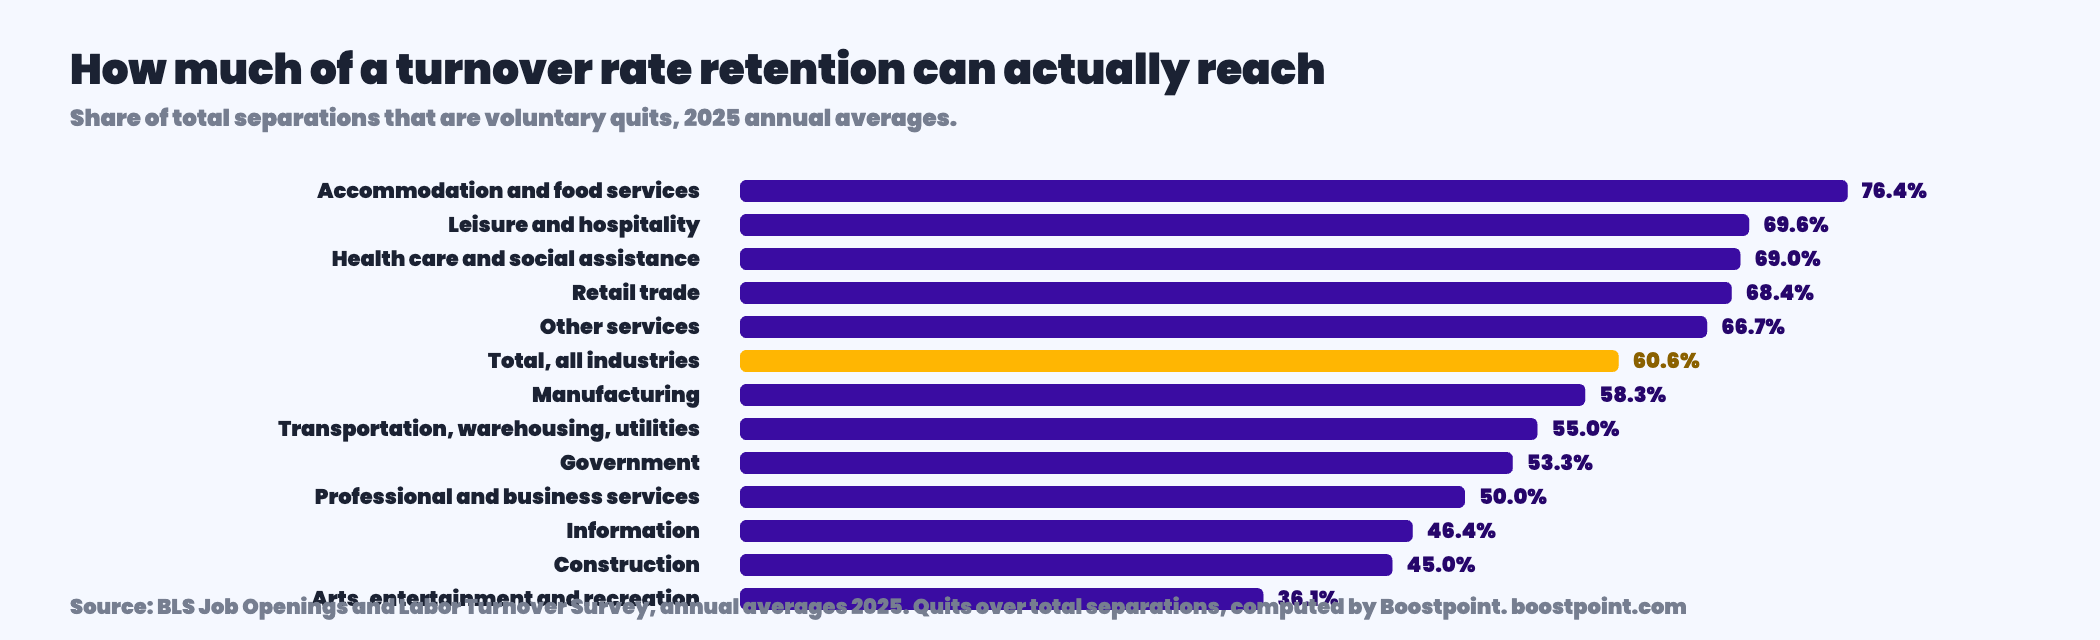
| Accommodation and food services | 66.0% | 50.4% | 76.4% |
| Leisure and hospitality | 67.2% | 46.8% | 69.6% |
| Health care and social assistance | 34.8% | 24.0% | 69.0% |
| Retail trade | 45.6% | 31.2% | 68.4% |
| Other services | 39.6% | 26.4% | 66.7% |
| Total, all industries | 39.6% | 24.0% | 60.6% |
| Manufacturing | 28.8% | 16.8% | 58.3% |
| Transportation, warehousing and utilities | 48.0% | 26.4% | 55.0% |
| Government | 18.0% | 9.6% | 53.3% |
| Professional and business services | 55.2% | 27.6% | 50.0% |
| Information | 33.6% | 15.6% | 46.4% |
| Construction | 48.0% | 21.6% | 45.0% |
| Arts, entertainment and recreation | 73.2% | 26.4% | 36.1% |
Source: U.S. Bureau of Labor Statistics, Job Openings and Labor Turnover Survey, annual average total separations and quits rates for 2025, not seasonally adjusted, read August 29 2026. Across-the-year figures are the published rates multiplied by twelve; the voluntary share is quits over total separations. Neither calculation is published by BLS and both are ours.
Notice the two extremes. Accommodation and food services has the highest voluntary share of any major industry, which means almost the whole of its very large rate is in play. Arts, entertainment and recreation has an even larger headline rate and the smallest voluntary share, because much of the work is seasonal and ends by design. A retention program built for the second one out of advice written for the first would waste a year. The full set of published industry lines, in both forms, is on employee turnover rates by industry.
The first year starts before the first shift. The session between the accepted offer and day one is where the paperwork, the hazard training and the name of the person to text all get handled or do not, and we cover it in new hire orientation for hourly and frontline staff.
Retention is decided in the first year
Wherever separations are broken out by length of service, the same shape appears. In hospital nursing, first-year departures account for 29.0% of all registered nurse separations and another 21.9% come from nurses in their first to second year, so more than half of everyone who leaves has been there under two years. Separately, 22.7% of newly hired registered nurses left within twelve months.
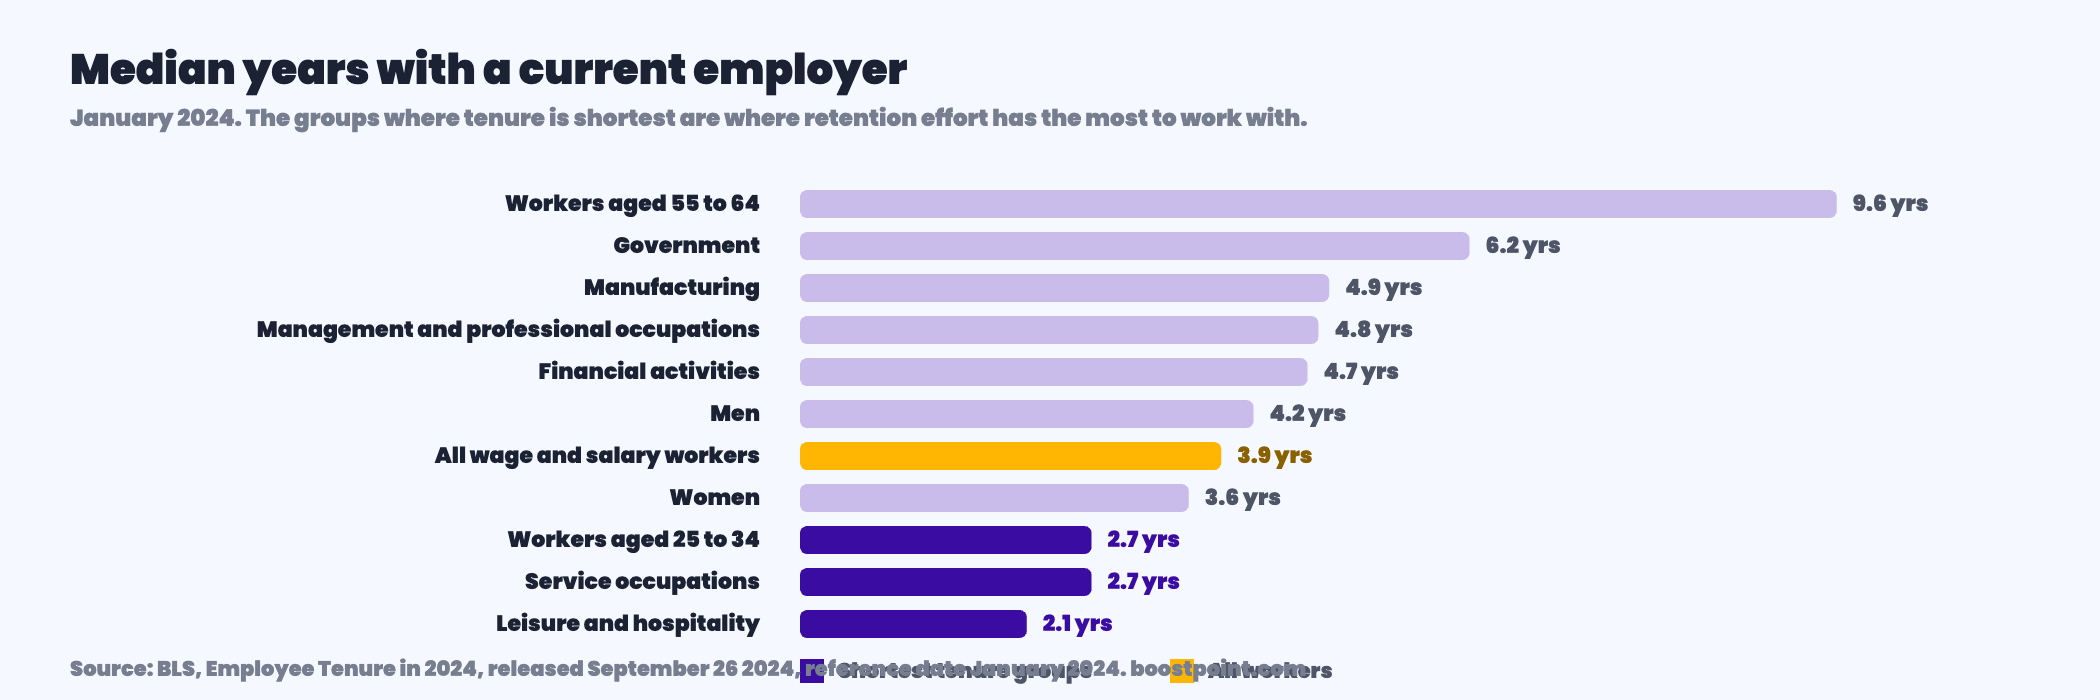
The federal tenure data says the same thing from a different direction. Median tenure with a current employer is 3.9 years across all wage and salary workers, but only 2.7 years for workers aged 25 to 34, and 2.1 years in leisure and hospitality, the lowest of any industry. Service occupations sit at 2.7 years against 4.8 for management and professional roles.
| Group | Median tenure |
|---|---|
| All wage and salary workers | 3.9 years |
| Men | 4.2 years |
| Women | 3.6 years |
| Workers aged 25 to 34 | 2.7 years |
| Workers aged 55 to 64 | 9.6 years |
| Leisure and hospitality | 2.1 years |
| Manufacturing | 4.9 years |
| Financial activities | 4.7 years |
| Government | 6.2 years |
| Management and professional occupations | 4.8 years |
| Service occupations | 2.7 years |
Source: U.S. Bureau of Labor Statistics, Employee Tenure in 2024, released September 26 2024, reference date January 2024. Read August 31 2026.
Put the two together and the practical conclusion is uncomfortable for most retention programs: the money is usually spent on the people least likely to leave. Long-service employees are the ones who receive the recognition schemes and the development budgets, and they are already staying. The first ninety days of a new hire, which is where the losses concentrate, is often handled by whoever happens to be on shift.
The strategies the data actually supports
Aim the effort at the first year. This is the only recommendation on the page that follows directly from measured separations data, and it follows from all of it. If more than half of your departures come from people with under two years of service, an intervention that starts at the twelve-month review has already missed most of them.
Split voluntary from involuntary before you plan anything. Do it monthly, by department, and by length of service. The exercise takes an afternoon and it routinely reveals that a headline problem is concentrated in one location or one shift pattern rather than spread across the business.
Match the intervention to the industry's voluntary share. In a sector like accommodation and food services, where more than three quarters of separations are voluntary, scheduling, pay and the first-shift experience are where the leverage is. In construction or arts and recreation, where the majority is employer-initiated, the same effort is better spent on forecasting and on keeping good people connected between assignments.
Measure the rate you can move, not the rate you can quote. A retention dashboard that shows total separations will make a hiring freeze look like a triumph and a seasonal wind-down look like a crisis. Voluntary departures per hundred employees, by tenure band, is the number that responds to management.
Treat the exit reason as data you have to go and get. Exit interviews conducted by the departing person's manager collect the reason people are willing to give that manager. Whether a third party or a later follow-up produces a more accurate picture is not something we have measured, and we are not going to pretend otherwise; what is clear is that a reason recorded as "personal reasons" for a third of leavers is not a dataset.
The strategies people list that we cannot support
Most retention articles are a list of nine or twelve tactics with a percentage attached to each. Those percentages generally come from vendor surveys of self-selected respondents, and we could not verify them, so they do not appear here.
We have no measured evidence for the effect size of recognition programs, stay interviews, mentorship schemes, wellness benefits, flexible scheduling, career pathing or manager training. Every one of those may work, several are cheap enough to be worth trying regardless, and some are supported by academic literature we are not in a position to weigh. Two that are not cheap, and that carry a wage-and-hour consequence people routinely miss, are the sign-on bonus and the retention bonus. What we can say is that a page claiming a specific percentage improvement for any of them, without naming a study you can read, is not evidence.
The same applies to cost. There is a widely repeated figure for the cost of replacing an employee expressed as a share of salary. It is an estimate, its provenance is usually not stated, and it varies by an order of magnitude across the roles it gets applied to. The calculator below therefore asks for your own figure rather than supplying one. If you want help assembling that figure from your own lines, the turnover cost calculator sets out what belongs in it.
The 5 C's, 3 R's and 4 pillars of employee retention, checked against the data
Three retention frameworks come up again and again, and none of them has a single agreed version. The versions below are widely quoted ones, with where each comes from. They are useful checklists of what employees value. What none of them says is when to apply the effort or to whom, and that is the part the separations data on this page answers.
The 5 C's of employee retention are compensate, commend, challenge, career and culture, in the version set out by John Troy, founder of the hiring service WorkMonger, in 2021. Other lists swap in communication, connection or care.
The 3 R's of employee retention are respect, recognition and rewards, from the 2001 Crisp Publications book Retaining Your Employees: Using Respect, Recognition, and Rewards for Positive Results.
The 4 pillars of employee retention have no standard source. The versions in circulation usually cover pay and benefits, growth and development, recognition, and the work environment or manager relationship.
| Framework item | What the data on this page can say about it |
|---|---|
| Compensate / rewards / pay and benefits | Supported where most leaving is voluntary. In accommodation and food services, where more than three quarters of separations are voluntary, pay, scheduling and the first-shift experience are where the leverage is. |
| Commend / recognition | No measured effect size we can verify. Cheap enough to try; not evidence. |
| Challenge / career / growth and development | No measured effect size we can verify, and aimed at people with tenure. More than half of departures in the nursing data come from people with under two years of service. |
| Culture / respect / work environment | No measured effect size we can verify. The first ninety days, often run by whoever is on shift, is where the environment is actually experienced. |
| What every framework leaves out | Timing. Median tenure is 2.1 years in leisure and hospitality and 2.7 years in service occupations, so the retention effort has to start in the first year, with the voluntary rate split out by tenure band. |
Used that way, the frameworks and the data do not conflict. Pick the items that fit the reasons your own leavers give, aim them at people in their first year, and measure voluntary departures per hundred employees by tenure band to see whether they worked.
Stay interviews: ask before they decide, not after
An exit interview asks somebody who has already gone why they left, which is the least useful moment to ask. A stay interview asks somebody who is still here what would make them leave, while you can still do something about it. It is a fifteen-minute conversation, run by the person’s own supervisor, once or twice a year, off-cycle from performance reviews — and it is the cheapest retention instrument that exists, because it costs nothing but the fifteen minutes.
Two mechanics decide most of the outcome. Run it with the direct supervisor rather than HR, because the supervisor is the variable most likely to be the answer and the conversation is far less useful when that person is not in it. And run it off-cycle from performance reviews — anything attached to a rating gets an answer calibrated for the rating rather than an honest one.
The rule that decides whether it works
A stay interview creates an obligation. If you ask what would make someone leave and then change nothing, you have not gathered data — you have confirmed to your best people that raising something is pointless, and you have accelerated the exact departure you were trying to prevent. Do not run stay interviews you are not prepared to act on. Leave every conversation with one thing you will change, one thing you will find out about, and one thing you have said plainly that you cannot change and why. The third is not a failure; being told a straight no is far better received than being asked and then ignored.
The twenty questions we use, grouped by what each one is for — with what to listen for in the answer and the follow-up that matters — are on their own page: stay interview questions. It also covers who should run them, when to run them for new hires, what to do with the answers in the 48 hours afterwards, and the three situations where a stay interview will not help.
What one point of retention is worth
Retention arguments win budget when they are expressed in departures avoided and hires not made, which is arithmetic anyone can check.
Business case
One percentage point, in people and in money
The cost per departure is yours to supply. Leave it at zero and the tool reports people only.
We publish no cost per departure and none is supplied here. Whatever figure you enter is applied unchanged, and the people figures do not depend on it.
Run it at the all-industry voluntary rate of 24.0% and the shape is clear enough without any cost figure at all. Five hundred people at that rate is a hundred and twenty voluntary departures a year, and every point taken off the rate is five of them, which is five replacement hires that do not have to be made, screened, onboarded and carried through a ramp.
Where recruiting actually helps, said against our own interest
We sell managed recruitment advertising, so read the next paragraph with that in mind.
Advertising does not improve retention. It fills the gap turnover creates, faster or more cheaply, and it can make a bad retention position survivable while the underlying work is done. That is genuinely useful and it is not the same as fixing anything. If you have not established which half of your separations is voluntary and where in tenure they sit, more applicants will not help you, and the honest recommendation is to do that work first.
Where recruiting does affect retention, in our experience rather than in our measurements, is in what the advertising promises. Campaigns that describe the schedule, the pay range and the actual conditions attract fewer applicants and lose fewer of them in the first ninety days. We publish no effect size for that, because we have not measured one.
Worker retention: the number that decides whether any of this pays
Worker retention is the share of employees still with you after a defined period — and for frontline roles the period that matters is 90 days, not a year. Most frontline turnover happens in the first three months, which means an annual retention rate reported to a board has already averaged away the problem it was meant to reveal.
The arithmetic is worth doing once. If a role costs $7.72 per completed application and takes roughly twenty applications to produce a hire, the advertising alone is about $154 a hire — before a single hour of recruiter time, orientation or the overtime that covers the gap. A worker who leaves in week six charges you that twice in a quarter, and the second campaign runs against a shrinking local audience, which is why the cost per applicant rises the third time you advertise the same role in the same market.
Three retention measures are worth tracking separately, because they have different causes: 90-day retention (usually a scheduling or onboarding failure), first-year retention (usually a pay or progression failure), and retention by hiring source, which almost nobody measures and which tells you which of your channels is sending people who stay. That last one is the single most valuable number in this article and it lives in your ATS, not in an ad platform.
The honest framing: retention work and hiring work are the same budget. Every point of 90-day retention you recover is a campaign you do not have to run again. Our hiring metrics benchmarks page covers the four measures advertising cannot see.
Frequently asked questions
What are the most effective employee retention strategies?
The only one that follows directly from separations data is to aim the effort at the first year of employment, because that is where departures concentrate. After that, split voluntary from involuntary departures monthly and by tenure band, and match the intervention to which half is larger. Anything presented with a specific percentage improvement attached should come with a study you can read.
How much of employee turnover can retention actually fix?
Across all industries, 60.6% of separations are voluntary quits, and that is the share retention work can move. It ranges from 76.4% in accommodation and food services to 36.1% in arts, entertainment and recreation. The rest is employer-initiated or the result of retirement and transfer, and no retention program reaches it.
How long does the average employee stay?
Median tenure with a current employer was 3.9 years in January 2024, with men at 4.2 years and women at 3.6. The figure falls to 2.7 years for workers aged 25 to 34 and to 2.1 years in leisure and hospitality, and rises to 9.6 years for workers aged 55 to 64 and 6.2 years in government.
When do most employees leave?
Early. Where separations are broken out by length of service, first-year departures dominate: in hospital nursing they account for 29.0% of all registered nurse separations, with another 21.9% in the first to second year. Just over half of everyone who leaves has under two years of service.
How much does employee turnover cost?
We do not publish a figure and we would treat any general one with suspicion. The widely repeated share-of-salary estimates vary by an order of magnitude depending on the role they are applied to, and their provenance is usually not stated. Build the number from your own lines, which typically means vacancy coverage, recruiting, onboarding and the productivity ramp.
Do recognition programs and stay interviews work?
We have not measured them and we are not going to assert an effect size. Several are cheap enough to be worth trying on judgment alone. The thing to be wary of is a specific percentage improvement quoted without a named, readable source, which is the usual form these claims take.
What is a good retention rate?
There is no published threshold. The defensible comparison is your own voluntary departure rate against your industry's quits line across a full year, with your first-year departures separated from the rest. A business at the industry rate whose losses are all new hires has a different and more fixable problem than one losing long-service staff.
Does better recruiting reduce turnover?
Not on its own, and we sell recruitment advertising, so treat the answer accordingly. Advertising fills the gap turnover creates rather than closing it. What plausibly helps is accuracy in what the advertising promises about schedule, pay and conditions, and we publish no effect size for that because we have not measured one.
What is a stay interview?
A stay interview is a short structured conversation with a current employee about what keeps them and what would make them leave, run while you can still act on the answers. It is the counterpart of an exit interview and considerably more useful, because an exit interview collects the same information from someone whose decision is already made.
What questions should you ask in a stay interview?
Eight work well in order: what they look forward to, the most frustrating part of a normal day, one thing they would stop tomorrow, what would make them leave, what another employer would have to offer, whether they have what they need to do the job, what they want to be doing in two years, and what you should have asked. The fourth and fifth carry most of the value and both need a silence after them. The full set of twenty, with what to listen for in each answer, is on our stay interview questions page.
How often should you run stay interviews?
Once or twice a year per person, run by the direct supervisor, and deliberately off-cycle from performance reviews so the answers are not calibrated for a rating. Do not run them at all unless you are prepared to change something as a result: asking and then doing nothing is worse for retention than never asking.
What is worker retention?
The share of employees still with you after a defined period. For frontline roles the useful period is 90 days rather than a year, because most frontline turnover happens in the first three months and an annual figure averages that away. Tracking 90-day retention, first-year retention and retention by hiring source separately is more useful than a single company-wide number.
How do you calculate the cost of losing a frontline worker?
Start with the advertising: cost per completed application multiplied by the applications it takes to make a hire. At a $7.72 median for CNA campaigns and roughly twenty applications per hire, that is about $154 before any recruiter time, orientation or overtime cover. Replacing the same role repeatedly in one market also raises the cost per applicant, because the local audience shrinks with each campaign.
Which retention metric matters most?
Retention by hiring source, and almost nobody tracks it. It tells you which channels send people who stay rather than people who merely apply, which is the only way to judge a recruiting channel on quality rather than volume. It cannot be measured from advertising data — it requires joining source data in your applicant tracking system to tenure.
What are the 5 C's of employee retention?
A widely quoted version is compensate, commend, challenge, career and culture, set out by John Troy of WorkMonger in 2021; other lists substitute communication, connection or care. They are a checklist of what employees value, not a measured program. Separations data shows departures concentrate in the first year of employment, so whichever C's you work on, aim them at new hires first.
What are the 3 R's of employee retention?
Respect, recognition and rewards, from the 2001 book Retaining Your Employees: Using Respect, Recognition, and Rewards for Positive Results. Rewards fits best where most turnover is voluntary, such as accommodation and food services, where pay, scheduling and the first-shift experience are where the leverage is. We have not found a measured effect size for recognition programs on their own.
What are the 4 pillars of employee retention?
There is no standard source; most versions cover pay and benefits, growth and development, recognition, and the work environment or relationship with the manager. The pillar most lists miss is timing. Because more than half of departures in the nursing data come from people with under two years of service, the pillars matter most when they are applied in an employee's first year.
When the retention work is done, the hiring still has to happen
Even a good retention position leaves a replacement requirement every month. Keeping that pipeline full is the part we measure.
Separations figures: U.S. Bureau of Labor Statistics, Job Openings and Labor Turnover Survey, annual average total separations and quits rates by industry for 2025, not seasonally adjusted, read August 29 2026 — all industries 3.3% and 2.0%; accommodation and food services 5.5% and 4.2%; leisure and hospitality 5.6% and 3.9%; arts, entertainment and recreation 6.1% and 2.2%; retail trade 3.8% and 2.6%; health care and social assistance 2.9% and 2.0%; other services 3.3% and 2.2%; manufacturing 2.4% and 1.4%; transportation, warehousing and utilities 4.0% and 2.2%; professional and business services 4.6% and 2.3%; information 2.8% and 1.3%; construction 4.0% and 1.8%; government 1.5% and 0.8%. Published rates are average monthly figures; every across-the-year figure on this page is the published rate multiplied by twelve, which follows from the survey's definition of the annual average rate as summed monthly levels over summed monthly employment. The voluntary share is quits divided by total separations. Neither calculation is published by BLS and both are ours, shown so they can be checked. Separations definitions, including the exclusion of transfers within the same location, employees on strike, and employees of temporary help agencies, employee leasing companies, outside contractors and consultants, are quoted from the same survey's technical note. Tenure figures: U.S. Bureau of Labor Statistics, Employee Tenure in 2024, released September 26 2024 with a January 2024 reference date, read August 31 2026. Nursing tenure figures: 2026 NSI National Health Care Retention and RN Staffing Report, covering January to December 2025, read August 31 2026. Advertising figures: Boostpoint 2026 Social Job Advertising Benchmark — 891 Boostpoint-managed campaigns on Meta across 1,334 campaign-months in 2026, advertising costs only. Cost per applicant is not cost per hire, and no cost per hire is derived from it anywhere on this page. No cost per departure is published on this page; the calculator applies only a figure the reader supplies. The claim that accurate campaign copy reduces early departures is a working pattern rather than a measured result and is labeled as such where it appears. No effect size is asserted for any retention tactic. Last updated August 2026.