
Turnover Rate Calculator
Turnover rate is separations divided by average employment, times 100. The arithmetic takes ten seconds; the comparison is where people go wrong. The federal turnover rate everyone quotes is an average monthly rate, not the share of a workforce that leaves in a year — so setting your 38% annual figure against “the national rate of 3.3%” compares a year against a month. Calculate below, and the tool will keep the two apart for you.
The calculator
Enter the separations you counted, the average number of people on payroll over the same period, and how long the period was. Everything runs in your browser and nothing is sent anywhere.
Your numbers
Turnover rate
Separations divided by average employment, times 100 — the same formula the federal survey uses.
Average employment is the average headcount across the period, not the count on the last day. If you only have a start and an end number, the midpoint is a reasonable stand-in and worth labeling as one.
The comparison almost everybody gets wrong
Search for a turnover benchmark and you will be told that the rate is around 3.3%, or 5.5% in hospitality, or 2.4% in manufacturing. Those figures are real and they come from the federal Job Openings and Labor Turnover Survey. They are also not what you think they are.
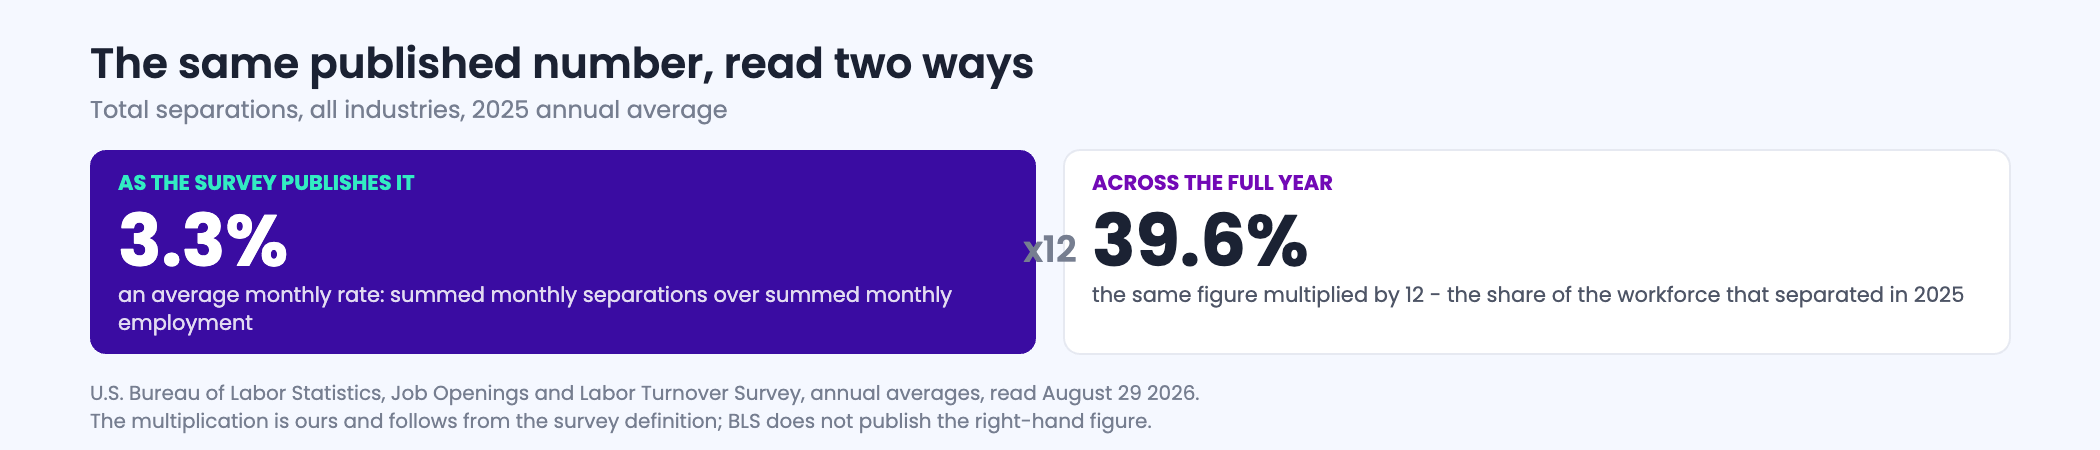
The survey's own footnote defines the annual average total separations rate as the sum of the twelve monthly separations levels as a percent of the sum of the twelve monthly employment levels. Work that through and the twelve monthly employment levels sum to twelve times average employment, which means the published figure is the annual separations divided by twelve times the average headcount. It is an average monthly rate wearing an annual label.
Published annual average rate × 12 = the share of the workforce that separated over the year. That is not an approximation; it falls straight out of the definition.
So the all-industry figure of 3.3% for 2025 means that separations over the year ran at 39.6% of average employment. In accommodation and food services, the 5.5% line means 66.0%. In manufacturing, 2.4% means 28.8%. Those are the numbers an HR team actually has in mind when it says “our turnover is 40%” — and against them, 40% is unremarkable rather than catastrophic.
This is not a criticism of the survey, which is precise about what it publishes. It is a warning about the second-hand version. A benchmark quoted without saying whether it is monthly or annual is worse than no benchmark, because it produces confident conclusions in the wrong direction — and the direction it usually points is that your company is a catastrophic outlier when it is close to typical.
Which separations are you counting?
The second comparability trap is definitional. The federal survey splits separations into three buckets, and most internal turnover numbers quietly merge them. The distinction is not only statistical: in many states it changes when the last paycheck is legally due, as final paycheck laws by state sets out.
| Bucket | What it covers |
|---|---|
| Quits | Employees who left voluntarily, with the exception of retirements or transfers to other locations |
| Layoffs and discharges | Involuntary separations initiated by the employer, including layoffs with no intent to rehire, formal suspensions from pay status expected to last more than seven days, discharges from mergers, downsizing or closings, firings for cause, and terminations of permanent, short-term and seasonal employees |
| Other separations | Retirements, transfers to other locations, separations due to employee disability, and deaths |
| Total separations | All separations from the payroll during the reference period |
| Not counted at all | Transfers within the same location, employees on strike, and employees of temporary help agencies, employee leasing companies, outside contractors or consultants |
Source: U.S. Bureau of Labor Statistics, Job Openings and Labor Turnover Survey technical note, read August 29 2026. Definitions quoted.
That last row matters more than it looks. If your plant runs a large temp-to-hire population, the federal figures exclude those people entirely while your internal number probably includes them, and the gap between the two is not a performance difference. The same applies to a warehouse that moves people between sites: an internal transfer is not a separation in the federal definition, but it usually looks like one in a payroll export.
Comparability check
Is your number comparable to a published one?
Tick what your count includes. The check tells you which published series your figure can honestly sit beside, and which it cannot.
What counts as high
There is no universal threshold, and any page that offers you one is inventing it. What exists is the distribution across industries, and the honest way to read your own number is against the industry you actually operate in. Both columns below come from the same published figures: the first as the survey prints it, the second multiplied by twelve so it can be read against a full-year internal number. A fuller breakdown, covering all twenty-six published industry groups and how each has moved since 2021, sits on employee turnover rates by industry, and what can actually be done about the voluntary half is on employee retention strategies.
| Industry | As published (average monthly) | Over a full year (published × 12) | Quits, over a full year |
|---|---|---|---|
| All industries | 3.3% | 39.6% | 24.0% |
| Accommodation and food services | 5.5% | 66.0% | 50.4% |
| Professional and business services | 4.6% | 55.2% | 27.6% |
| Construction | 4.0% | 48.0% | 21.6% |
| Transportation, warehousing and utilities | 4.0% | 48.0% | 26.4% |
| Retail trade | 3.8% | 45.6% | 31.2% |
| Health care and social assistance | 2.9% | 34.8% | 24.0% |
| Manufacturing | 2.4% | 28.8% | 16.8% |
| Government | 1.5% | 18.0% | 9.6% |
Source: U.S. Bureau of Labor Statistics, Job Openings and Labor Turnover Survey, annual average rates by industry, not seasonally adjusted, read August 29 2026. The first column is as published. The second and third are that figure multiplied by twelve, which follows exactly from the survey's own definition of the annual average rate; BLS does not publish them in that form.
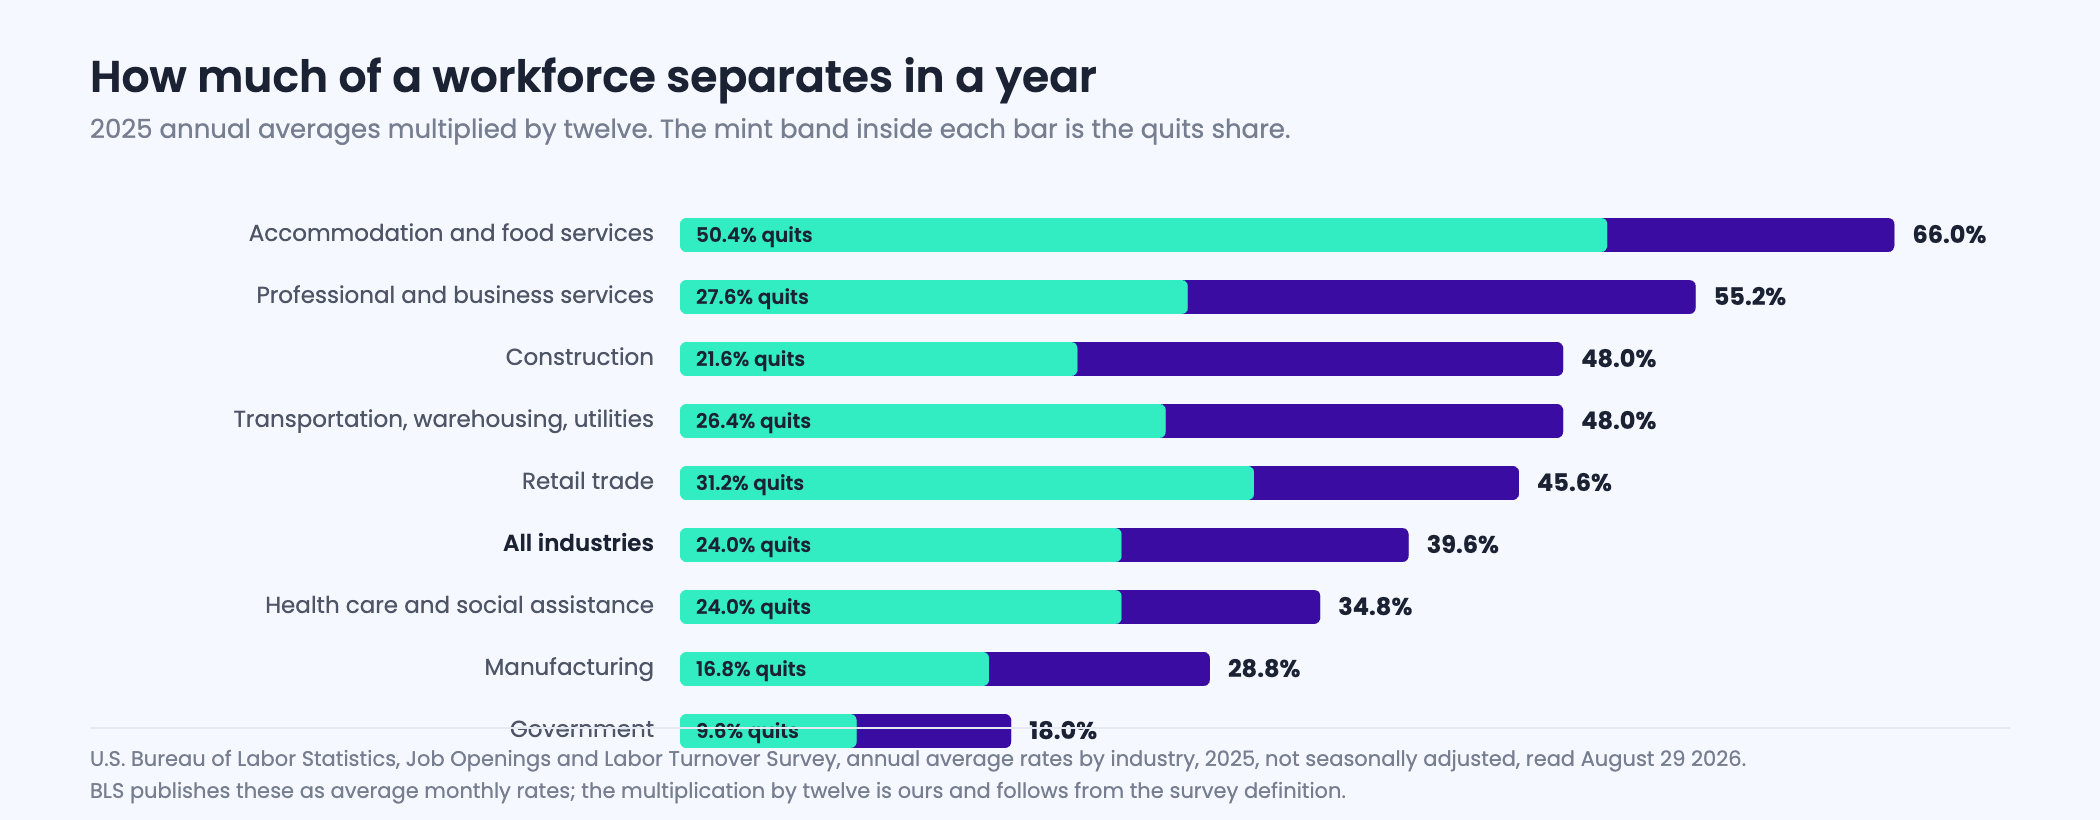
Across all industries, separations in 2025 ran at almost 40% of average employment. Your 35% is not a crisis — but where in the employment relationship it happens still is.
The rate is a symptom, not a diagnosis
Knowing the number rarely changes anything on its own. What changes things is knowing when in the employment relationship people are leaving, because early separations and late ones have almost nothing in common. Someone who leaves in week three usually encountered a job different from the one they were sold; someone who leaves in year three usually ran out of a reason to stay. The first is a recruiting and onboarding problem, and it is the one you can fix quickly — the numbers on that are on first ninety days turnover.
The other thing a rate cannot tell you is what it costs, which is a separate calculation with separate inputs and a lot more assumptions. If that is what you are after, use the turnover cost calculator instead, and keep the two numbers apart in whatever you present. A rate and a cost answer different questions, and a combined headline figure invites people to argue with the assumptions rather than the finding.
Three ways this number gets quietly wrong
- Headcount at the end of the period instead of the average. In a growing company this understates turnover, sometimes badly. In a shrinking one it overstates it.
- Seasonal terminations counted inconsistently. The federal definition puts terminations of seasonal employees inside layoffs and discharges. If your internal number excludes them and the benchmark includes them, you are comparing two different things.
- A monthly figure presented without the word monthly. The most expensive error on this page, and the reason the calculator above labels every output with its period.
When the replacement load is the real problem
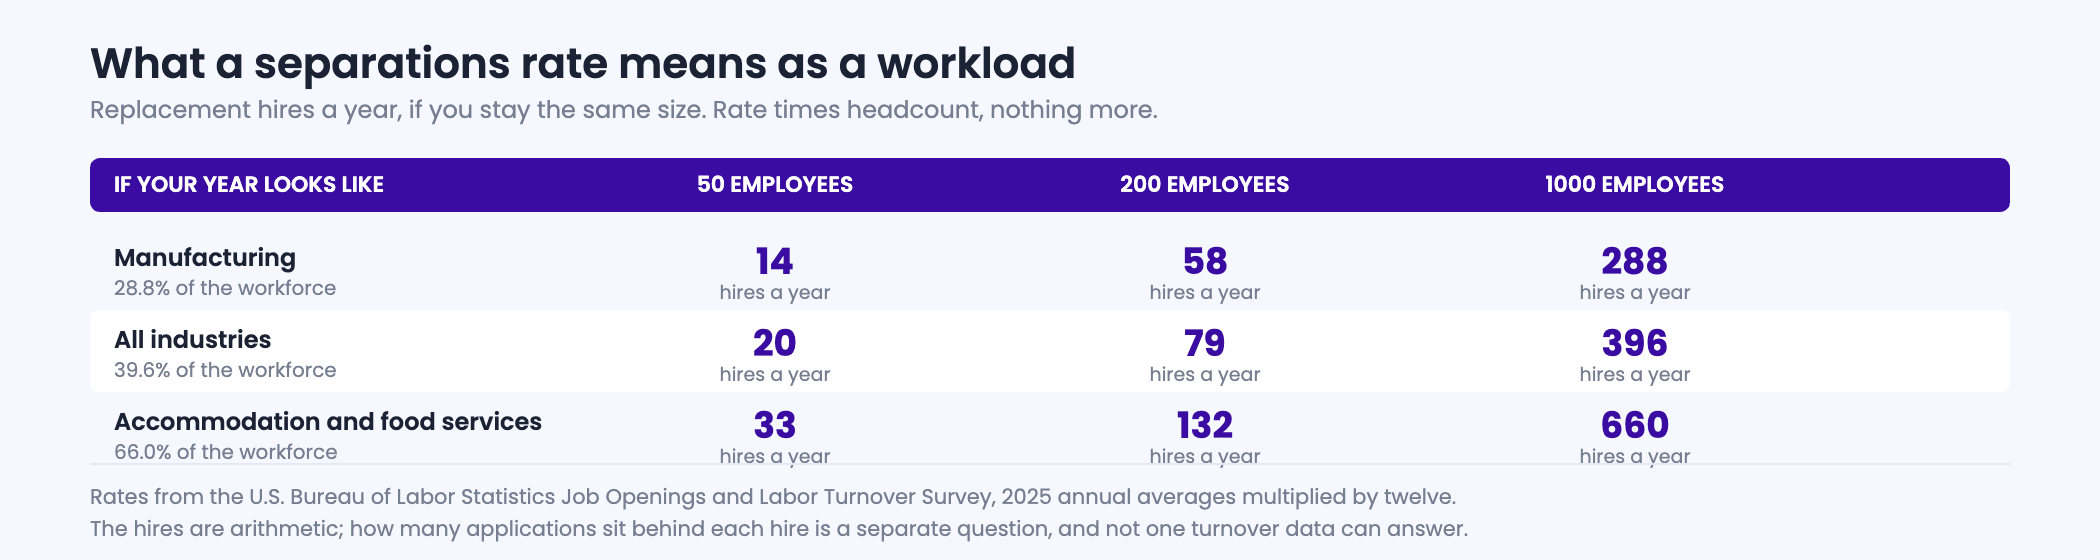
A high separations rate turns hiring into a treadmill, and the arithmetic is unforgiving: replacing people faster than you lose them is a volume problem before it is anything else. That part we do measure. What it costs to generate a completed application varies across our benchmark by more than four to one across the middle half of campaigns alone, from $6.48 to $29.74 per applicant, and knowing where your roles sit tells you whether the treadmill is expensive or merely tiring.
| Point in the distribution | Cost per applicant |
|---|---|
| Lower quartile | $6.48 |
| Median campaign | $13.88 |
| Upper quartile | $29.74 |
Source: Boostpoint 2026 Social Job Advertising Benchmark — 891 Boostpoint-managed campaigns on Meta (1,334 campaign-months), 2026; advertising costs only. Cost per applicant is not cost per hire, and nothing on this page derives one from the other.
Retention rate formula
The employee retention rate formula is: employees still employed at the end of a period who were employed at the start, divided by the number employed at the start, times 100. It measures how many of the people you had are still there. Turnover measures something different: all separations in the period, including new hires who came and went, divided by average employment.
A worked frontline example
A site starts the quarter with 50 employees. Twelve of them leave. It hires 20 people, and 8 of those new hires also leave before the quarter ends, so it finishes with 50. Retention rate is 38 ÷ 50 = 76%. Turnover rate is 20 separations ÷ average employment of 50 = 40%.
The two numbers do not add up to 100, and that gap is the useful part. Retention ignores everyone hired during the period, so it describes your established staff; turnover counts the new hires who left, so it describes your hiring as well. A site with good retention and high turnover is losing new hires, not veterans — which points at the first 90 days and the job ad rather than at pay for tenured staff. Our page on first-90-days turnover covers that case.
Two rules keep the retention rate honest. Use the same period length every time (a quarterly retention rate is not comparable with an annual one), and do not count people hired during the period in either the numerator or the denominator.
Frequently asked questions
How do you calculate employee turnover rate?
Divide the number of separations in the period by the average number of employees on payroll over the same period, then multiply by 100. Use average employment rather than the headcount on the last day, because in a growing or shrinking business the end-of-period figure distorts the result in a predictable direction.
Is the federal turnover rate monthly or annual?
The published annual average rate is an average monthly rate. The survey defines it as the sum of the twelve monthly separations levels as a percent of the sum of the twelve monthly employment levels, and those twelve employment levels add up to twelve times average headcount. Multiply the published figure by twelve to get the share of the workforce that separated over the year.
What was the national turnover rate in 2025?
The annual average total separations rate was 3.3%, which is an average monthly figure. Across the full year that is 39.6% of average employment. The quits component was 2.0% monthly, or 24.0% across the year. Both are all-industry figures and the spread by industry is wide.
Can I multiply a monthly turnover rate by twelve?
To convert a published annual average rate into a full-year share, yes, and it is exact rather than an estimate. To turn one observed month of your own data into a year, no, not reliably: a single month reflects whatever happened that month, and seasonal businesses will be badly misled by it. The calculator above shows both and labels which is which.
What is the difference between turnover rate and quit rate?
Quits are voluntary departures, excluding retirements and transfers to other locations. Total separations includes quits plus layoffs and discharges plus other separations such as retirements, transfers, disability separations and deaths. A number that mixes voluntary and involuntary departures cannot be set beside a published quits rate.
Should temps and contractors be in my turnover number?
They are not in the federal figures. Employees of temporary help agencies, employee leasing companies, outside contractors and consultants are excluded from the survey's separations measures, as are transfers within the same location and employees on strike. If your internal count includes them, say so, because the difference from a published benchmark will not be a performance difference.
What is a good employee turnover rate?
There is no universal threshold, and any single number offered as one is invented. Read your own figure against your own industry across a full year: in 2025 that was roughly 66% in accommodation and food services, 48% in construction and in transportation and warehousing, 45.6% in retail, 34.8% in health care and social assistance, and 28.8% in manufacturing, against 39.6% across all industries.
Does a high turnover rate mean I have a recruiting problem?
It means you have a replacement workload, which is a different thing. Whether recruiting is the constraint depends on when people leave: early separations usually point at the job being different from the advertisement or at onboarding, while later ones point at pay, schedule and management. The rate alone does not distinguish them.
What is the formula for employee retention rate?
Divide the number of employees who were employed at the start of the period and are still employed at the end by the number employed at the start, then multiply by 100. People hired during the period are left out of both numbers.
What is the difference between retention rate and turnover rate?
Retention rate measures the share of employees you started the period with who are still there. Turnover rate counts all separations in the period, including new hires who left, divided by average employment. They do not add up to 100, and a large gap usually means new hires are leaving quickly.
When the replacement load is the problem
The rate is yours to fix. The volume of applications you need to keep up with it is the part we measure.
Turnover definitions, the separations rate formula and the annual average rate definition quoted from the U.S. Bureau of Labor Statistics Job Openings and Labor Turnover Survey and its technical note, read August 29 2026: quits, layoffs and discharges, other separations, total separations, and the exclusion of transfers within the same location, employees on strike, and employees of temporary help agencies, employee leasing companies, outside contractors and consultants. Published annual average rates for 2025, not seasonally adjusted, all as average monthly figures — all industries 3.3% total separations and 2.0% quits; accommodation and food services 5.5% and 4.2%; professional and business services 4.6% and 2.3%; construction 4.0% and 1.8%; transportation, warehousing and utilities 4.0% and 2.2%; retail trade 3.8% and 2.6%; health care and social assistance 2.9% and 2.0%; manufacturing 2.4% and 1.4%; government 1.5% and 0.8%. The full-year columns on this page are those published figures multiplied by twelve, which follows exactly from the survey's definition of the annual average rate as summed monthly levels over summed monthly employment; BLS does not publish the figures in that form and the multiplication is ours, shown so it can be checked. Advertising figures: Boostpoint 2026 Social Job Advertising Benchmark — 891 Boostpoint-managed campaigns on Meta across 1,334 campaign-months in 2026, advertising costs only; $6.48 lower quartile, $13.88 median, $29.74 upper quartile. Cost per applicant is not cost per hire, and no cost per hire is derived from it anywhere on this page. All calculations run in your browser; nothing entered here is transmitted or stored. Last updated August 2026.