Employer guideUpdated September 2026
Employee Turnover in Hospitality: Which Number Is Actually Yours
Turnover in accommodation and food services was 66.0% across 2025 on Bureau of Labor Statistics data — 5.5% of employment leaving per month, twelve times over. You will also see 86%, 92%, 110% and "over 100%" quoted for the same sector, and none of those are wrong either. They count different people. This page reconciles the five figures in circulation and tells you which one your operation should be measured against.
Five numbers, one sector, and why they all look wrong
Search this topic and you will be handed 65%, 73.8%, 86.3%, "70 to 80%" and "quick service often exceeds 100%", frequently on the same page of results. The instinct is to assume most of them are junk. They are not. They are measuring different populations, over different periods, from different surveys — and almost nobody says which.
| Figure you will see | What it actually counts | Source |
|---|---|---|
| 66.0% | Every employee in accommodation and food services, all separations, 2025 | BLS JOLTS Table 20 |
| 85.2% | The same measure in 2021 — the pandemic peak, still quoted as current | BLS JOLTS Table 20 |
| 110% | Hourly staff only, limited-service restaurants, rolling 12 months to Q3 2025 | Black Box Intelligence |
| 92% | Hourly staff only, full-service restaurants, 2025 | Black Box Intelligence |
| 35% | Managers only, full-service restaurants, Q3 2025 | Black Box Intelligence |
The pattern is consistent once you see it: the narrower the population, the higher the number. Hourly restaurant staff churn faster than the sector as a whole, limited service churns faster than full service, and managers churn at about a third of the hourly rate. A figure quoted without its population is not a benchmark, it is a statistic looking for a headline.
What the BLS number actually is
BLS publishes separations as a monthly rate. Multiply by twelve for something comparable to the annual figures operators calculate from their own payroll.
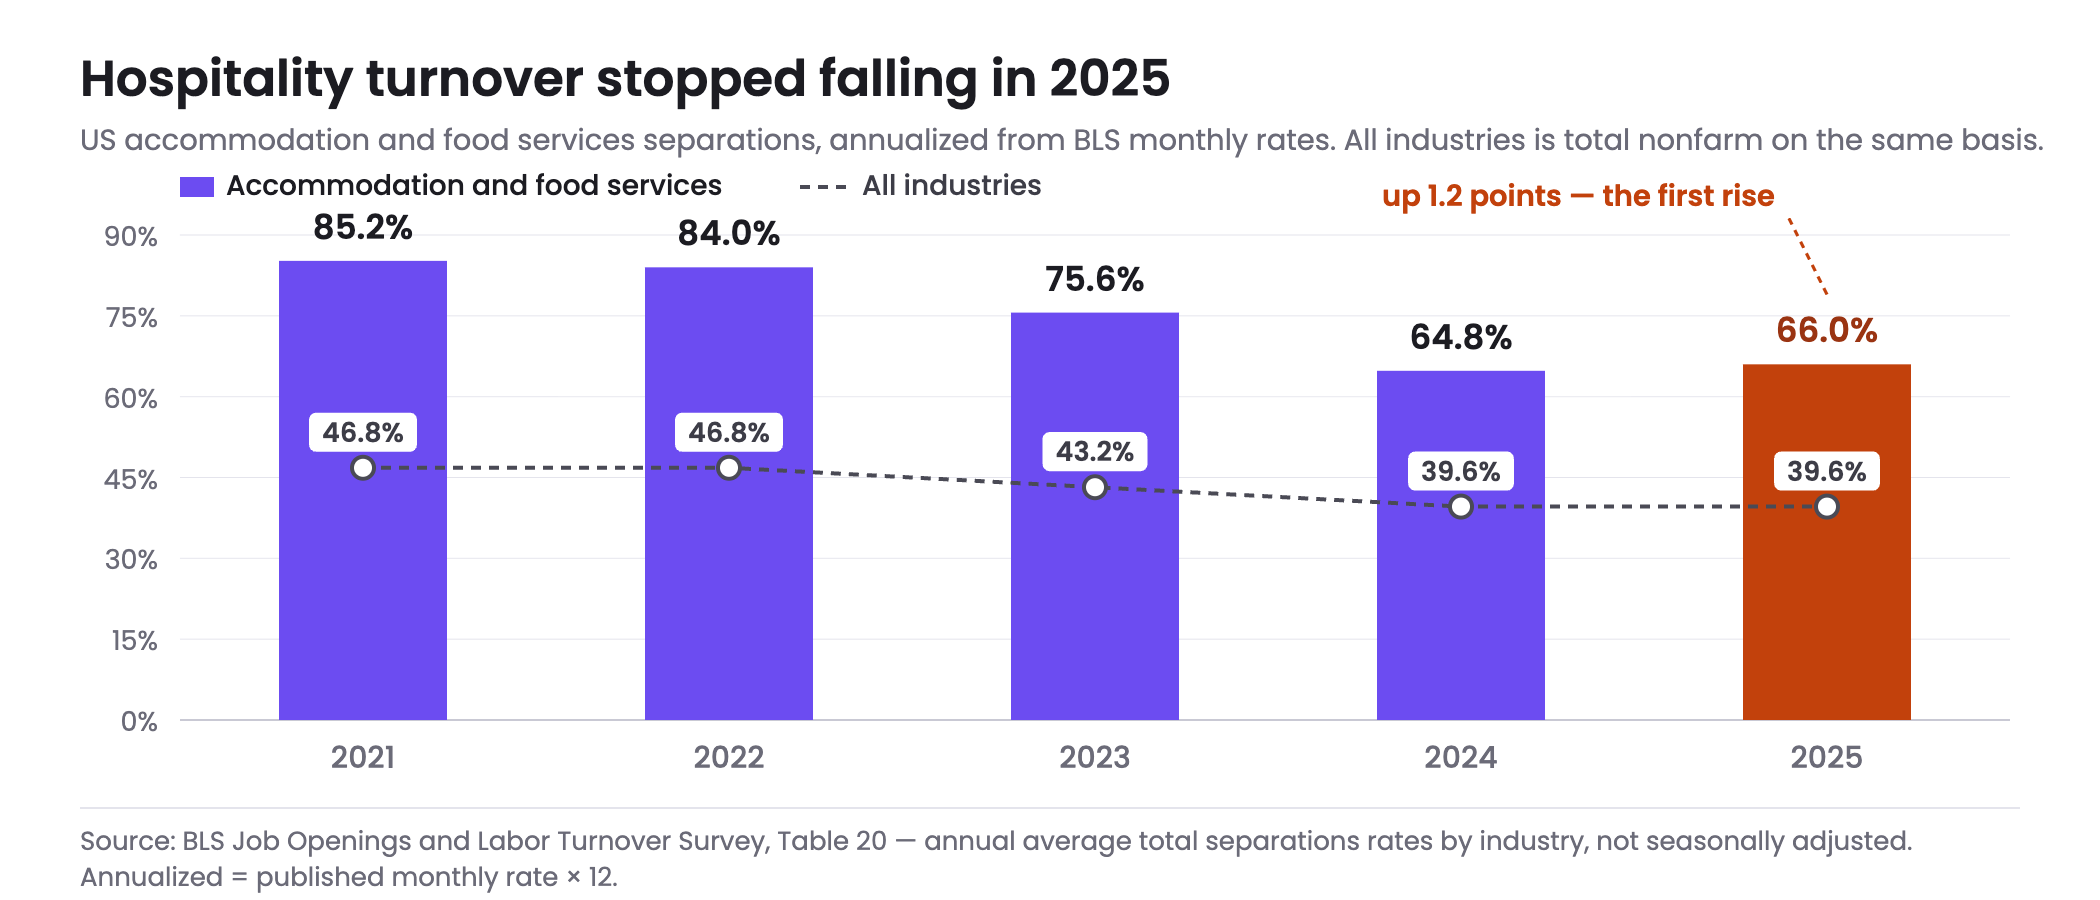
| Year | As published (monthly) | Across the year | All industries |
|---|---|---|---|
| 2021 | 7.1% | 85.2% | 46.8% |
| 2022 | 7.0% | 84.0% | 46.8% |
| 2023 | 6.3% | 75.6% | 43.2% |
| 2024 | 5.4% | 64.8% | 39.6% |
| 2025 | 5.5% | 66.0% | 39.6% |
Two things to take from that table. The sector came down 19.2 points from the 2021 peak, so the 86% figure still being quoted is four years out of date. And hospitality still runs at 1.67 times the all-industry rate — the gap is real, it is just narrower than the headlines suggest.
The fall stopped here before it stopped anywhere else
Look at 2024 to 2025 again: 64.8% to 66.0%. That is an increase of 1.2 points, and it makes accommodation and food services the sector where the post-pandemic improvement ran out earliest. The 2026 monthly series says the same thing: 5.5% in March, 5.6% in April, 5.6% in May and 5.7% in June, every one of them at or above the 5.5% that 2025 averaged.
Those monthly figures are seasonally adjusted and the annual averages above are not, so do not put them in the same sentence as a comparison — read the monthly series against itself. On its own terms it is flat to rising, not falling. A 2026 staffing plan that assumed continued improvement is planning against data that stopped supporting it two years ago.
Three in four departures are someone choosing to leave
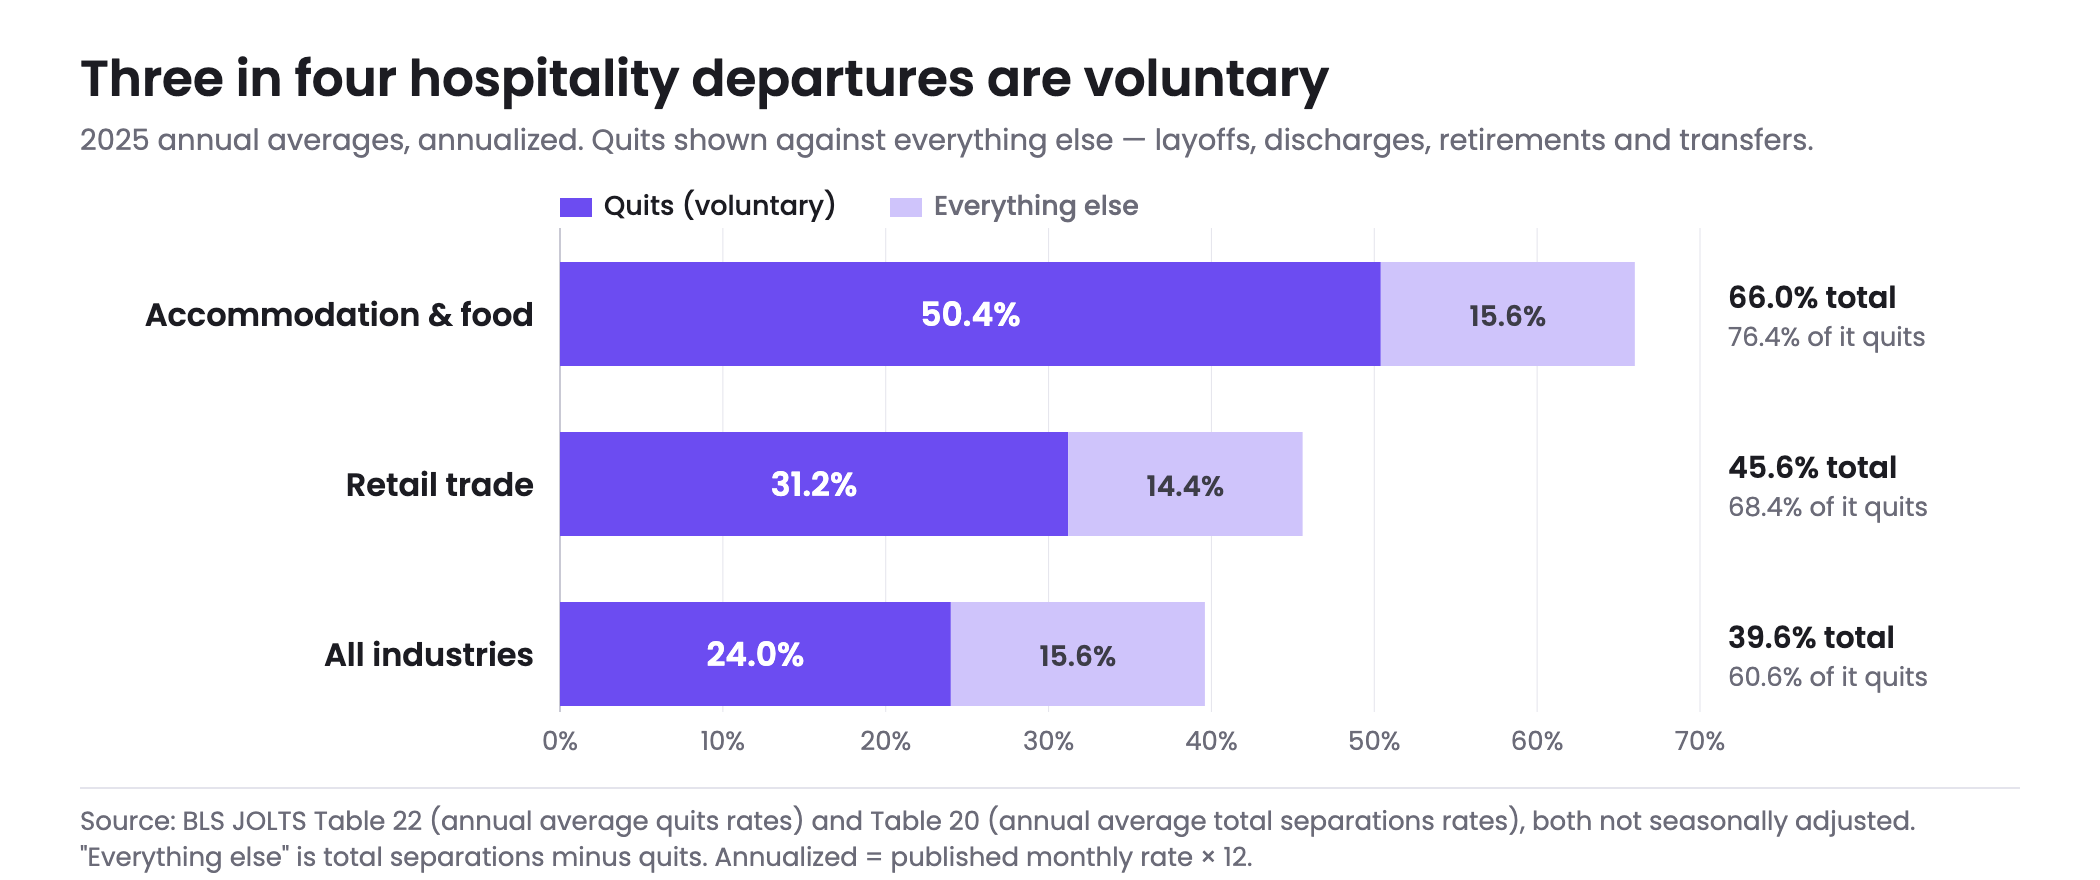
Hospitality quits ran at 4.2% a month in 2025, or 50.4% across the year. Against total separations of 66.0%, quits are 76.4% of all departures — the highest voluntary share of any major sector, against 68.4% in retail and 60.6% across the economy.
Put plainly: half your workforce leaves voluntarily every year, and that is the normal condition of the industry, not a crisis year. It also means almost nothing about this number is under your control through headcount planning. It is a job-quality, scheduling and early-tenure number, and the median tenure in leisure and hospitality — 2.1 years, the shortest in the federal data — is the same fact stated from the other end.
Which number should you be comparing yourself to
The reconciliation table above only helps if you use the row that matches how you count. Set the two dropdowns to how your own figure is calculated.
Find your comparison figure
Covering a gap with longer shifts rather than more people has a price of its own where a daily overtime rule applies. Our page on overtime laws by state sets out which states have one and what each shift pattern costs under it.
What that churn costs you in coverage, not dollars
The number that matters operationally is not the annual percentage. It is how many roles sit empty at any given moment, which is turnover multiplied by how long you take to fill. A sector at 66% with a four-week fill time is permanently short about 5% of its schedule.
Permanent vacancy load
What refilling actually costs, on our own data
Our benchmark measures social recruitment advertising only, and in hospitality the structure of the campaign moves the cost more than the creative does.
| Campaign structure | Median cost per applicant | Apply rate | The hospitality version |
|---|---|---|---|
| Event-driven | $8.02 | 21% | A hiring afternoon at the restaurant; an open house at the new location |
| Multi-role, always-on | $9.83 | 12% | One standing campaign for the group, roles swapped in and out |
| Single-role posting | $14.45 | 18% | "Line cook wanted", launched after the notice, paused when they start |
The reason that ordering matters in a 66% sector is that single-role posting is the structure most operators default to, and it is the most expensive of the three. In an industry where the next departure is close to certain, recruiting that starts when someone resigns is always paying the premium.
What we cannot tell you
- We cannot tell you what a hospitality departure costs in dollars. The per-departure figures in circulation are built on assumptions about lost productivity and manager time that no restaurant measures. We measure advertising, and deriving a cost per hire from advertising data would be inventing the rest of it.
- We cannot tell you that advertising reduces turnover. It does not. Advertising changes who arrives and how quickly the schedule is covered. If people leave because of the hours or the manager, faster hiring refills the same gap more often.
- We have no published hourly-only figure for hotels. Black Box measures restaurants; BLS measures everyone in the sector. For a hotel's hourly population specifically, the honest answer is that no public benchmark exists and your own payroll is the only source.
Where advertising genuinely helps in this sector is the coverage number rather than the churn number: if half your people will leave voluntarily this year regardless, the lever available to you is how fast and how cheaply the schedule refills. For the hiring side of that — channels, campaign structures and what each one reaches — see hospitality recruiting. For the same reconciliation applied to stores, see retail employee turnover, and for every sector side by side, employee turnover rates by industry.
Frequently asked questions
What is the employee turnover rate in the hospitality industry?
66.0% across 2025 for accommodation and food services, on Bureau of Labor Statistics data. BLS publishes the sector's total separations as an annual average of 5.5% of employment per month, and twelve of those months is 66.0%. That covers every employee and every kind of departure. It is roughly 1.67 times the all-industry rate of 39.6% on the same basis.
Why do sources quote 86%, 92% and 110% for the same industry?
Because they count different people. 86% is close to the 2021 pandemic peak of 85.2%, still quoted as current. 110% is hourly staff in limited-service restaurants and 92% is hourly staff in full service, both from Black Box Intelligence, which measures restaurants only and excludes salaried roles. The narrower and more hourly the population, the higher the figure. None of them is wrong; they are answers to different questions.
Is hospitality turnover still falling?
No. It fell from 85.2% in 2021 to 64.8% in 2024, then rose to 66.0% in 2025 — an increase of 1.2 points. The 2026 seasonally adjusted monthly series has run 5.5%, 5.6%, 5.6% and 5.7% from March to June, at or above the 5.5% that 2025 averaged. Hospitality is the sector where the post-pandemic improvement ran out earliest.
How much of hospitality turnover is voluntary?
76.4% in 2025, the highest voluntary share of any major sector. Quits ran at 4.2% a month against total separations of 5.5%, which is 50.4% of the workforce quitting across the year. Retail's equivalent share is 68.4% and the all-industry figure is 60.6%. Layoffs are not what drives the hospitality number.
Which turnover figure should I compare my restaurant to?
Match the population your own calculation covers. If you count everyone on the payroll, compare to the BLS sector figure of 66.0%. If you count hourly staff only, compare to 110% for limited service or 92% for full service. If you count managers in full service, the published figure is 35%. Comparing an hourly-only internal number to the BLS all-employee rate will make you look far worse than you are.
How long does the average hospitality employee stay?
2.1 years, the median tenure for leisure and hospitality wage and salary workers and the shortest of any industry in the federal data, against 3.9 years across all wage and salary workers. Tenure and turnover measure different things and will not reconcile arithmetically, but they point the same way: this is the sector with the shortest runway to repay any investment in a new hire.
How many roles are open at any one time at 66% turnover?
It depends entirely on how long you take to fill them. Roles open at a given moment is approximately separations per week multiplied by average weeks to fill. On a hundred-person operation at 66% with a four-week fill time, that is roughly five positions standing empty continuously. Halving the fill time halves that number without changing the turnover rate at all, which is why coverage and churn are worth tracking separately.
Does faster hiring reduce hospitality turnover?
Not the rate, no, and we would rather say that than imply otherwise. Faster hiring reduces the coverage gap, which is the number that shows up in the schedule and in the pressure on the people who stayed. There is a plausible indirect path, in that short-staffed shifts are hard on the crew, but we have not measured it and will not claim a figure for it.
Refill the schedule for less than the posting costs you
Bring your locations and the roles you refill most often. We will show you what the event-driven and always-on structures cost across the campaigns in our benchmark, and what your coverage gap above translates to in applicants a month.
Book a Demo