
Nurse Turnover Rate
Hospital RN turnover was 17.6% in 2025, the first increase after three consecutive years of decline, and first-year RNs account for 29.0% of every RN separation. The commonly cited cost of replacing one staff nurse is $60,090. If you have also seen a nurse turnover figure in the thirties, that is a different survey measuring a much wider population, and the two are not interchangeable.
The year nurse turnover stopped falling
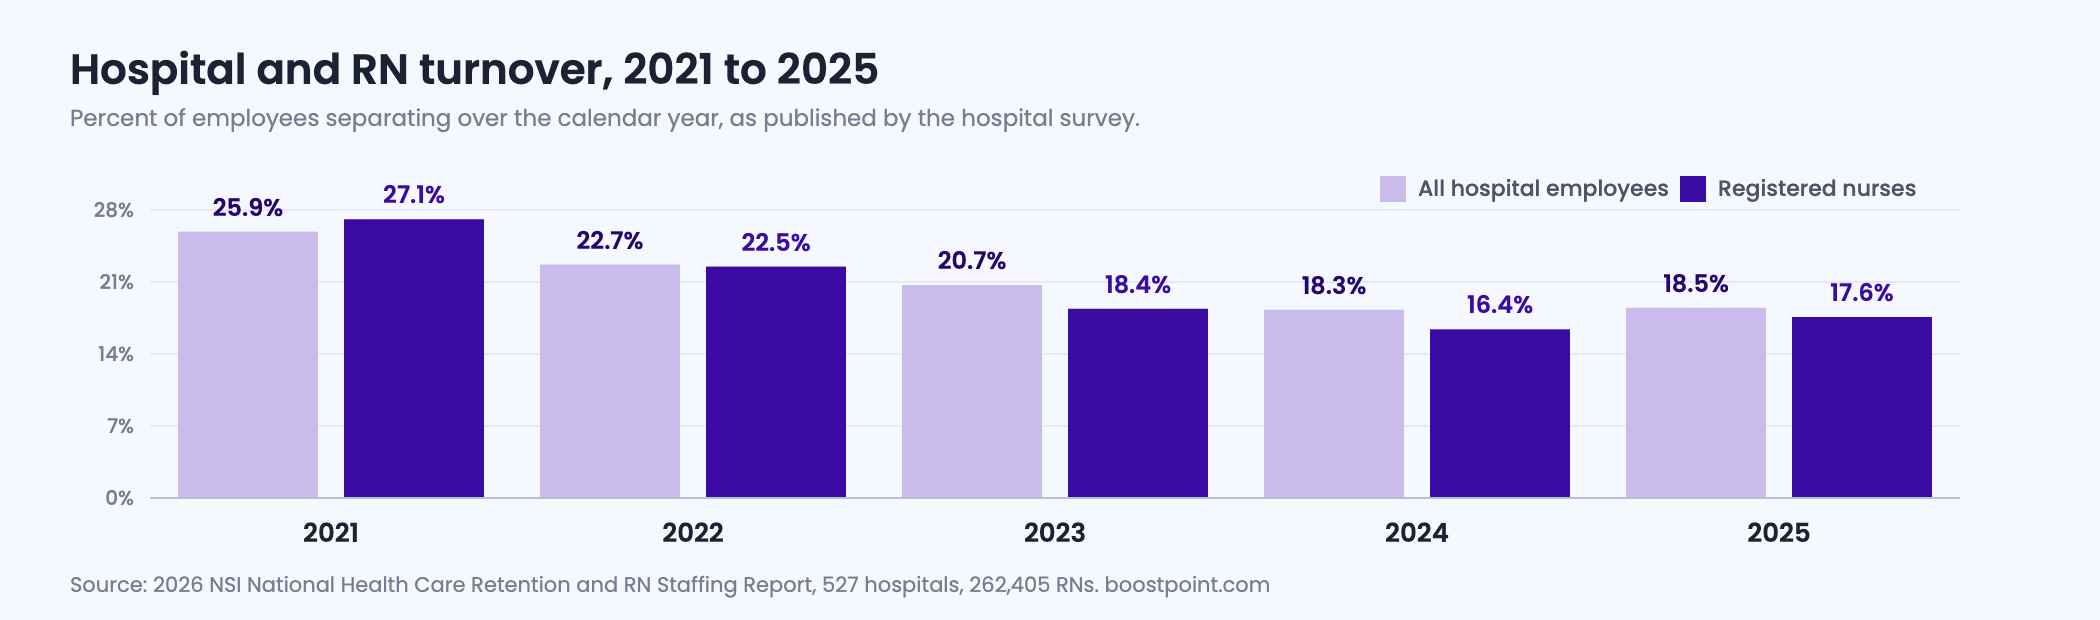
RN turnover peaked in 2021 at 27.1% and then came down hard for three years running: 22.5%, 18.4%, 16.4%. In 2025 it went back up, to 17.6%. Hospital turnover across all employees moved the same way, from 25.9% in 2021 to a low of 18.3% in 2024 and back to 18.5% in 2025.
One year is not a trend, and the 2025 increase is small next to the 2021 peak. What makes it worth noticing is that it arrived while the vacancy rate was still improving, which is not the pattern of a workforce simply running short of people. Nurses left at a slightly higher rate in a year when hospitals were getting better at filling the roles they lost.
Why you will see 17.6% and 34.8% for the same year
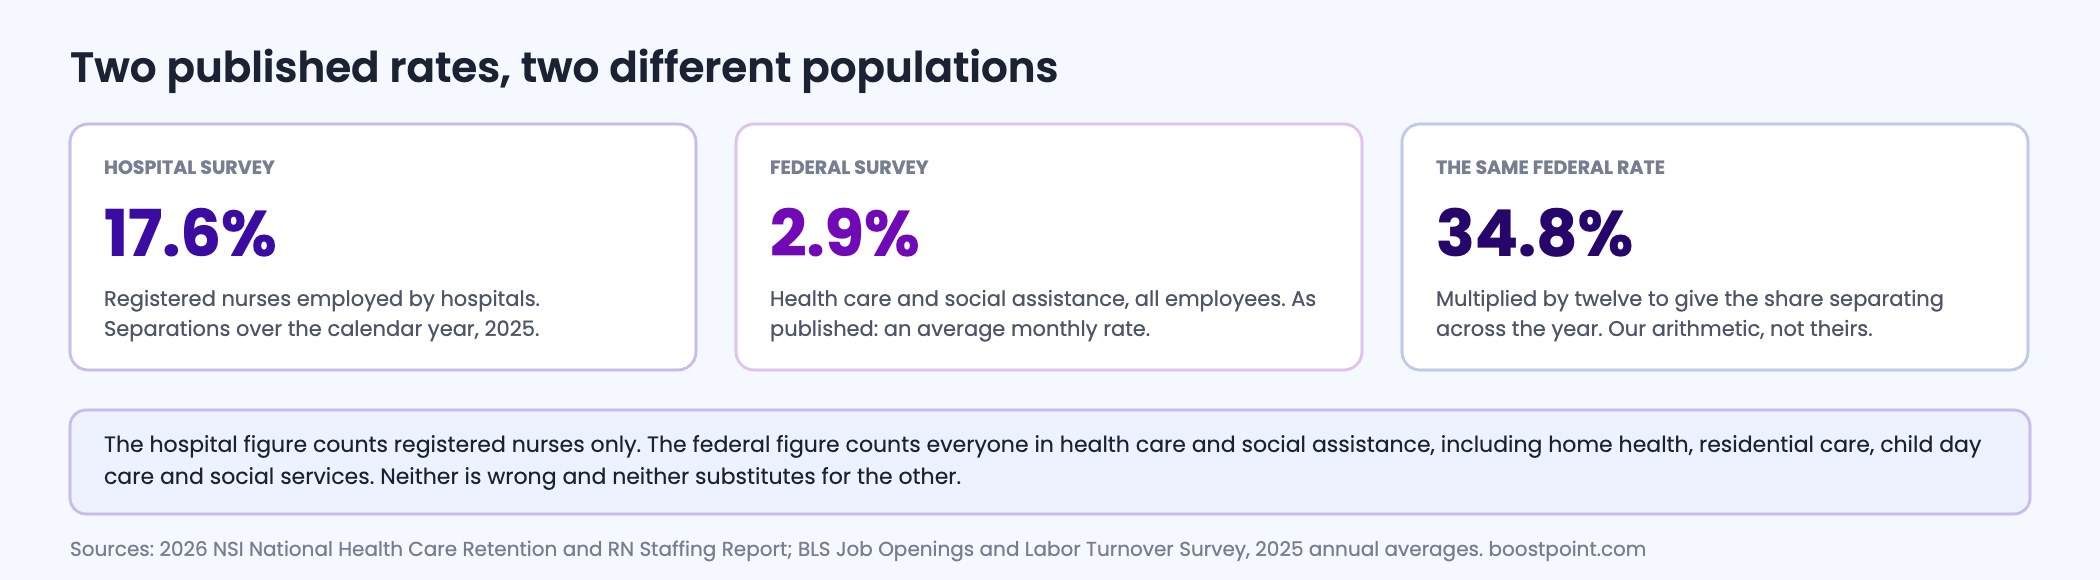
Two credible sources report nurse turnover for 2025 and the numbers look nothing alike. Neither is wrong. They count different people and they publish in different units.
The 17.6% figure comes from a hospital survey: 527 hospitals across forty states, covering 262,405 registered nurses, with turnover defined as separations divided by average employees over the calendar year, excluding temporary, agency and travel staff, and excluding internal transfers. It is an annual rate for hospital-employed RNs.
The federal figure is not about nurses at all. The Job Openings and Labor Turnover Survey publishes health care and social assistance as one industry, which sweeps in home health aides, residential care, child day care and social services alongside hospitals. Its 2025 total separations rate for that industry was 2.9% — and that is an average monthly rate despite carrying an annual label, so the share of the sector's workforce separating across the year is 34.8%. Quits alone were 2.0% a month, or 24.0% across the year.
So one number describes registered nurses inside hospitals, and the other describes everyone employed anywhere in health care and social assistance including the highest-churn frontline roles in the sector. Comparing your nursing unit to the second one will make your retention look excellent for reasons that have nothing to do with your retention. The federal series is set out one industry at a time on employee turnover rates by industry.
Where RN departures actually sit
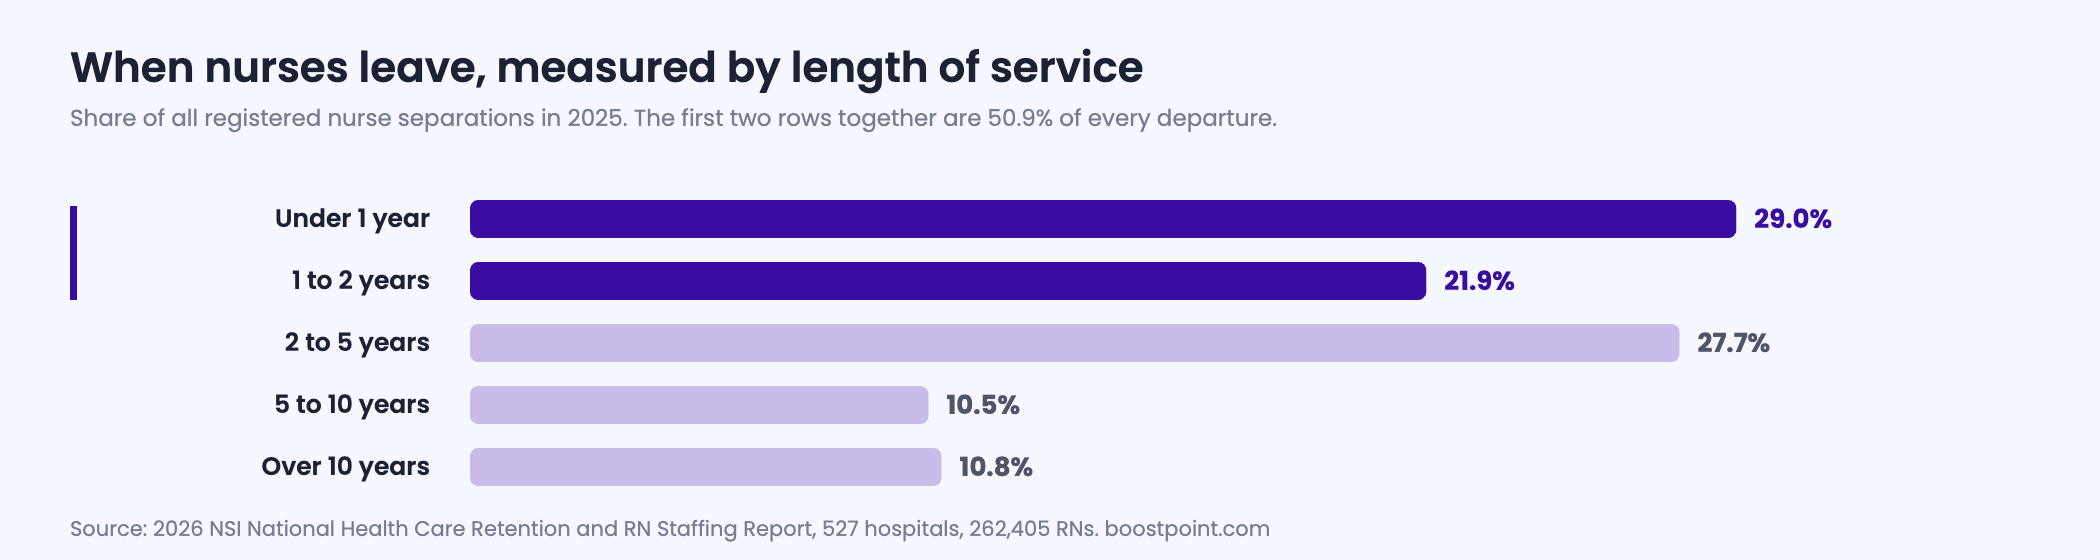
The single most useful line in the hospital data is not the headline rate. It is the tenure profile of who leaves. Of all RN separations, 29.0% happen in the first year of employment, and another 21.9% in years one to two. Just over half of every nurse who leaves has been there under two years.
Read from the other direction: 22.7% of newly hired RNs left within a year of being hired, against 29.5% for hospital employees overall. Departures at five to ten years of tenure account for 10.5% of separations and departures past ten years for 10.8%.
That distribution changes what a retention program should be. A rate of 17.6% invites broad interventions aimed at the whole nursing workforce. The tenure split says the first twelve months carry roughly three times the risk of the years after five, and that onboarding, preceptorship and scheduling in that window are where the rate is actually set.
RN turnover by specialty and region
Specialty spreads the rate by nine points from top to bottom. Behavioral health leads at 22.5% and pediatrics sits lowest at 13.4%. Region matters far less than specialty: the widest regional gap is two and a half points.
| Specialty | Turnover | Region | Turnover |
|---|---|---|---|
| Behavioral health | 22.5% | South-East | 18.7% |
| Emergency | 20.7% | West | 18.4% |
| Telemetry | 19.5% | North-East | 17.9% |
| Step down | 19.0% | South-Central | 17.1% |
| Medical / surgical | 18.1% | North-Central | 16.2% |
| Critical care | 17.6% | — | — |
| Burn center | 17.5% | — | — |
| Women's health | 15.0% | — | — |
| Surgical services | 14.9% | — | — |
| Pediatrics | 13.4% | — | — |
Source: 2026 NSI National Health Care Retention & RN Staffing Report, covering January to December 2025; 527 hospitals in forty states, 262,405 registered nurses. Read August 31 2026.
Specialty detail
Pick a specialty or region
Each selection shows the published 2025 rate, how it sits against the 17.6% national RN rate, and what it means for a unit of a given size.
Departures a year is the published rate applied to the headcount you entered. It is arithmetic on a national average, not a forecast for your organization.
What one RN departure costs
The figure in circulation is $60,090 for the turnover of one staff registered nurse. At the average survey hospital that adds up to a loss of $5.19 million a year, and each single percentage point of RN turnover is worth about $295,000 a year to a hospital of that size.
Treat that number the way its publisher intends: an estimate built from replacement activity across a large sample, not an invoice. It bundles vacancy coverage, orientation and onboarding, lost productivity while a new nurse ramps, and premium labor while the seat is empty. Your own figure moves with how much of that coverage you buy on the open market. Travel rates in the same report run around $91 an hour, which is why the cost of a vacancy is driven less by recruiting than by what you pay to keep the shift covered while it is open. The other standard lever, a sign-on bonus, carries a wage-and-hour consequence most employers do not budget for.
The $295,000 per point is the useful one for a business case, because it converts a retention initiative into the currency a finance team already uses. One point is roughly a dozen nurses a year at a mid-sized hospital.
Work out your own replacement load
Turnover is a workload before it is a percentage. The calculator below turns a rate and a headcount into the number of nurses you have to replace in a year and what that costs at the published per-departure figure. If you still need to work out the rate itself, the turnover rate calculator covers that step and the comparison trap that goes with it.
Replacement load
Your RN turnover, in nurses and dollars
Enter your own rate if you have it. If you do not, the national RN rate is loaded by default.
Cost uses the published per-departure figure of $60,090 unchanged. It is a national estimate applied to your headcount, and it is the only cost figure this tool produces.
The vacancy behind the rate
The RN vacancy rate fell for a third year, to 8.6% from 9.6% in 2024 and 9.9% in 2023. The average responding hospital was carrying forty-three unfilled RN positions. Time to fill an RN vacancy came down five days, to seventy-eight.
Seventy-eight days is the number to hold next to the turnover rate, because it is what turns a percentage into a staffing problem. A unit losing nurses at the national rate and refilling at the national speed spends a meaningful share of every year short-handed, and short-handed units are where the next round of departures is generated. That is the loop retention work has to break. Approaches that attack it from the staffing side are collected in our notes on nursing shortage solutions.
What an RN application costs on social
Recruiting does not fix turnover, and we are not going to claim otherwise. What it does is determine whether the replacement load is met on time or carried as overtime and agency hours. Here is what that part costs in our own data.
| Role family | Median | Middle 50% | Apply rate |
|---|---|---|---|
| Registered nurse | $19.08 | $12.76 – $34.84 | 11% |
| LPN / LVN | $12.77 | $7.53 – $21.46 | 21% |
| CNA / nursing assistant | $7.72 | $6.18 – $12.06 | 18% |
Source: Boostpoint 2026 Social Job Advertising Benchmark — 891 Boostpoint-managed campaigns on Meta (1,334 campaign-months), 2026; advertising costs only. Registered nurse is the most heavily represented role family in the set at 173 campaign-months. Cost per applicant is not cost per hire, and nothing on this page derives one from the other.
Registered nurse is the most expensive of the three by a wide margin and the hardest to convert: eleven percent of the people who click complete an application, against twenty-one percent for LPN roles. That gap is the whole story of nurse recruiting on social. The audience is small, professionally solicited constantly, and slow to fill out forms. What moves it is fewer, better-targeted campaigns rather than more spend.
Widening where you can advertise moves it too. An RN whose primary state of residence is one of the forty compact nursing states can take a job in any of the others without a new license, which is the cheapest way to enlarge the pool a replacement campaign is drawn from.
Set the advertising against the retention number and the proportions are stark. One prevented RN departure is worth more than most nursing units spend advertising in a year. That is an argument for spending on retention first, and it is an argument we are making against our own commercial interest.
Frequently asked questions
What is the average nurse turnover rate?
Hospital registered nurse turnover was 17.6% in 2025 across a survey of 527 hospitals in forty states covering 262,405 registered nurses. Counting only full-time and part-time staff the rate was 14.6%. Hospital turnover across all employees was 18.5%.
Is nurse turnover going up or down?
Down sharply since 2021, but up slightly in the most recent year. RN turnover ran 27.1% in 2021, then 22.5%, 18.4% and 16.4%, before rising to 17.6% in 2025. That 2025 increase is the first in four years and it happened while the vacancy rate was still improving.
Which nursing specialty has the highest turnover?
Behavioral health, at 22.5%, followed by emergency at 20.7% and telemetry at 19.5%. Pediatrics is lowest at 13.4%, with surgical services at 14.9% and women's health at 15.0% close behind. The spread from top to bottom is about nine percentage points, which is far wider than the spread between regions.
How much does it cost to replace a nurse?
The published estimate is $60,090 for one staff registered nurse, which works out to an average loss of $5.19 million a year for a hospital in the survey. Each percentage point of RN turnover is worth roughly $295,000 a year. Those are estimates built from a large sample of replacement activity, not a bill any single hospital receives.
Why do some sources say nurse turnover is over thirty percent?
Because they are quoting the federal survey for health care and social assistance, which covers home health, residential care, child day care and social services as well as hospitals, and which publishes an average monthly rate. That rate was 2.9% a month in 2025, or 34.8% across the year. It is not a nursing figure and should not be compared to a hospital RN rate.
When do nurses leave?
Early. First-year separations account for 29.0% of all RN turnover and years one to two for another 21.9%, so more than half of departing nurses have under two years of service. Separately, 22.7% of newly hired registered nurses left within twelve months of being hired.
Are travel and agency nurses counted in these rates?
No. The hospital survey excludes temporary, agency and travel staff from its turnover calculation, and it does not count internal transfers as separations. If your own number includes agency conversions or moves between units, part of any difference from the published rate is definitional rather than a difference in retention.
What is a good nurse turnover rate?
There is no published threshold and any single number offered as one has been invented. The defensible comparison is your own specialty line against the specialty average, held over a full year, with first-year departures split out from the rest. A unit at 17% whose losses are all new graduates has a different problem from a unit at 17% losing ten-year veterans.
When the turnover rate is a hiring plan
Every point of nurse turnover is a number of shifts that has to be refilled on a deadline. Keeping that pipeline full is the part we measure.
If replacing departures means writing the postings as well as running them, our registered nurse job description template and the rest of our job description library are free to copy.





Hospital nursing figures: 2026 NSI National Health Care Retention & RN Staffing Report, published March 2026 and covering January to December 2025, read August 31 2026 — 527 hospitals in forty states, 965,886 health care workers and 262,405 registered nurses; RN turnover 17.6% (14.6% full-time and part-time only), hospital turnover 18.5%, first-year RN turnover 22.7%, RN vacancy rate 8.6%, forty-three unfilled RN positions per hospital, seventy-eight days to fill, cost of turnover for a staff RN $60,090, average annual loss $5.19 million, $295,000 for each percentage point, travel rates around $91 an hour. Turnover is defined in that report as separations divided by average employees, excluding temporary, agency and travel staff, and excluding internal transfers. Sector figures: U.S. Bureau of Labor Statistics, Job Openings and Labor Turnover Survey, 2025 annual averages for health care and social assistance, not seasonally adjusted, read August 29 2026 — total separations 2.9% and quits 2.0%. Those published rates are average monthly figures; the 34.8% and 24.0% across-the-year figures are the published rates multiplied by twelve, which follows from the survey's definition of the annual average rate as summed monthly levels over summed monthly employment. BLS does not publish the figures in that form and the multiplication is ours. Advertising figures: Boostpoint 2026 Social Job Advertising Benchmark — 891 Boostpoint-managed campaigns on Meta across 1,334 campaign-months in 2026, advertising costs only; registered nurse median $19.08 with a middle half of $12.76 to $34.84 across 173 campaign-months, LPN and LVN median $12.77, CNA median $7.72. Cost per applicant is not cost per hire, and no cost per hire is derived from it anywhere on this page. Replacement-load figures produced by the calculators on this page are arithmetic on a rate and a headcount you supply, not measured values. Last updated August 2026.