Employer guideRead at source, 3 September 2026
Farm Labor Shortage 2026: H-2A Dependence, Wage Trends and What Growers and Co-ops Pay to Recruit
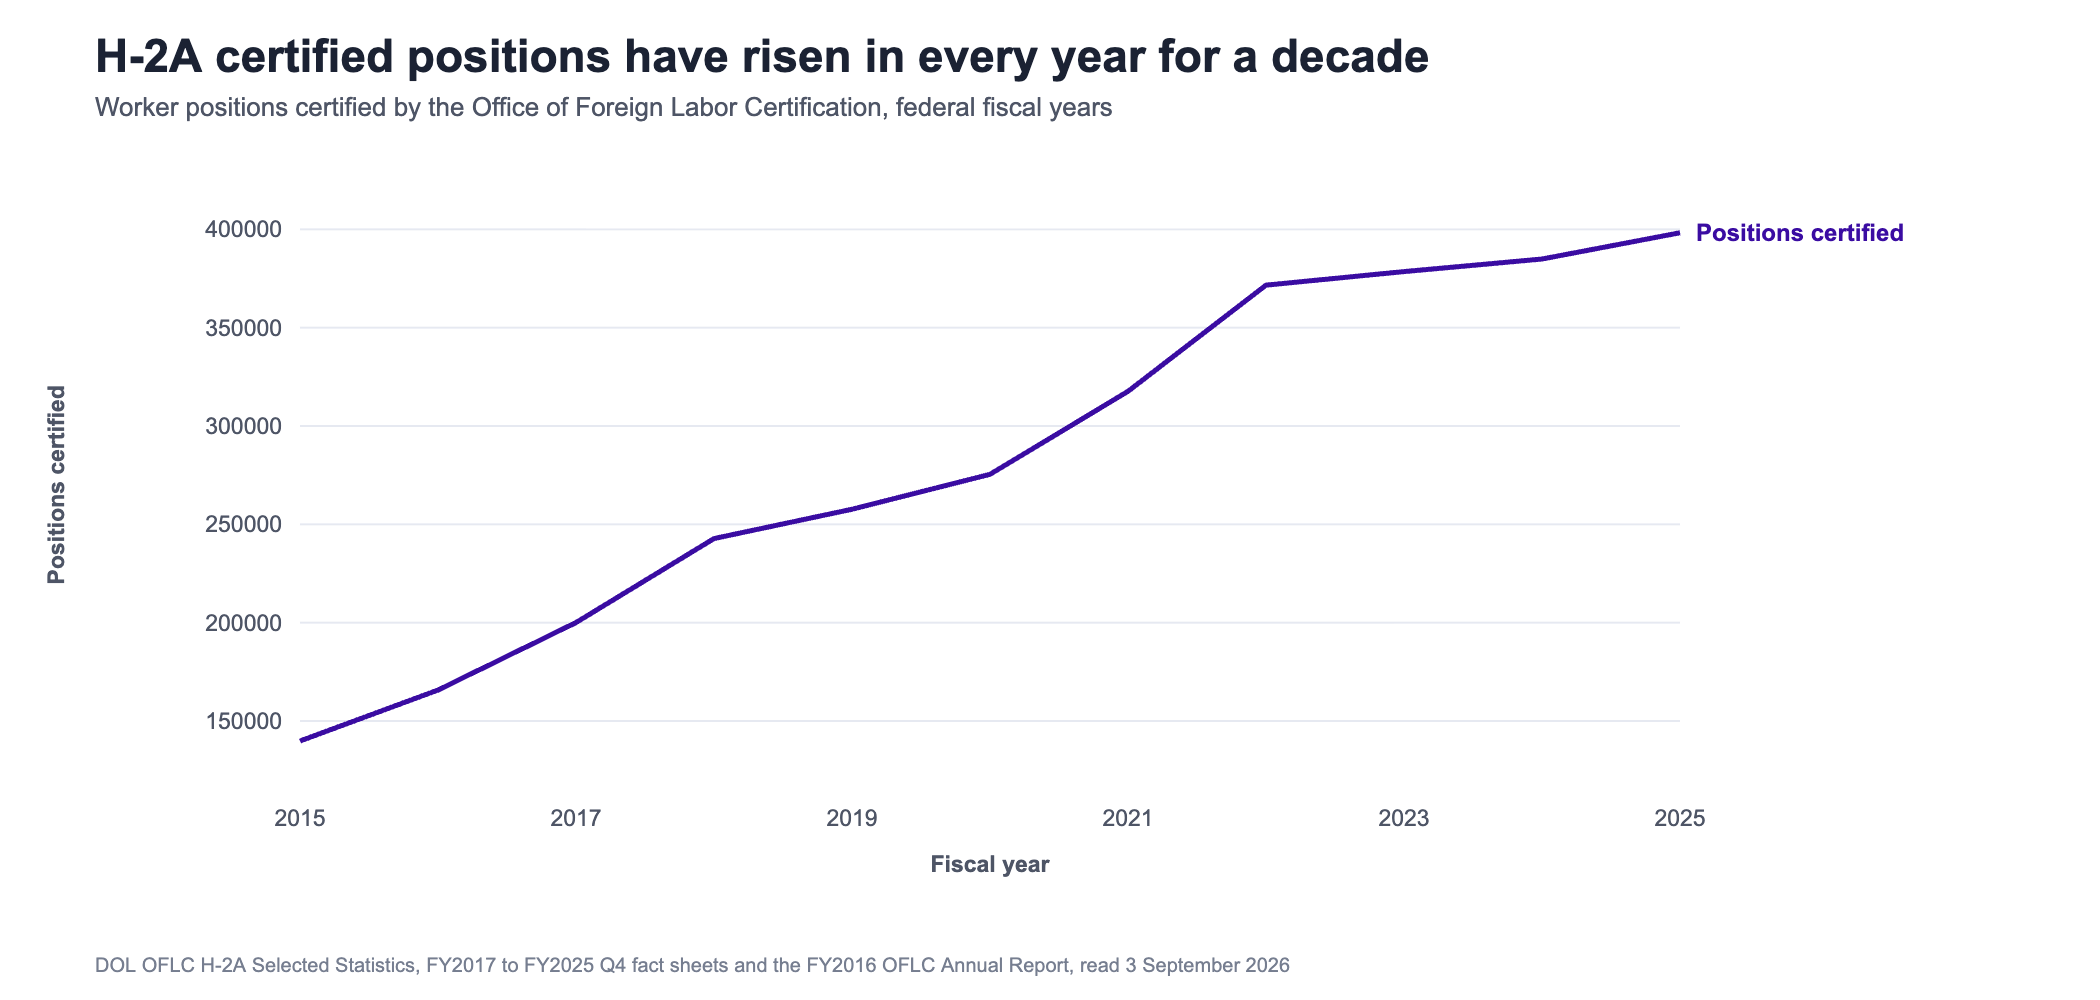
Three things happened in the last thirteen months that change how this question should be answered. H-2A certified positions reached 398,258 in fiscal 2025, up 185 percent in a decade. The federal survey that set the H-2A wage floor was discontinued on 28 August 2025, so its replacement was built on different data in an interim final rule. And on 26 August 2026 a federal court held that replacement methodology unlawful; the Department of Labor published its compliance position on 2 September 2026, confirming that current wage rates stand until new ones are issued and that a contingent back-pay period opened that day. If you employ H-2A workers, that last paragraph is nine days old and is the most important thing on this page. Everything here was read at USDA, the Department of Labor or the Federal Register on 3 September 2026.
H-2A is the only part of this labor market that is unambiguously growing
The Office of Foreign Labor Certification publishes positions certified each fiscal year, which is the number of worker positions approved, not applications and not visas issued. That series has risen every single year for a decade: 139,832 in fiscal 2015 to 398,258 in fiscal 2025. Three quarters into fiscal 2026, through 30 June, another 349,867 had been certified. Concentration is extreme in two directions: 82 percent of fiscal 2025 positions were a single occupation, farmworkers and laborers in crop, nursery and greenhouse work, and the top five states took 49 percent of the national total.
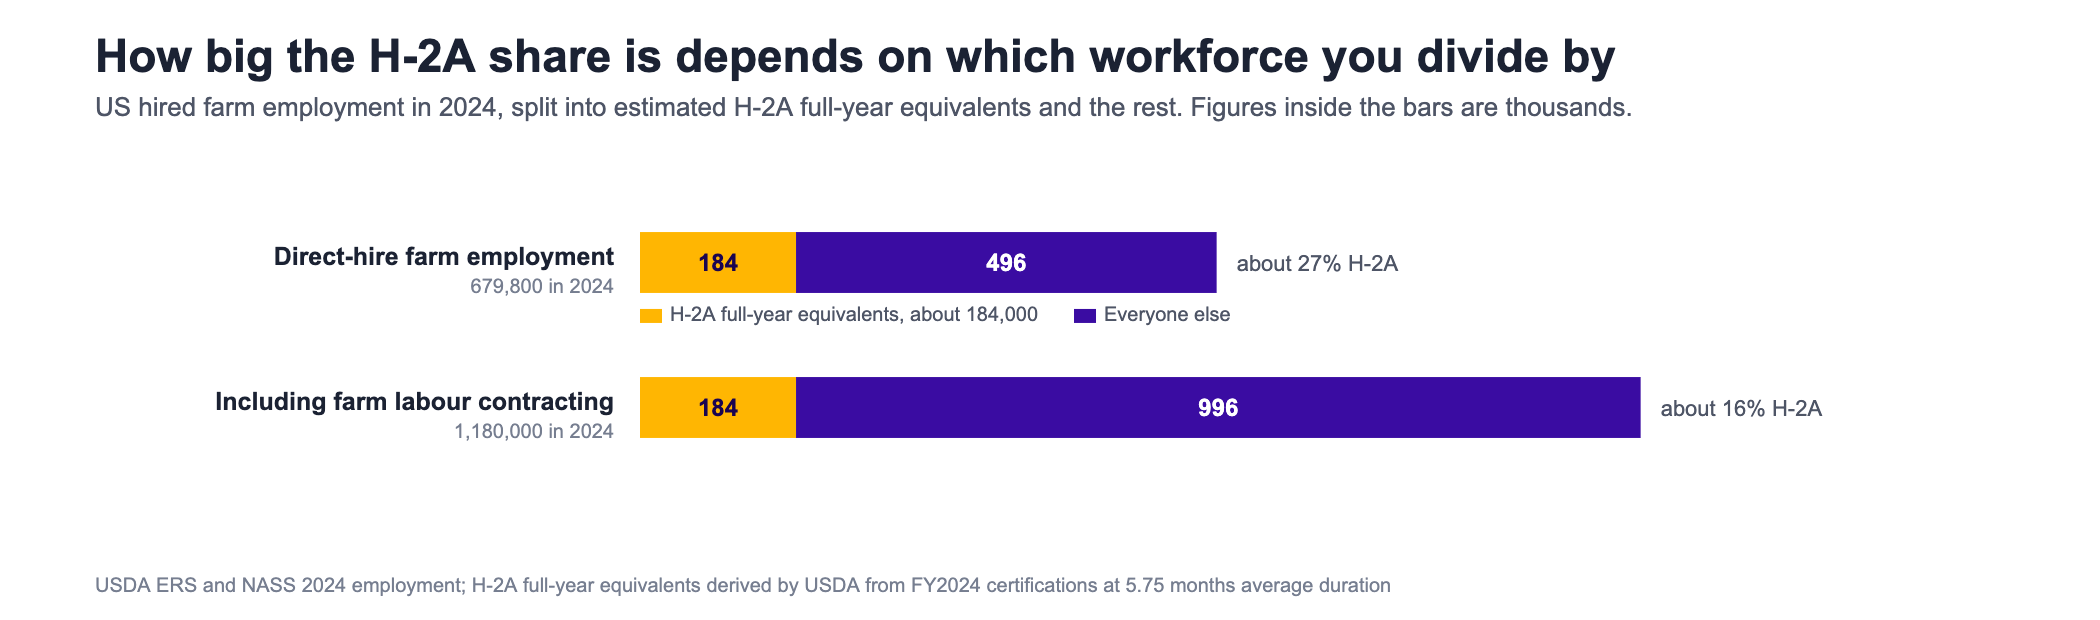
Certified positions are not people and not full-time jobs. USDA converts them: the 385,000 positions certified in fiscal 2024 averaged 5.75 months and amount to roughly 184,000 full-year equivalents, against about 315,500 visas actually issued. Put that beside hired farm employment and the dependence becomes measurable. Against the direct-hire count of 679,800, 184,000 full-year equivalents is about 27 percent; against the broader 1.18 million measure that includes farm labor contractors, about 16 percent. Both of those are our arithmetic on published figures, not numbers USDA prints.
| State | FY2025 positions certified | Share of national | FY2026 through Q3 |
|---|---|---|---|
| Florida | 56,934 | 14.3% | 35,193 |
| Georgia | 42,723 | 10.7% | 39,586 — now first |
| California | 35,138 | 8.8% | 31,467 |
| Washington | 34,560 | 8.7% | 33,228 |
| North Carolina | 26,123 | 6.6% | 25,704 |
| Michigan | 16,038 | 4.0% | 14,694 |
| Texas | 15,945 | 4.0% | 15,278 |
| Louisiana | 14,631 | 3.7% | 11,965 |
| Arizona | 13,935 | 3.5% | Out of the top ten |
| New York | 10,658 | 2.7% | 8,865 |
| United States | 398,258 | 100% | 349,867 |
What happened to the wage floor, and what the court did nine days ago
For decades the Adverse Effect Wage Rate — the minimum an H-2A employer must offer, set so that foreign labor does not undercut domestic wages — was calculated from the USDA Farm Labor Survey. That survey was discontinued with effect from 31 August 2025, the agency describing the collection as duplicative or no longer necessary. Its final release was 21 May 2025 and its last annual averages are for 2024.
The Department of Labor replaced the methodology by interim final rule at 90 FR 47914, published and effective 2 October 2025, switching from the farm survey to Bureau of Labor Statistics occupational wage data and splitting each state into two skill levels, with a lower rate for H-2A workers where the employer provides housing. Rates for 2026 were issued at 91 FR 48946 on 3 August 2026. No final rule has been published; it remains an interim rule.
The 2 September 2026 notice, in the Department own words
On 26 August 2026 the United States District Court for the Eastern District of California held the interim rule methodology unlawful. The Department published its compliance position on 2 September 2026. As the Department describes it: the court did not vacate the rule and left the rates already issued in place; the current rates remain in effect until new ones are published; the Department was directed to produce a new methodology promptly; and employers may later owe wage adjustments for a back-pay period running from 2 September 2026 until new rates issue, if workers were paid below the eventual new rate. The Department states that no employer is under an obligation at this time to pay any back wages, and says it is considering next steps. We are not lawyers. What we can tell you is that the exposure window is open, it is dated, and your payroll records for this period are the evidence.
There is a second, unrelated piece of litigation to keep separate from that one: an injunction in a Georgia federal court restricts enforcement of the 2024 farmworker protection rule against certain states and entities, and it is why the August 2026 rate notice carries two effective dates, 3 August for most employers and 17 August for those covered by that order.
There is no longer one wage rate per state
This is the practical consequence of the methodology change and it catches people out. Under the old rule a state had a single field and livestock rate. Under the current one it has four: skill level one and skill level two, each in a version for domestic workers and a lower version for H-2A workers where housing is provided. Any source telling you the 2026 rate for your state is quoting one of four numbers without saying which. All four, for every state, are on our H-2A program page.
| State | Level I, domestic | Level II, domestic | Level I, H-2A | Level II, H-2A |
|---|---|---|---|---|
| Washington | $16.93 | $19.62 | $14.49 | $17.18 |
| California | $16.59 | $18.60 | $13.52 | $15.53 |
| New York | $16.17 | $19.25 | $13.62 | $16.70 |
| Arizona | $15.13 | $17.75 | $13.13 | $15.75 |
| Michigan | $14.45 | $17.64 | $13.06 | $16.25 |
| Florida | $13.17 | $15.71 | $10.87 | $13.41 |
| North Carolina | $12.84 | $16.82 | $11.15 | $15.13 |
| Georgia | $12.57 | $16.49 | $10.80 | $14.72 |
| Texas | $12.27 | $16.24 | $10.40 | $14.37 |
| Louisiana | $10.42 | $15.81 | $9.14 | $14.53 |
| Lowest and highest nationally | Mississippi $9.95 | Alaska $20.83 | Average rate used for labor contractor bonds: $15.96 | |
One warning about comparing years. Because the structure changed, setting a 2023 single rate beside a 2026 level one rate manufactures a wage cut that is an artefact of the methodology; several states show a level one rate below their 2020 figure. Level two is the honest comparator, and on that basis Georgia moved from $11.71 in 2020 to $13.67 in 2023 to $16.49 in 2026, and North Carolina from $12.67 to $14.91 to $16.82. Range occupations, which were never survey-based, grew cleanly from $1,682.33 a month in 2020 to $2,132.41 in 2026.
H-2A dependence and wage floor, by state
The domestic workforce the program sits on top of
Hired farm employment has been rising, not falling, which is not what the shortage language implies. USDA puts it at 1.18 million in 2024, up 10 percent from 1.07 million in 2010 on the broader measure that includes farm labor contracting. The direct-hire count was 679,800 in both 2023 and 2024, which is flat rather than falling. What has changed is the composition and the price.
On composition, the National Agricultural Workers Survey for fiscal 2020 to 2022 found crop farmworkers were 32 percent United States born, 7 percent naturalised citizens, 19 percent other authorized immigrants and 42 percent without work authorization. That survey excludes H-2A workers and livestock workers, so it describes the domestic crop workforce specifically. The unauthorized share has fallen from a peak near 55 percent around the turn of the century. And the workforce is ageing in one direction only: the average age of foreign-born farmworkers rose by close to seven years between 2006 and 2022, while the average for United States born farmworkers held roughly constant.
On price, farm wages have been closing on the rest of the economy. The average nonsupervisory farm wage was $18.12 an hour in 2024, against $13.99 in 2019. Measured against private nonfarm nonsupervisory pay, the farm wage has gone from about half in 1990 to about 60 percent in 2024, $18.12 against $30.13 in constant dollars. Real farm wages grew 1.9 percent a year over the last decade against 1.2 percent a year across the whole period since 1990 — which USDA notes is consistent with growers reporting that workers had become harder to find.
A number worth not repeating
A figure of 2.4 million open agricultural jobs circulates widely in coverage of this subject, including in the results that rank above this page. Set it against USDA total hired farm employment of 1.18 million. A count of unfilled positions cannot be double the size of the entire workforce those positions sit in. Whatever that figure measures — and it may well be a real statistic about something — it is not vacancies, and it should not be used as though it were.
The agriculture labor shortage in the federal projections: every opening is a replacement
The USDA series above describes the workforce as it stands. The Bureau of Labor Statistics projections add the other half of the agriculture labor shortage: how many people the work needs each year. BLS counts 831,900 agricultural workers in 2025 and projects the group to shrink 2 percent, by 13,300 jobs, by 2035. It still projects about 111,500 openings a year. Because employment is falling, none of those openings come from growth. In the Bureau’s words, all of them are expected to result from the need to replace workers who transfer to other occupations or exit the labor force. That is about 13 percent of the workforce refilled every year.
| Occupation | Employed 2025 | Projected change to 2035 | Median pay, May 2025 |
|---|---|---|---|
| Farmworkers and laborers, crop, nursery and greenhouse | 546,800 | −13,200 (−2%) | $35,660 |
| Farmworkers, farm, ranch and aquacultural animals | 202,100 | −6,400 (−3%) | $36,670 |
| Agricultural equipment operators | 66,900 | +5,700 (+9%) | $41,730 |
| Agricultural workers, all other | 9,300 | +400 (+4%) | $39,850 |
| Animal breeders | 6,900 | +200 (+3%) | $51,130 |
| All agricultural workers | 831,900 | −13,300 (−2%) | $35,890 |
Two things in that table matter for a hiring plan. The two farmworker occupations lose 19,600 jobs between them over the decade, while the only line growing by more than a few hundred is equipment operators, up 5,700 — a different hire at a higher rate than the hand crew. And a shrinking occupation is not an easier one to hire in: every one of those 111,500 openings a year is somebody’s leaver, which is why the recruiting calendar below matters more than the headcount trend.
What domestic recruiting costs, and when
Here is our own data, labeled as ours. Across Boostpoint agricultural campaigns in 2025 and 2026, cost per applicant runs $10.06 blended with a median campaign of $10.49, and it varies more by role than most people expect: seasonal roles $5.93, plant and grain operations $5.56, mechanic and service technician $9.19, applicator and agronomy $10.83, and CDL driver $21.13 — roughly four times a plant operator.
The larger effect is not the role at all, it is the calendar. The same campaign that costs $15.68 an applicant launched in May costs $5.58 launched in August, because every operation in a region competes for the same rural pool in the same eight-week window. We have that curve month by month on the agricultural recruiting cost curve page and will not repeat it here, but the planning implication belongs on this one: the H-2A calendar and the domestic advertising calendar are the same calendar, and the cheapest domestic applicants are the ones you buy before you know exactly how many you need.
Price a season refill
The rest of the picture sits on three neighboring pages: the posting itself on the farm worker job description, the geography problem on rural hiring, and the same replacement-versus-growth arithmetic in a different industry on the construction labor shortage. If you are paying for training, some of it is fundable: see workforce development grants.
Refilling the crew before the season: the order that works
Most operations use some mix of the same steps, in roughly this order. The order matters because the cheap options expire as the season approaches. The full hiring guide, from timing to rural reach to when H-2A fits, is on how to hire farm workers.
- Start with last season’s crew. A returning worker needs no training, knows the ground and costs nothing to reach. Text them before you advertise to anyone new, with the start date and the rate, and keep a current phone number for every worker at the end of each season, not the start of the next one.
- Launch domestic advertising before the peak. In our agricultural campaigns the same campaign cost $15.68 an applicant launched in May and $5.58 launched in August. Buying applicants early is cheaper than buying them in the same weeks as every other grower in the region.
- Put the terms in the ad. Hourly or piece rate, hours a week, how many weeks, whether housing and transport are provided, and where the work is. Write it in the language your crew speaks. An ad without the rate is competing with every job that has one.
- Keep the application short enough to finish on a phone. Name, phone number, the dates they are available and the kind of farm work they have done. Everything else can wait for the call, and the call should come within a day.
- If you need H-2A, work backward from the date of need. The job order goes to the National Processing Center no more than 75 and no fewer than 60 calendar days before the first date of need (20 CFR 655.121(b)), and the certification application no less than 45 days before it (20 CFR 655.130(b)). Domestic recruiting is part of the program, not an alternative to it: the employer must accept referrals and hire qualified U.S. applicants, and once the H-2A workers depart for the job must keep hiring qualified U.S. workers who apply until half the contract period has elapsed, with an exception for small employers (20 CFR 655.135). The costs and rates are on our H-2A program page.
Whatever mix you use, record where every hire came from and what they cost. By the second season that record tells you how much of the crew you can fill domestically, which decides how many H-2A positions you actually need to certify.
Farm labor shortage solutions
The data above says the domestic farm workforce is not shrinking fast, H-2A is growing, and the wage floor is in flux. The solutions that follow from that are about timing and retention as much as supply:
- Keep last season’s crew. A returning worker is the cheapest hire there is. End-of-season bonuses paid on the last day, a firm rehire offer, and a current phone number for everyone are worth more than any campaign.
- Recruit domestically, and time it. In our agricultural campaigns the same campaign cost $15.68 an applicant launched in May and $5.58 launched in August. Launch when competition for crews in your region is lowest, not when the need is most urgent.
- Use H-2A where the math works, and plan it backward. The program adds housing, transport and the three-quarters guarantee to the wage; the H-2A program page prices it. Domestic recruiting continues alongside it.
- Mechanize the tasks that allow it. Where harvest or packing can be mechanized, the labor need shifts from many seasonal hands to fewer skilled operators, which is a different recruiting problem, not a smaller one.
- Make the job easier to say yes to. The rate, the weeks, housing and transport in the first lines of the ad, in the crew’s language, and a short application.
Frequently asked questions
“Agricultural labor shortage” is the right phrase for the wrong mechanism
Employers, trade press and policy writing all use “agricultural labor shortage” and “farm labor shortage” interchangeably, and they mean the same thing: growers cannot get the crew they need at the wage and on the terms they are offering. What the phrase implies — that the people have gone — is the part the federal data does not support.
Three findings from the figures above, put together, describe what is actually happening:
- The workforce has not shrunk. Hired farm employment has risen, not fallen, over the last decade and a half.
- The wage gap has narrowed, and the work is still paid well below the alternative. The farm wage has gone from about half of nonfarm nonsupervisory pay to roughly 60 percent. Closing four-tenths of a gap is real progress and it is still a 40 percent discount on the other job in the same county.
- The legal composition is the constraint. With a large share of the crop workforce lacking work authorization, the domestic pool that a grower can lawfully and reliably hire is much smaller than the total number of people doing the work — which is why H-2A certifications have risen every year for a decade while employment has been broadly flat.
So “shortage” here describes a shortage of lawfully available workers at the offered wage within commuting distance of the farm, which is four constraints, not one. That distinction matters practically, because each constraint has a different response and only one of them is a recruiting problem.
| If the binding constraint is… | The response is… | Is it a recruiting problem? |
|---|---|---|
| Work authorization in your local pool | H-2A, or contracting with an H-2A labor contractor | No. It is a filing and housing problem |
| The wage floor against competing local employers | Rate, piece rate, or the non-wage terms — hours, transport, housing | Partly |
| Nobody within commuting distance knows the job exists | Advertising, in the language your workforce uses, timed to the season | Yes, and this is the cheapest of the four to fix |
| Seasonality — you need 40 people for nine weeks | Returning-crew retention, staggered starts, and recruiting before the calendar forces it | Yes |
The common error is to treat the whole thing as constraint one when a farm has never seriously attempted constraint three. A domestic recruiting campaign that has never run is not evidence that domestic workers are unavailable — and unlike the H-2A route, it can be tested in a fortnight for a known cost.
Is there a farm labor shortage in 2026?
The federal data does not show a shrinking workforce. USDA puts hired farm employment at 1.18 million in 2024, up 10 percent since 2010, and the direct hire count was flat at 679,800 across 2023 and 2024. What has grown is the guest worker program, from 139,832 certified positions in fiscal 2015 to 398,258 in fiscal 2025, and the price of labor, with the average farm wage rising from 13 dollars 99 an hour in 2019 to 18 dollars 12 in 2024.
How many H-2A workers are there?
The Department of Labor certified 398,258 positions in fiscal 2025 and 349,867 in the first three quarters of fiscal 2026. Positions are not people: certifications averaged 5.75 months in fiscal 2024, so the 385,000 certified that year worked out at roughly 184,000 full year equivalents, and about 315,500 visas were actually issued. Around 80 percent of certified positions become visas.
What is the AEWR for 2026?
There is no longer a single figure per state. Since the October 2025 interim final rule each state has four non range rates: entry and experienced skill levels, each with a lower version for H-2A workers where housing is provided. Across the states they run from 9 dollars 95 an hour at the entry level in Mississippi to 20 dollars 83 at the experienced level in Alaska. Range occupations are set separately at 2,132 dollars 41 a month.
Did a court strike down the AEWR rule?
On 26 August 2026 a federal district court in California held the interim final rule methodology unlawful. According to the Department of Labor compliance notice of 2 September 2026, the court did not vacate the rule, the rates already issued stay in effect until new rates are published, and the Department must produce a new methodology promptly. The Department also states that no employer is under an obligation at this time to pay back wages. This is a summary of a published notice, not legal advice.
What is the back pay period employers are being warned about?
The Department of Labor notice describes a period running from 2 September 2026 until new wage rates are published, during which employers may later owe adjustments if workers were paid below the eventual new rate. The Department says no obligation exists at this time and that it is considering next steps in the litigation. The practical point for an employer is that payroll records covering this period are what any later adjustment would be calculated from.
Why is the farm labor data all from 2024?
Because the survey behind it was discontinued. USDA announced on 28 August 2025 that it was ending the Agricultural Labor Survey, describing the collection as duplicative or no longer necessary. Its final release was 21 May 2025 and its last annual averages cover 2024. The same survey was the basis of the H-2A wage floor, which is why the methodology had to be rebuilt on different data.
How many farmworkers are foreign born?
The National Agricultural Workers Survey for fiscal 2020 to 2022 found that 32 percent of crop farmworkers were United States born, 7 percent were naturalised citizens, 19 percent were other authorized immigrants and 42 percent held no work authorization. That survey covers crop work and excludes H-2A workers and livestock workers, so it describes the domestic crop workforce rather than everyone working on a farm.
What does it cost to recruit farm workers domestically?
In our 2025 and 2026 agricultural campaigns, 10 dollars 06 an applicant blended, with seasonal roles at 5 dollars 93 and CDL drivers at 21 dollars 13. Timing moves it more than role does: a campaign launched in May cost 15 dollars 68 an applicant and the same campaign launched in August cost 5 dollars 58. Those are advertising costs and buy applicants rather than hires.
How much does an H-2A visa cost the employer?
Four costs, and the fees are the smallest of them. The Department of Labor certification fee is $100 plus $10 for each worker certified, capped at $1,000 per certification (20 CFR 655.163). The USCIS petition on Form I-129 is $1,090 for up to 25 named beneficiaries, $530 where beneficiaries are unnamed, or $460 for a small employer or nonprofit, plus an Asylum Program Fee of $600, reduced to $300 for small employers and waived for nonprofits (8 CFR 106.2). Then come the obligations that actually dominate the bill: the Adverse Effect Wage Rate set out above, plus housing, inbound and outbound transportation and subsistence, tools, and the three-quarters guarantee.
Is an agricultural labor shortage the same as a farm labor shortage?
They are the same phrase for the same problem: growers cannot get the crew they need at the wage and on the terms offered. What both phrases imply — that the workers have disappeared — is not what the federal data shows. Hired farm employment has risen over the last decade and a half, so the binding constraints are wage, work authorization, distance and seasonality rather than the number of people.
Is the agricultural labor shortage a shortage of workers or of wages?
Mostly neither on its own. It is a shortage of lawfully available workers at the offered wage within commuting distance, in a season that lasts weeks rather than months — four constraints, each with a different response. Work authorization is answered by H-2A and is a filing and housing problem; wage is answered by rate and non-wage terms; distance and awareness are answered by advertising; seasonality is answered by returning-crew retention and earlier starts.
What are the solutions to the farm labor shortage?
Keep and rehire last season’s crew, recruit domestic workers before the regional peak when applicants cost less, use H-2A where the full cost works and plan it backward from the date of need, mechanize the tasks that allow it, and put the rate, weeks, housing and transport in the ad.
Crew list short for the season?
Domestic seasonal applicants cost the least when you buy them early and the most when the whole region is bidding at once. We run the ads where rural workers actually are, and tell you what each applicant cost.
Book a Demo