
Rural Hiring, Small-Town Recruiting and Co-op Hiring: The Pool Is Employed, the Circle Is Small, and the Ad Has to Travel
To recruit hourly workers in a rural area, lean on referrals, then run a social job ad aimed at the commute area rather than the town, and cap the budget so the same people don’t see it too often: in Boostpoint’s 2026 Social Job Advertising Benchmark the median campaign cost $13.88 per applicant, rising to $26.78 once monthly frequency passed 4.0. Rural hiring — for a co-op, a county hospital, a plant at the edge of a town of 4,000 — is a geometry problem before it's a channel problem. The USDA counts 46.2 million people in nonmetro America, 13.6% of the country, and its nonmetro unemployment rate was 4.0% in 2024: the pool is small and it's employed. The ad platform then draws a 15-mile minimum circle around any town you target, so a campaign for a town of 6,000 adults saturates in days — CHS's rural campaigns bought impressions at a CPM of $14.87 against $40.32 in dense markets but ran at a frequency of 5.4 against 2.3 and cost roughly three times the blended figure. The fixes are to target the commute, not the town; cap budget to what the circle absorbs; and, for agriculture, time the ad to the curve. Co-op hiring here means the agricultural cooperative, and its department-by-department playbook is on the co-op page. The farm labor supply data behind rural thinness, including H-2A dependence and the 2026 wage rules, is on our farm labor shortage page.
A note on who's writing this
Boostpoint runs recruitment campaigns for rural employers — co-ops across the plains, senior living in county seats, plants in towns with one stoplight — and the honest lesson from that work is on this page: rural is possible, not cheaper. The rural figures are the USDA Economic Research Service's, from Rural America at a Glance: 2025 Edition. The co-ops named (CHS, Insight FS, Mid Kansas Co-Op) have agreed to be named; their figures and the agricultural cost curve come from an earlier campaign-level analysis of one season across four co-ops, labeled as such throughout and directional rather than a forecast. The seasonality we publish is agricultural; we make no seasonal cost claim for trades or drivers, because we haven't measured one. Cost per applicant is not cost per hire.
The case for the small town, made first
Rural employers have one recruiting asset no metro employer has: everybody knows who's hiring. The referral network in a town of 4,000 is the town. The co-op's members are the parents of the seasonal crew; the hospital's CNAs went to school with the plant's line leads; the elevator manager knows which farm kid just turned eighteen. A rural employer that runs a referral program with a bonus that pays in installments, shows up at the high school's career day, and keeps a text list of last year's seasonal crew will fill most of its roles most years without an ad. The case for advertising in a small town is the remainder: the role the network can't fill (an applicator, a mechanic, an RN), the year the crew moved away, the new location with no network yet, and the plain fact — the USDA's, below — that most of the people you want are working somewhere else in the same county and aren't looking.
What "rural" is, in the USDA's numbers
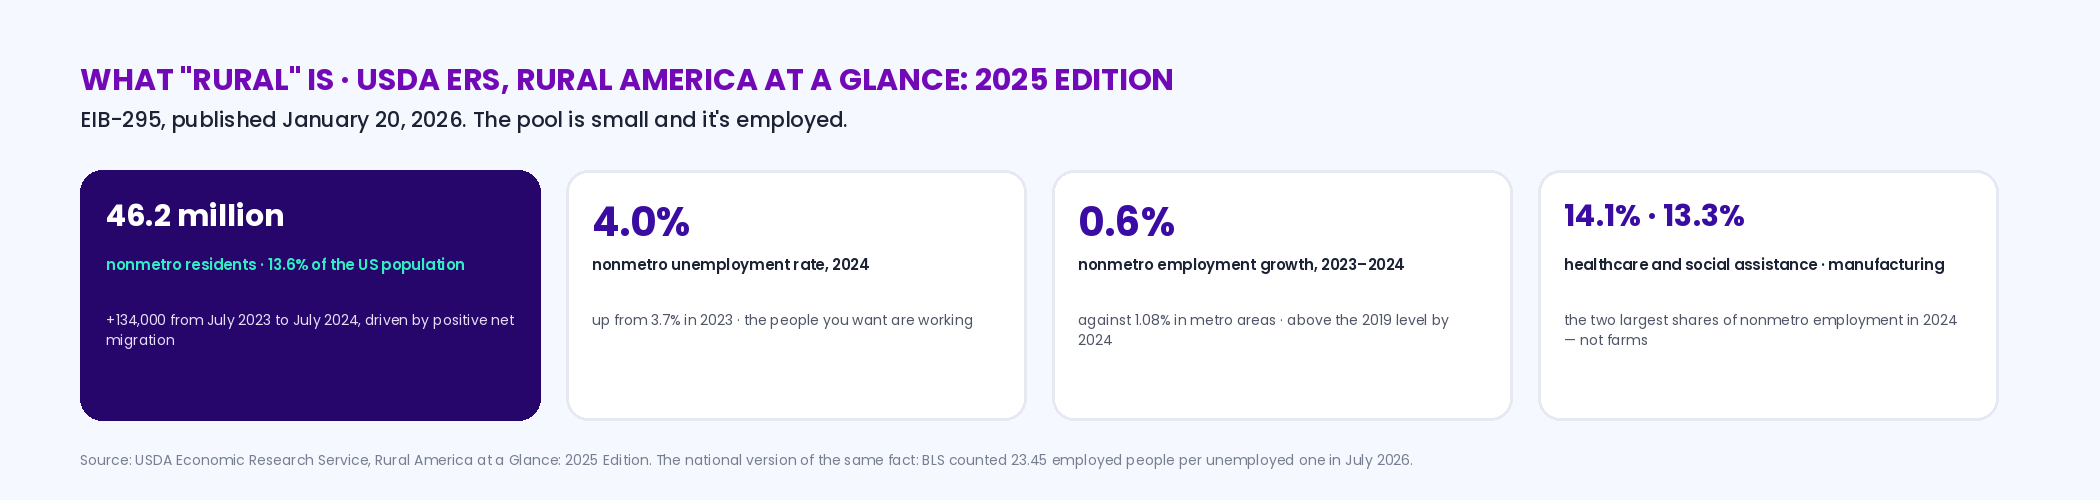
The Economic Research Service's Rural America at a Glance: 2025 Edition, published January 20, 2026, puts nonmetro population at "46.2 million people or 13.6 percent of the U.S. population," up 134,000 residents from July 2023 to July 2024, "driven by positive net migration." Nonmetro employment grew 0.6% from 2023 to 2024 against 1.08% in metro areas, and had surpassed its 2019 level by 2024. The "annual average nonmetro unemployment rate increased from 3.7 percent in 2023 to 4.0 percent in 2024." And the two largest rural employers are not farms: healthcare and social assistance held 14.1% of nonmetro employment in 2024 and manufacturing 13.3%. Three things follow for a recruiter. The rural pool is small in absolute terms and nearly fully employed, so the people you want are working and won't be found by a board — the national version of the same fact is the BLS's 23.45 employed people per unemployed one in July 2026. The biggest rural hiring problems are the county hospital's and the plant's, which is why the CNA page and the manufacturing guide apply here as much as the ag pages. And rural employment is growing, slowly, on migration — new residents who don't yet have the network, and can be reached by an ad.
The small-circle arithmetic: why rural is possible, not cheaper
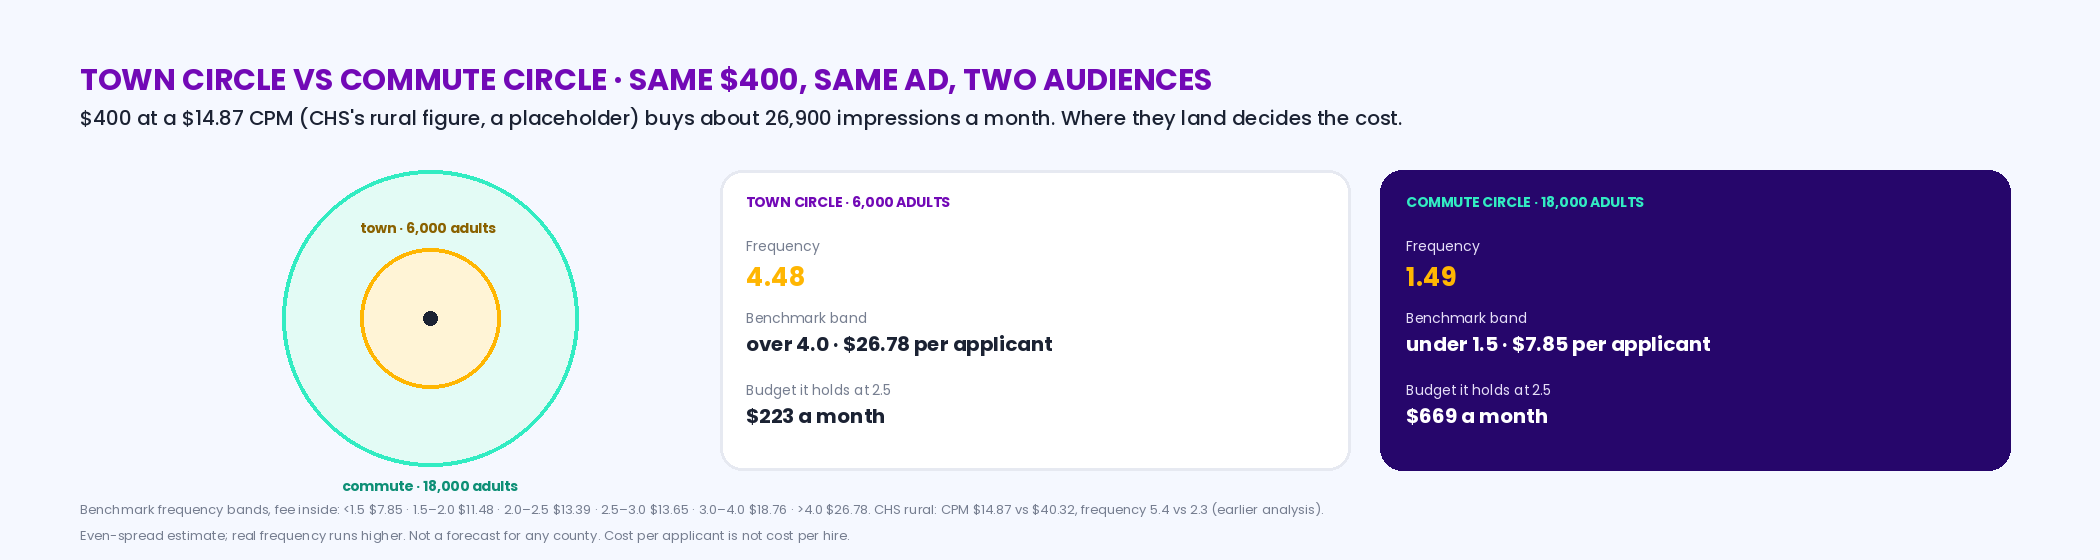
Every employment ad on Facebook and Instagram runs under Meta's Special Ad Category, and one of its rules decides rural recruiting: any city or pin-drop audience is widened to a minimum radius of 15 miles in the US, with no ZIP targeting and no exclusions (the rules). In a metro that's a footnote; in a county seat it's the whole audience — everyone within 15 miles of the elevator, which might be 6,000 adults. Media bought against 6,000 people is spent fast: our benchmark's frequency bands run from a median $7.85 per applicant under 1.5 impressions per person per month to $18.76 at 3.0–4.0 and $26.78 over 4.0, and a small circle crosses 2.5 in a fortnight on a budget a metro wouldn't notice. CHS is the measured case. Its campaigns in North Dakota and South Dakota bought impressions at a CPM of $14.87 against $40.32 in denser markets — cheap reach — but ran at a frequency of 5.4 against 2.3, and cost roughly three times the blended figure per applicant. Cheap impressions, expensive applicants. Agriculture as a whole ran a CPM of $13.09 in that analysis, so the auction is not the problem; repetition is. The fix is geometry: target the commute, not the town — the people who'd drive to the elevator live across the county, and a circle drawn on the county's commuting pattern has three times the adults of the town's — then cap the budget at what that circle absorbs at a frequency of 2.5, and rotate the creative when it passes. The planner below runs both circles side by side.
Interactive
Town circle vs commute circle — media, your CPM, and the adults in each circle; see the frequency each one produces, its benchmark band, and the budget each can hold at 2.5
Nothing is stored or sent — this runs in your browser. Adults per circle come from your ad account's audience estimate (or a rough census count); the CPM is yours, with CHS's rural $14.87 as a placeholder. A planning estimate, not a measurement.
Small-town recruiting channels, in the order they work
The channel order for a small town is the same six channels as anywhere, in a different order, and the order is set by the fact that the pool is employed and known. The network first: a referral bonus that pays in installments, a text list of last year's crew, the co-op's member newsletter, the church bulletin, the high school and the community college's ag or nursing program. The feed second, because it reaches the employed majority without a search, with the site, the wage and the shift in the first line and the commute circle as the audience; in the earlier agriculture analysis 46% of applicants were aged 35 to 54 and the 25-to-44 group was cheapest — organic response, since employment ads can't target age. The walk-in third: a Tuesday afternoon at the elevator or the plant office, announced in the feed, where the manager is in the room and the offer is on the spot; the dated version of that, the open house, is the cheapest structure we run at a median $8.02 per applicant across 78 campaigns, and the open house page has it. Boards last, and only for the licensed roles people search for — the RN, the CDL driver — and even those read the feed. Small-town recruiting fails when it runs in the metro order: a board posting nobody in the county searches, a national ad with no wage, and a manager who calls back next week.
Recruiting in small towns: what the offer has to beat
The channel order above gets the job in front of people. What decides whether they answer is that almost everyone you reach already has a job, and in a small town they probably know someone who works for you. So the offer is judged against the job they have now, on a handful of things they can check in a sentence:
- The wage, stated. Everyone in the county knows the going rate at the plant, the hospital and the co-op. An ad without a number reads as below it.
- The commute, in minutes. "Twenty minutes from Main Street" is a reason to move for someone driving forty to the county seat now.
- The schedule, exactly. Shift times, weekends, and whether harvest or census swings change them. A small-town worker often has a second job or a farm to fit around.
- The person. Name the manager or show the crew. In a town where people know each other, a familiar face does more than a logo.
- The callback. The employed applicant is not in a hurry, but they will take the first serious call, and the other employers in the circle are calling the same people.
Recruiting in small towns works when the ad answers those five before the applicant has to ask, then the commute circle and the frequency cap above keep the same few thousand adults from tiring of it.
Co-op hiring: the agricultural case, and the curve that's publishable
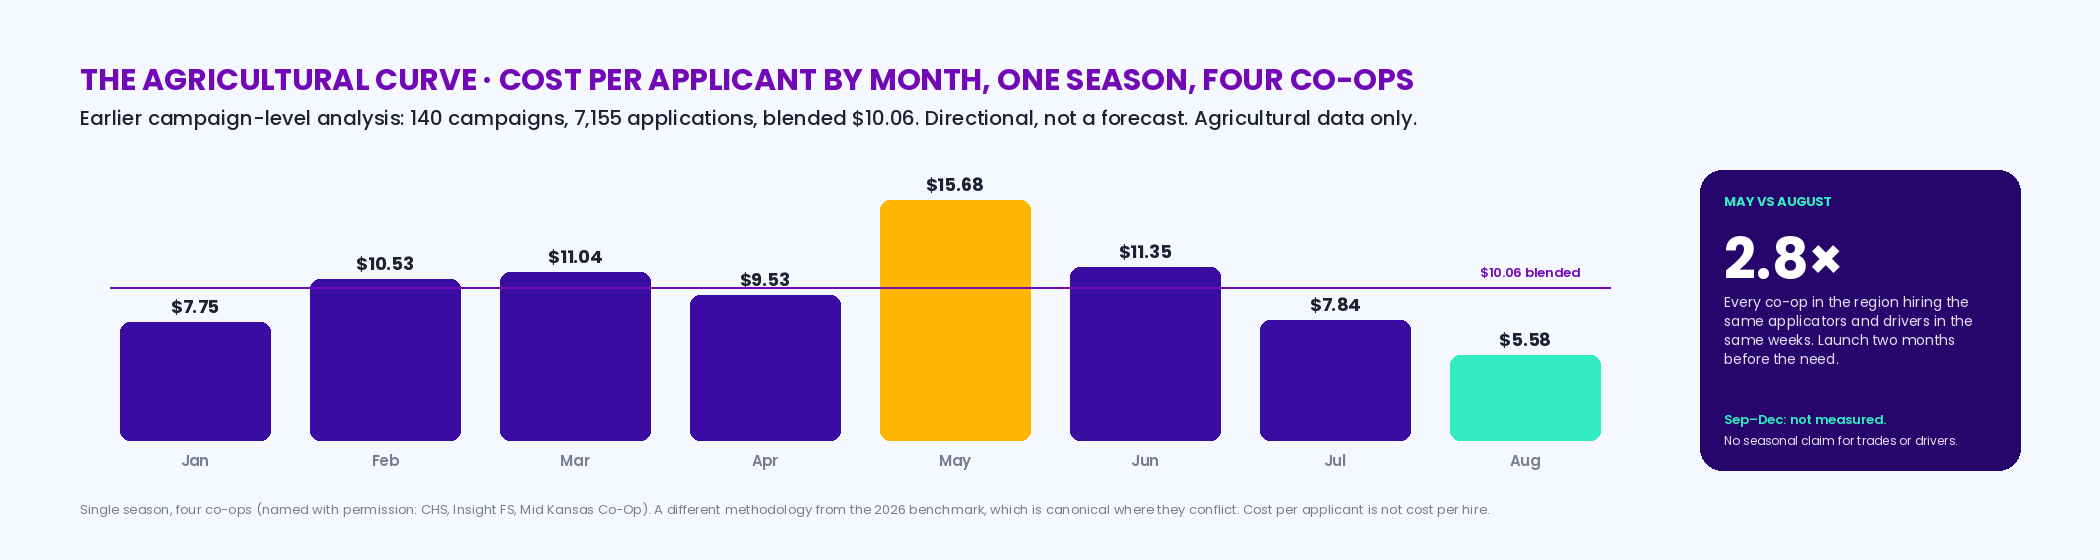
A co-op is the concentrated version of every rural hiring problem: six departments that are six different recruits (sales, energy, plant operations, seasonal, mechanics, applicators, drivers), a location in every town across a region, a season that decides the calendar, and a member base that is also the referral network. The department-by-department playbook, one campaign per location, and what the named co-ops have in common are on the agribusiness and co-op page; the month-by-month cost table is on the seasonal curve page. What matters for geography is the timing, because in agriculture the calendar is a bigger cost driver than the circle. In our earlier analysis of one season across four co-ops — 140 campaigns, 7,155 applications, a blended $10.06 per applicant — cost per applicant ran $7.75 in January, $10.53 in February, $11.04 in March, $9.53 in April, $15.68 in May, $11.35 in June, $7.84 in July and $5.58 in August: May cost 2.8 times August, because every co-op in the region was hiring the same applicators and drivers in the same weeks. Single season, four co-ops, directional. The lesson is to launch two months before the need, when the auction is quiet and the crew is still reachable, and the planner below does that arithmetic. This is agricultural data and we publish it as such; we have no measured seasonal curve for trades or for drivers and make no claim about one.
Interactive
Season window planner — the month you need the crew and how many applicants; see that month against the agricultural curve, the launch month, and what the same applicants cost in each
Nothing is stored or sent — this runs in your browser. The curve is agricultural: one season, four co-ops, 140 campaigns, an earlier campaign-level analysis. Directional, not a forecast; September to December were not measured.
agricultural curve, earlier analysis
need month minus lead time
applicants × that month's figure
applicants × the launch month's figure
The named co-ops, and what they show
Three co-ops have agreed to be named: CHS, Insight FS and Mid Kansas Co-Op. What they have in common is the shape of the problem — many locations across a region, the same six departments in each, a season that compresses hiring into weeks — and what they show is the two findings on this page. CHS's rural campaigns are the measured case for the circle: cheap impressions ($14.87 CPM against $40.32) at a frequency of 5.4 against 2.3, and roughly three times the blended cost per applicant, which is why the program caps budget by location and targets the commute. The four-co-op season is the measured case for the calendar: May at $15.68 against August at $5.58. Both are earlier, campaign-level analyses with a different methodology from the 2026 benchmark, which is canonical where they conflict, and the cross-industry benchmark median is $13.88 per applicant. The role-by-role figures — sales $2.16, energy $2.28, plant operations $5.56, seasonal $5.93, mechanic $9.19, applicator $10.83, CDL driver $21.13 — are on the co-op page, with the reasons each sits where it does.
Rural hospitals and rural plants: the same geometry, different roles
The USDA's two largest rural employers, healthcare and manufacturing, hire the same way a co-op does and rarely think of themselves that way. A county hospital or a senior living campus in a town of 8,000 is recruiting CNAs and nurses from a circle that every other employer in the county also draws; its commute circle is the county, its referral network is the nursing program forty minutes away, and its frequency problem is identical to the elevator's. A plant at the edge of town is recruiting production and maintenance from the same circle, and its cheapest channel is the shift-change conversation. What differs is the role ladder — a CNA ran a median $7.72 per applicant in the benchmark, a registered nurse $19.08, warehouse and production $9.83 — and the licensed roles at the top of it are the ones a board reaches, because those candidates search by title. The multi-location versions of both — a health system with clinics across a region, a manufacturer with plants in three counties — are on the multi-market page, where the 15-mile rule and the state pay-range layer are worked through, and on the multi-unit page for the template-per-role structure.
Volunteer fire departments recruit from one of the smallest circles — the few miles around the station — and the same geometry applies. Our page on volunteer firefighter recruitment works through it for departments, and the correctional officer shortage page covers the rural prison version.
Rural hospital recruitment
Healthcare and social assistance is the largest rural employer in the USDA's count, 14.1% of nonmetro employment in 2024, and rural hospital recruitment is the case where the small circle and the credential gate meet. The practical answer is to recruit each rung of the role ladder from a different radius:
- Aides and CNAs from the commute circle. This is the local, feed-and-referral pool; CNA campaigns ran a median $7.72 per applicant in our 2026 benchmark. Pay for certification and people already working retail or food service in the county become candidates.
- LPNs and RNs from the region. The nursing program forty minutes away is the pipeline; clinical placements and a sign-on tied to the first year are how a county hospital gets its graduates before the city does. LPN campaigns ran a median $12.77 and registered nurse campaigns $19.08.
- Therapists, techs and specialists from anywhere willing to relocate. These candidates search by title, so boards and your own site matter more here, and the offer has to carry the move: housing help, schedule and the size of the team they would join.
Each rung is a separate campaign with its own geography, because a single hospital-wide ad drawn on the town will saturate the aides' circle and never reach the nurse two counties over. The role-by-role detail for clinical hiring is on our healthcare recruiting pillar.
When the ad is the wrong tool in a small town
Three cases. If the network can fill the role — and for most seasonal and entry roles in a town with a co-op it can — spend the money on the referral bonus and the text list, and run the ad only for the remainder. If the circle is so small that its budget cap at a frequency of 2.5 is less than a hundred dollars a month, the campaign will produce a handful of applicants and no more; the honest answer is to widen to the commute, share a campaign with the next town, or accept the handful. And if the role is licensed and searched by title — the RN, the CDL driver — the board reaches the county's searchers first, and the feed reaches the employed ones; run both, and tag the source so next year's decision is on your own numbers. The CDL page has the driver version, where the applicant who answers is 55 and over and lives in exactly these counties.
Related: Employee Transportation.
Frequently asked questions
What is co-op hiring?
On this page, hiring for an agricultural cooperative — a member-owned business with grain, agronomy, energy, feed and retail locations across a region, recruiting six different departments (sales, energy, plant operations, seasonal crews, mechanics, applicators and CDL drivers) in every town it serves, with a season that compresses hiring into weeks. The department-by-department playbook, one campaign per location, and the named co-ops' figures are on the agribusiness and co-op page. The phrase also means student cooperative-education placements, which is a different subject.
Why is rural hiring harder?
The pool is small and employed, and the ad circle is fixed. The USDA counts 46.2 million nonmetro residents, 13.6% of the US, with a 4.0% nonmetro unemployment rate in 2024; the people you want are working. Meta's employment rules widen any local audience to a 15-mile minimum radius, so a campaign for a small town saturates fast — CHS's rural campaigns ran at a frequency of 5.4 against 2.3 in dense markets and cost about three times the blended figure per applicant despite a CPM of $14.87 against $40.32. Rural is possible, not cheaper.
How do you recruit in a small town?
Network first, feed second, walk-in third, boards last. Run a referral bonus that pays in installments and keep a text list of last year's crew; run a social campaign with the site, wage and shift in the first line, targeted at the commute circle rather than the town, capped at what that circle absorbs at a frequency of 2.5; hold a walk-in afternoon where the manager makes offers in the room; and use boards only for the licensed roles people search by title. The employed majority — 23.45 employed per unemployed nationally in July 2026 — is reached by the first two, not the last.
Is advertising cheaper in rural areas?
Impressions are; applicants aren't. Agriculture ran a CPM of $13.09 in our earlier analysis and CHS's rural campaigns $14.87 against $40.32 in dense markets, so the auction is cheap. But a small audience sees the same ad over and over, and in the benchmark cost per applicant rises with frequency — $7.85 under 1.5, $26.78 over 4.0. CHS's rural campaigns cost roughly three times the blended figure. Target the commute and cap the budget.
When should a co-op start recruiting for the season?
Two months before the need, on the agricultural curve. In our earlier analysis of one season across four co-ops, cost per applicant ran $7.75 in January, $15.68 in May and $5.58 in August — May cost 2.8 times August, because every co-op in the region was hiring the same applicators and drivers in the same weeks. Launching in March for a May crew buys the quieter auction; the season window planner on this page does the arithmetic. Agricultural data only; single season; directional.
Does the seasonal cost curve apply to trades or truck drivers?
We don't know, and we don't claim it does. The curve we publish is agricultural — one season, four co-ops, 140 campaigns — and we have not measured a seasonal cost pattern for trades or for CDL drivers, so this page makes no seasonal claim for either. Their figures are on their own pages and are not seasonal.
What does rural recruiting cost per applicant?
There is no single rural figure. The cross-industry benchmark median is $13.88 per applicant; agriculture ran a blended $10.06 in an earlier analysis with roles from sales at $2.16 to CDL drivers at $21.13; CHS's rural campaigns ran about three times the blended figure because of frequency. Where a rural campaign lands depends on the circle, the role and the month more than on the fact that it's rural. Cost per applicant is not cost per hire.
How is this page different from the co-op recruiting page?
That page is the how for a co-op: six departments as six recruits, one campaign per location, the calendar, and the named co-ops' figures. This page is the geography for any rural employer — a hospital, a plant, a co-op — the USDA's numbers, the small-circle arithmetic, the commute circle, the channel order for a small town, and the agricultural curve as the timing case. A co-op needs both; a county hospital needs this one and the healthcare pages.
How do I recruit hourly workers in a rural area?
Referrals first, then a social job ad aimed at the commute area rather than the town, with the wage, shift and site in the first line and a short in-platform form. Cap the budget so the same small audience doesn't see the ad over and over: in Boostpoint's 2026 Social Job Advertising Benchmark, median cost per applicant was $7.85 below a monthly frequency of 1.5 and $26.78 above 4.0. Call applicants back the same day.
How do you recruit in a rural area for a licensed role nobody in the county holds?
Widen the circle or build the person. For a licensed or skilled role, such as a nurse, a diesel mechanic or a pesticide applicator, the local commute circle may simply not contain one, so run that role as its own campaign drawn on the region, and put the things a mover weighs in the first lines: the rate, the schedule, housing help or a relocation stipend if you offer one, and what the town has. At the same time, grow the next one: pay for the credential of someone already working in the county and state in the ad that you do. The rest of the rural playbook on this page (network first, the commute circle, a budget capped to what the circle absorbs) still applies to every entry role around them.
Draw the right circle
Bring your locations and the month you need the crew. We'll draw the commute circle for each site, cap the budget at what it absorbs, place each role on the benchmark band, and show you the rural programs closest to yours.
Book a DemoUSDA Economic Research Service, Rural America at a Glance: 2025 Edition (EIB-295, January 20, 2026): nonmetro population 46.2 million, 13.6% of the US; +134,000 residents July 2023–July 2024; nonmetro employment +0.6% 2023–2024 vs 1.08% metro; nonmetro unemployment 3.7% (2023) to 4.0% (2024); healthcare and social assistance 14.1% and manufacturing 13.3% of nonmetro employment in 2024. BLS Employment Situation, July 2026. Meta Business Help Center via our Special Ad Category page (read August 25, 2026): 15-mile minimum radius. Boostpoint figures from the 2026 Social Job Advertising Benchmark — 891 campaigns and 1,334 campaign-months: median $13.88 per applicant, $8.02 volume-weighted; frequency bands under 1.5 $7.85, 1.5–2.0 $11.48, 2.0–2.5 $13.39, 2.5–3.0 $13.65, 3.0–4.0 $18.76, over 4.0 $26.78, 33% of budget above 3.0, act at 2.5; event-driven campaigns $8.02 (78); role families CNA $7.72, registered nurse $19.08, warehouse/production $9.83. Earlier campaign-level agriculture analysis (a different methodology; the benchmark is canonical where they conflict): 140 campaigns, 4 co-ops, 7,155 applications, blended $10.06; monthly curve Jan $7.75, Feb $10.53, Mar $11.04, Apr $9.53, May $15.68, Jun $11.35, Jul $7.84, Aug $5.58 (single season, directional; September–December not measured); roles sales $2.16, energy $2.28, plant operations $5.56, seasonal $5.93, mechanic $9.19, applicator $10.83, CDL driver $21.13; CPM $13.09; 46% of applicants aged 35–54; CHS rural ND/SD CPM $14.87 vs $40.32, frequency 5.4 vs 2.3, roughly three times the blended cost. Named with permission: CHS, Insight FS, Mid Kansas Co-Op. Agricultural seasonality only; no seasonal claim for trades or drivers. Boostpoint is priced as a product subscription plus ad spend: the subscription is priced on job volume and quoted on a call, ad spend is separate and recommended at a minimum of $750 a month per job category, there is one bill, through Boostpoint, and every cost-per-applicant figure we publish includes campaign management. The planners compute on the reader's inputs. Cost per applicant is not cost per hire; we do not track hires and publish no cost-per-hire figure. A sample of Boostpoint campaigns, not an industry-wide study.