
Peak Season Staffing: Plan Backwards From the Date, Because the Same Campaign Costs 2.8 Times More in the Crunch
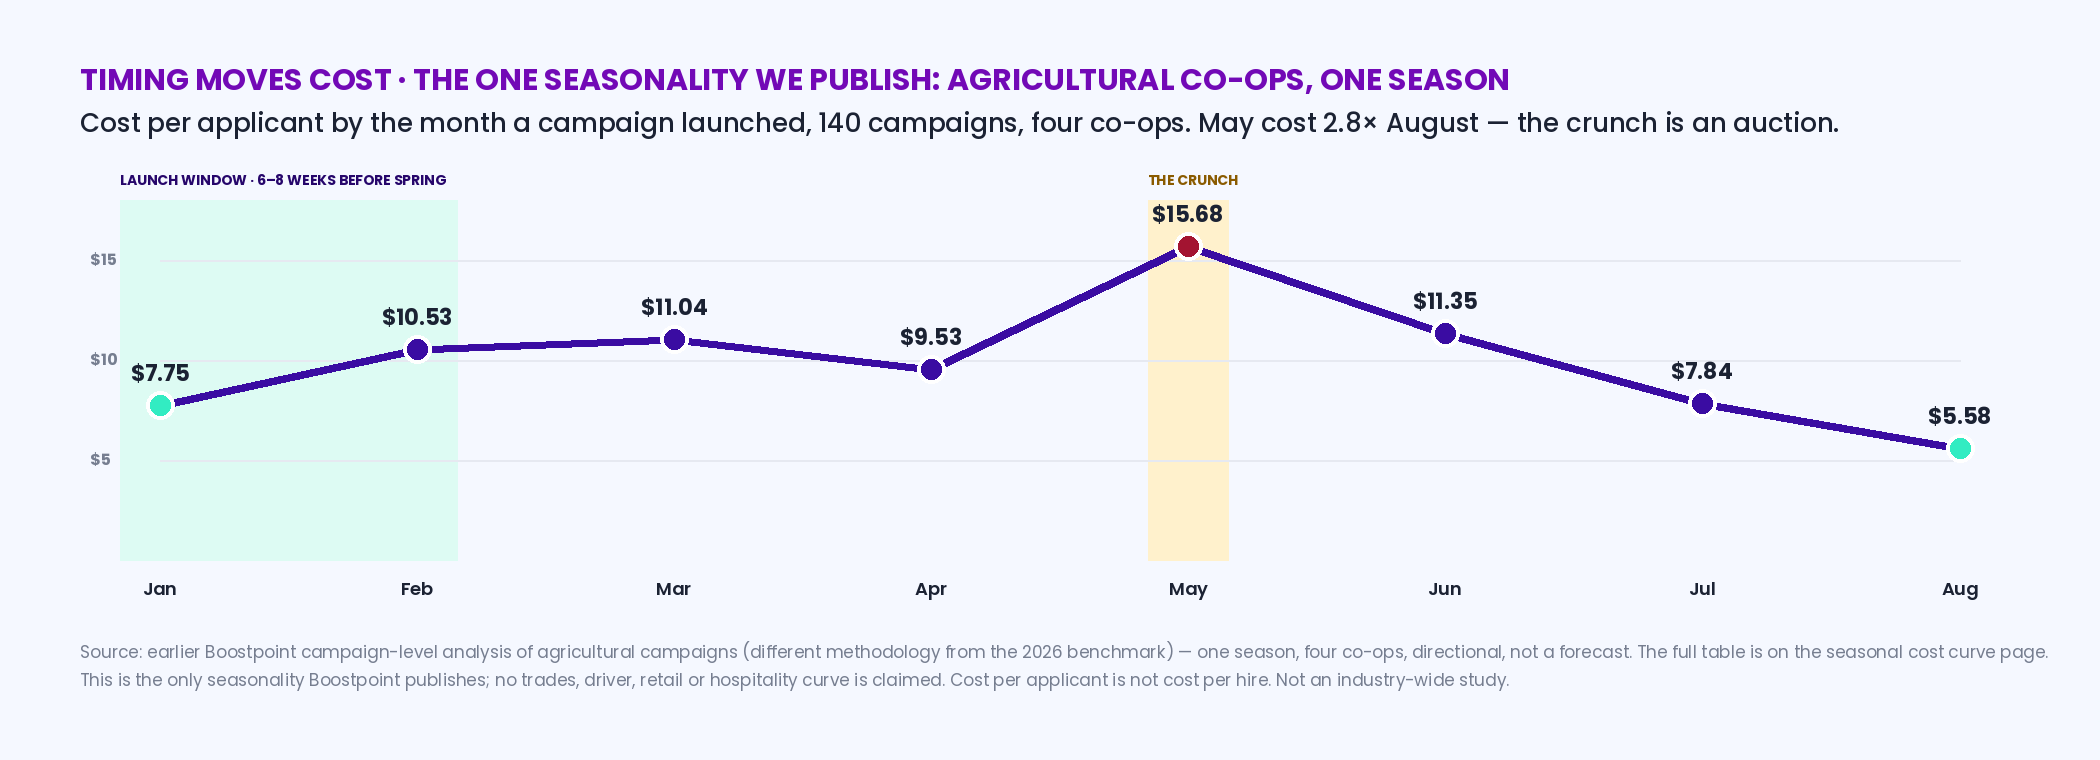
Peak season staffing is a calendar problem before it is a hiring problem. The one seasonality Boostpoint publishes — agricultural co-ops across a full season — shows a campaign launched in May costing $15.68 per applicant against $5.58 in August and $7.75 in January: the same roles, the same markets, 2.8 times the price for launching when everyone else does. So plan backwards from the day people must be on the floor: launch six to eight weeks out, decide the mix of core overtime, seasonal direct hires, and agency cover before the crunch, and build the campaign around the date — the structure that ran at a median $8.02 per applicant.
Source: Boostpoint 2026 Social Job Advertising Benchmark — 891 Boostpoint-managed campaigns on Meta (1,334 campaign-months), 2026; costs are what advertisers paid for advertising only.
A note on who's writing this
Boostpoint runs social media job ads, so the part of a peak-season plan that involves advertising is the part we sell. This page is about the plan, and it stays out of the execution, which is on mass hiring — budgets, role costs, the temp-agency comparison, the day-by-day. One thing to be clear about: the only seasonality we publish is agricultural, because that is the only dataset where we ran a full season across several employers. Retail, hospitality, and logistics peaks are real, and third parties describe them below, but we don't have month-by-month cost figures for them and won't imply we do. Nothing here is a cost-per-hire figure.
What a peak is, and who has one
A peak is a period when the work exceeds the people, on a date you can see coming. Retail's is the holiday season: the National Retail Federation expected retailers to hire 265,000 to 365,000 seasonal workers for the 2025 holidays, down from 442,000 in 2024, with some hiring "pulled forward" to October buying events (NRF, November 6, 2025). Agriculture's are spring application and harvest: USDA counts 189,764 employees at farmer, rancher, and fishery cooperatives, about 21% of them part-time or seasonal (2024) — the co-op version of the plan is on agribusiness and co-op recruiting. Hospitality has summer and the holidays; logistics has the fourth quarter; tax and accounting have the spring; camps, parks, and pools have June. What they share is not the month but the shape: a fixed date, a headcount above the base, a labor pool every competitor is drawing from at the same time, and a hiring process that has to finish before the date rather than start on it.
Why the date moves the cost: the one curve we publish
The clearest evidence that timing is a cost lever comes from agricultural co-ops, where we measured a full season across 140 campaigns for four employers. Cost per applicant by the month the campaign launched: January $7.75, February $10.53, March $11.04, April $9.53, May $15.68, June $11.35, July $7.84, August $5.58. May cost 2.8 times August, and May also produced fewer than half the applications of March — you pay more and get less, because by the crunch everyone who was going to move has moved and every employer in the region is bidding for the rest. One season, four co-ops, directional rather than a forecast, and the full table with the reasoning is on the seasonal cost curve. The lesson transfers even where the numbers don't: a peak is an auction, and the auction is cheapest before the other bidders arrive. That is the whole argument for planning backwards. The other half of the argument is what the unfilled seats cost while you wait, which the cost of vacancy calculator prices per day.
The backwards calendar
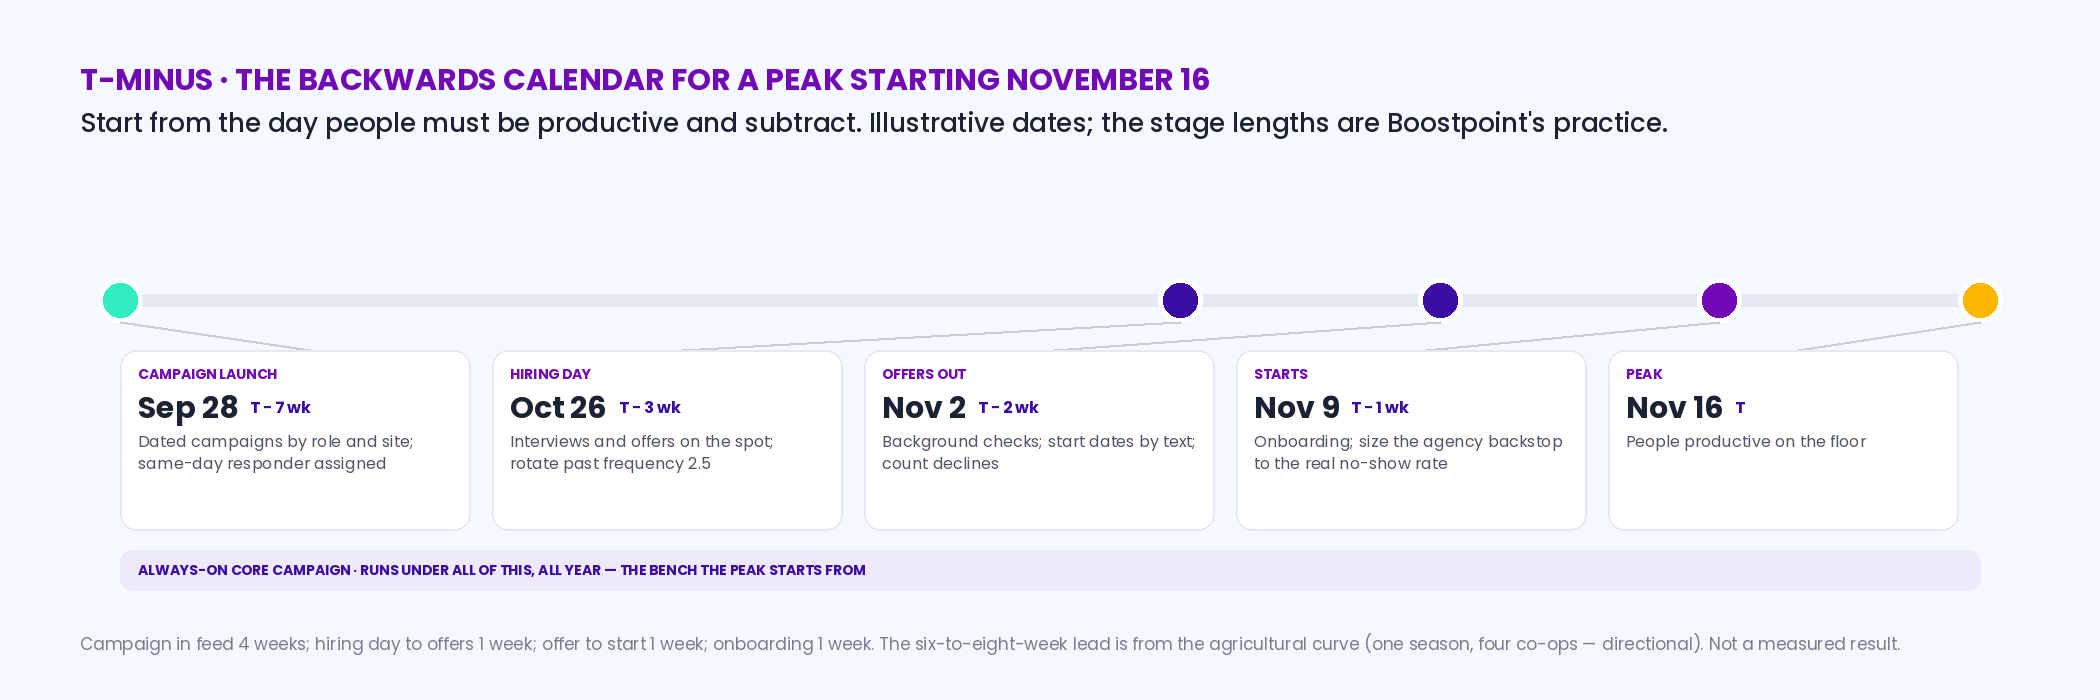
Start from the day people must be productive and subtract. Training and onboarding take a week or two, so starts are before that. Offers and background checks take a week, so offers are before that. Interviews — ideally a hiring day at the site, which is the event-driven structure that ran at a median $8.02 per applicant with a 21% apply rate in the 2026 benchmark — take a week to schedule and hold. And the campaign that fills the hiring day needs three to four weeks in the feed to reach people who aren't searching, which is where the six-to-eight-week lead comes from. Add it up and a peak that starts November 15 has a campaign launch in late September, a hiring day in mid-October, offers by the end of October, and starts the first week of November. Every week later than that is a week closer to the auction.
Interactive
Backwards planner — enter the date people must be on the floor
Nothing is stored or sent — this runs in your browser. The stage lengths are Boostpoint's practice; change them to yours. Applicants needed uses your own funnel ratios — we publish no seasonal funnel.
Stage lengths (campaign in feed 4 weeks; hiring day to offers 1 week; offer to start and onboarding as entered) are Boostpoint's practice, not measured results; the six-to-eight-week lead is from the agricultural curve. Applicants per hire is yours. This estimates volume and dates, not cost: cost per applicant is not cost per hire, and this page computes neither.
Longer shifts are the usual first answer to a peak, and in California, Alaska, Nevada and Colorado they carry a premium that a longer week does not; our page on overtime laws by state prices four common patterns against each rule.
The mix: core, seasonal direct, agency
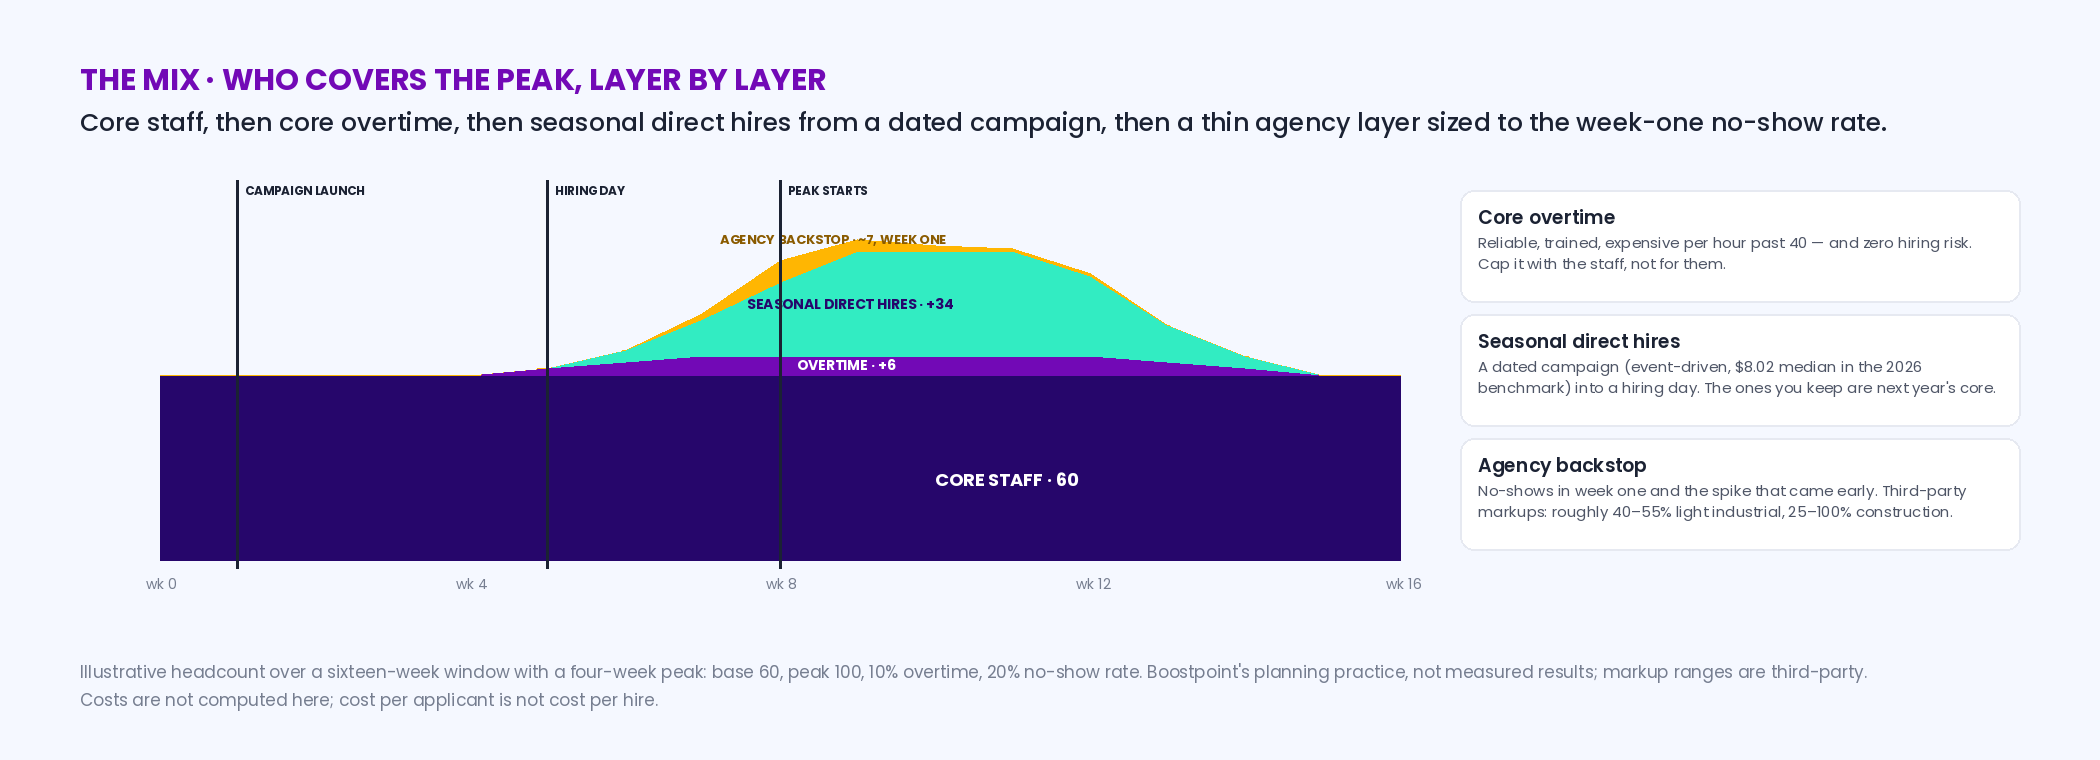
The second planning decision is who covers the peak, and it has three answers that most employers use together. Core staff on more hours covers the first slice — reliable, trained, and the most expensive per hour once overtime starts, but with zero hiring risk. Seasonal direct hires cover the middle — recruited with a dated campaign, interviewed at a hiring day, trained in a week, and, for the ones you keep, the next year's core. Agency cover handles the last slice and the surprises — the no-shows in week one, the spike that came a week early — at a markup on the wage that third-party sources put at roughly 40–55% for light industrial work and 25–100% in construction, priced for speed and for carrying the employment. The mix is not a moral question; it is a question of how many weeks the peak lasts and how much notice you have. A two-week surge with no notice is an agency problem. An eight-week season you can see in July is a direct-hire problem with an agency backstop. The markups and what's negotiable are on staffing agency markup and fees; the agency-versus-advertising decision in detail is on the mass hiring page.
Interactive
Staffing mix — how much of the peak each layer covers
Nothing is stored or sent — this runs in your browser. Enter base and peak headcount and how much overtime the core can absorb; the rest splits between seasonal direct hires and an agency backstop sized to your no-show rate.
Arithmetic on your inputs: overtime heads = base × overtime %; seasonal gap = peak − base − overtime heads; direct hires = the gap; agency backstop = direct hires × no-show rate, rounded up — the cover you'd need in week one if that share doesn't start. Whether to fill the backstop with an agency or over-hire directly is your call; neither cost is computed here.
Which campaign structure fits which part of the plan
| Structure | Median cost per applicant | Apply rate | Click-through | Campaigns | Where it belongs in a peak plan |
|---|---|---|---|---|---|
| Event-driven | $8.02 | 21% | 1.53% | 78 | The seasonal direct hires: a dated hiring day, advertised for three to four weeks, offers on the spot |
| Multi-role / always-on | $9.83 | 12% | 1.10% | 46 | The core: one standing campaign that keeps a bench warm all year, so the peak starts from a list, not a blank page |
| Single-role | $14.45 | 18% | 1.36% | 1,210 | The late replacement — what you run when the plan slipped; the most expensive structure, and the one most peaks default to |
Source: Boostpoint 2026 Social Job Advertising Benchmark — 891 Boostpoint-managed campaigns on Meta (1,334 campaign-months), 2026; costs are what advertisers paid for advertising only.
Two operating rules come with the structures. The campaign for a peak is several small campaigns, not one large one: the median campaign-month in the benchmark ran on $334 and produced 20 applicants, and a peak of forty hires is a handful of campaigns by role and by site, each with its own hiring day. And in the weeks before a peak, frequency climbs fast — the same shift workers in the same radius see the ad repeatedly — so the weekly check and the act-at-2.5 rule from recruiting analytics matter more than usual; the fix is a new first line or a second hiring-day date, not more budget. What happens after the click still decides the cost: applicant conversion explained 70% of the variation across the benchmark, so the seasonal form has to be finishable on a phone in under a minute, and the same-day text has to be staffed before the campaign goes live.
How to hire seasonal employees: what actually changes, and what doesn't
Most of it doesn't. A seasonal employee is an ordinary W-2 employee. The I-9 is due by the third business day after they start work for pay, the same as any hire; federal minimum wage applies; overtime applies after 40 hours; payroll taxes apply. There is no general seasonal exemption from wage and hour law, and the belief that there is one is the most common way a peak turns into a Department of Labor file.
Four things genuinely do work differently, and it is worth knowing which is which before someone in payroll assumes otherwise.
1. Two federal definitions of "seasonal", and they are not the same
The Affordable Care Act uses two similar terms for two different jobs, which causes more confusion than any other point here.
- Seasonal worker decides whether you are a large employer at all. Under the IRS rule, an employer is not treated as having more than 50 full-time employees if its workforce exceeds 50 for 120 days or fewer in the calendar year and the employees above 50 during that period are seasonal workers. A retailer that sits at 44 people all year and runs 70 for eleven weeks is not an applicable large employer.
- Seasonal employee decides how you measure one person's hours. The regulation defines it as "an employee who is hired into a position for which the customary annual employment is six months or less" — which lets you use a measurement period rather than offering coverage from day one.
The first is about your headcount. The second is about their hours. Getting them backwards is what produces a surprise coverage obligation in January.
2. One real wage-and-hour exemption, and it is narrower than people think
FLSA section 13(a)(3) exempts employees of a seasonal amusement or recreational establishment from both minimum wage and overtime. An establishment qualifies if either it "does not operate for more than seven months in any calendar year", or, in the preceding calendar year, "its average receipts for any six months of such year were not more than 33-1/3 per centum of its average receipts for the other six months".
That covers campgrounds, waterparks, ski areas, summer camps, county fairs. It does not cover a retailer with a busy fourth quarter, a warehouse with a peak, a landscaping company or a restaurant that is quiet in February. If your business runs all year and merely gets busier, you are paying overtime.
3. Teenagers, if your peak runs through a school term
Fourteen- and fifteen-year-olds are a real part of the seasonal labor pool in retail and food service, and the federal hours rule is specific. Under 29 CFR 570.35, work must be outside school hours and limited to 3 hours a day and 18 hours a week when school is in session, 8 hours a day and 40 hours a week when it is not, and between 7 a.m. and 7 p.m. — except from 1 June through Labor Day, when the evening limit moves to 9 p.m.
A summer peak is therefore much easier to staff with sixteen-year-olds than a holiday peak. State law is often stricter than the federal floor and the stricter rule wins; our child labor laws by state page has the state-by-state position.
4. If the labor genuinely isn't there
For a need that is genuinely temporary and seasonal, and where the domestic pool is exhausted, the H-2B program exists — with a statutory cap, a certification process and a lead time measured in months, not weeks. It is a planning decision made a year out, not a rescue in October. See H-2B for employers.
The cheapest seasonal hire is last year's. None of the above applies to someone you already employed. Keep a rehire list with phone numbers, text it before you open a campaign, and you will fill a share of the peak at zero advertising cost — the single largest saving available in seasonal hiring, and the one most often skipped because nobody owns the list.
A planning checklist, by weeks out
- Twelve weeks out: set the date, the peak headcount, and the mix. Decide the overtime ceiling with the core staff, not for them. Book the hiring-day room. Confirm the agency's terms and markup now, while you don't need them.
- Eight weeks out: launch the dated campaigns — one per role family and site — with the date, the pay, the shift, and the hiring day in the first line. Turn the always-on core campaign's lead role to the seasonal role. Assign the person who answers every applicant within the hour.
- Four weeks out: the hiring day. Interview and offer on the spot; schedule starts by week. Check frequency on every campaign and rotate anything past 2.5.
- Three weeks out: offers out, background checks running, start dates confirmed by text. Count declines; if they exceed the plan, run a second hiring day rather than a longer campaign.
- One week out: onboarding. Size the agency backstop to the real no-show rate from the first cohort, not the assumed one. Keep the campaign on for the replacements you already know are coming.
- After the peak: tell every seasonal hire you'd want back that you want them back, with a date. Next year's peak starts from that list — and from the always-on campaign that never turned off.
A peak is an auction with a date on it. Bid before the other bidders arrive, and decide the mix while you still have the time to decide.
Frequently asked questions
Do seasonal employees get overtime?
Yes, in almost every case. A seasonal employee is an ordinary W-2 employee and the Fair Labor Standards Act applies in full: minimum wage, and overtime after 40 hours in a workweek. The main federal exception is section 13(a)(3), which exempts seasonal amusement or recreational establishments — campgrounds, waterparks, ski areas, camps, fairs — that either do not operate more than seven months in a calendar year, or whose average receipts for any six months of the preceding year were not more than 33-1/3 percent of the average for the other six. A retailer or warehouse with a busy quarter does not qualify.
What counts as a seasonal employee under the ACA?
Two different terms do two different jobs. A seasonal worker affects whether you are an applicable large employer at all: if your workforce exceeds 50 full-time employees for 120 days or fewer in the calendar year and the excess are seasonal workers, you are not treated as having more than 50. A seasonal employee is defined in the regulation as one "hired into a position for which the customary annual employment is six months or less", and that determines how you measure their hours for a coverage offer. The first is about headcount; the second is about one person's hours.
How many hours can a 15-year-old work in a seasonal job?
Under the federal rule at 29 CFR 570.35, 14- and 15-year-olds may work only outside school hours, up to 3 hours a day and 18 hours a week when school is in session, and up to 8 hours a day and 40 hours a week when it is not. Hours must fall between 7 a.m. and 7 p.m., except from 1 June through Labor Day when the evening limit moves to 9 p.m. Many states are stricter, and the stricter rule applies.
What is peak season staffing?
Planning and filling the headcount a business needs above its base for a predictable period — the retail holidays, an agricultural application season or harvest, a summer in hospitality, the fourth quarter in logistics. It has three parts: a backwards calendar from the date, a mix of core overtime, seasonal direct hires, and agency cover, and campaigns built around the date rather than around each vacancy.
How far in advance should you hire for peak season?
Launch recruiting six to eight weeks before people must be productive, with the hiring day about four weeks out and offers three weeks out. The evidence for the lead is the one seasonality we publish: across an agricultural season, a campaign launched in May cost $15.68 per applicant against $5.58 in August and $7.75 in January — 2.8 times the price for launching in the crunch, with fewer applicants.
Should you use a staffing agency for seasonal hiring?
As a backstop, usually; as the whole plan, only when the peak arrives with no notice or lasts a couple of weeks. Third-party sources put temp markups at roughly 40–55% on light industrial wages and 25–100% in construction, which buys speed and carries the employment. Size the agency layer to your week-one no-show rate and fill the rest with dated direct-hire campaigns; the comparison in detail is on our mass hiring page.
How many seasonal workers do retailers hire?
The National Retail Federation expected retailers to hire between 265,000 and 365,000 seasonal workers for the 2025 holiday season, down from 442,000 in 2024, and noted some hiring was pulled forward to October (NRF, November 6, 2025). We publish no retail-specific cost figures; the retail peak is described here by NRF, not by our data.
What is the cheapest way to recruit for a peak?
Build the campaign around the date. In our 2026 benchmark, event-driven campaigns — a hiring day, an opening, a season start — produced applicants at a median $8.02 with a 21% apply rate, against $14.45 for single-role campaigns launched after each vacancy. Run several small campaigns by role and site (the median campaign-month was $334 for 20 applicants), keep the form under a minute, and answer the same day. Cost per applicant is not cost per hire.
Does seasonal hiring cost more in some months?
In agriculture, measurably: January $7.75 per applicant, May $15.68, August $5.58 across one season for four co-ops — directional, not a forecast. That is the only seasonality we publish; we have no month-by-month figures for trades, drivers, retail, or hospitality and don't claim any. The pattern — the crunch is an auction — is the reason to plan backwards in any industry.
How do you keep seasonal workers from year to year?
Ask them, with a date, before they leave, and keep an always-on campaign running so the list is warm. A multi-role always-on campaign ran at a median $9.83 per applicant in the 2026 benchmark and its value in a peak plan is the bench it builds; the seasonal hires you invite back are next year's core, which shrinks next year's gap and next year's agency layer.
How is peak season staffing different from mass hiring?
Peak season staffing is the plan — the date, the mix, and the calendar; mass hiring is the execution — the budgets, the role costs, the day-by-day of filling many roles fast. Our mass hiring page owns the second; this page owns the first, and the two are meant to be read together.
How do you hire seasonal workers?
Work backwards from the date they must be on the floor. Text last year's seasonal staff first, then launch a dated campaign six to eight weeks out that advertises a hiring day at the site, with the pay, the dates and the shifts in the first line and a short mobile form behind it. Interview and make offers on the day, and hire them as ordinary W-2 employees: the I-9, minimum wage and overtime rules apply as they do to any hire. In Boostpoint's 2026 Social Job Advertising Benchmark, the event-driven structure ran a median $8.02 per applicant with a 21% apply rate.
Plan the peak before the auction starts
We'll set the calendar backwards from your date, build the dated campaigns by role and site, and keep the core campaign on all year — every number and the seasonal campaigns closest to yours to compare against.
Book a DemoBoostpoint figures come from the 2026 Social Job Advertising Benchmark — 891 campaigns and 1,334 campaign-months: event-driven median cost per applicant $8.02, 21% apply rate, 1.53% click-through, 78 campaigns; multi-role / always-on $9.83, 12%, 1.10%, 46; single-role $14.45, 18%, 1.36%, 1,210; median campaign-month $334, 20 applicants, 6,061 reached; frequency rule 2.5; applicant conversion explains 70% of cost variation. Seasonal figures come from an earlier campaign-level analysis of agricultural campaigns (different methodology): 140 campaigns, 4 co-ops, cost per applicant by launch month January $7.75, February $10.53, March $11.04, April $9.53, May $15.68, June $11.35, July $7.84, August $5.58 — one season, directional, not a forecast; it is the only seasonality Boostpoint publishes, and no trades, driver, retail, or hospitality seasonality is claimed. Third-party figures are NRF's (November 6, 2025), USDA Rural Development's (Agricultural Cooperative Statistics 2024), and the staffing-markup ranges published by LG Resources, The Resource Company, getproductiv, Leapros, and Hunter Recruiting, attributed in place. The backwards calendar, stage lengths, staffing mix, and checklist are Boostpoint's planning practice, not measured results; the calculators run on your inputs. Cost per applicant is not cost per hire; we do not track hires and publish no cost-per-hire figure. A sample of Boostpoint campaigns, not an industry-wide study.